

The battle between OpenAI’s ChatGPT and Google’s Gemini is one of the most talked-about stories in technology today. These two artificial intelligence (AI) chatbots dominate the market for generative AI tools. They power smart responses, summaries, writing help, and more.
As users and businesses rely on AI more, questions about market competition and environmental impacts have grown. This article compares the two leaders in terms of market share, energy use, carbon footprint, and water consumption to give a clear picture of where the AI landscape stands in 2026.
Market Share: Where ChatGPT and Gemini Stand
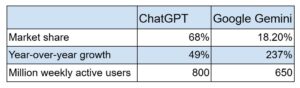
As of early 2026, ChatGPT still leads the AI chatbot market. ChatGPT has around 68% of the market share based on visits and user interactions. This is less than its previous dominance.
In comparison, Google Gemini accounts for about 18.2% of the market share, showing rapid growth over the past year. This shift marks a major change in how users choose AI tools worldwide.
ChatGPT has maintained a large user base with around 800-900 million weekly active users and billions of monthly visits. But Gemini is also growing fast. Its user numbers have increased as Google adds it to more services.
Other AI platforms, such as DeepSeek, Grok, Perplexity, and Claude, hold smaller shares of the market but are growing in niche areas. ChatGPT and Gemini lead the global chatbot market. This shows a duopoly trend, with two main players in control.
The market positions of ChatGPT and Gemini reflect their different strategies. OpenAI built ChatGPT as a standalone AI platform with powerful language skills. It became popular early and gained millions of users quickly.
Google, meanwhile, embedded Gemini into search engines, Android devices, and other Google apps. This gives Gemini a wide reach, helping it grow faster in recent years as users encounter it automatically.
For users, this means choice. Some prefer ChatGPT’s deep text-generation and creative outputs. Others choose Gemini for quick answers tied to search and Android use.
As both platforms grow, competition will likely push innovation in AI quality, safety, and usefulness. And for climate-conscious and environmentalists, this means taking a closer look at the platforms’ growing energy use, carbon emissions, and water use.
AI’s Energy Footprint: Data Centers and Electricity
As AI use expands rapidly, the energy footprint of the technology has become an important topic. AI models like ChatGPT and Gemini run on large networks of servers housed in data centers. These facilities use electricity to power computing tasks and to keep equipment cool.
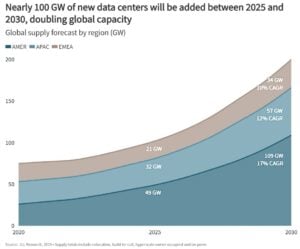
In 2024, data centers used around 415 terawatt-hours (TWh) of electricity. This is about 1.5% of the world’s total electricity consumption. AI workloads are a growing part of this total.
- The International Energy Agency predicts that data center electricity use may double to around 945 TWh by 2030.
This increase comes as AI and other digital services grow. Another research shows the same trend:
AI electricity use varies by task. Training large models—such as initial versions of GPT and other deep learning systems—can consume very large amounts of power. For example, training early large language models used tens of gigawatt-hours of electricity.
- Running the model for user queries (called inference) uses much less energy per request but occurs far more frequently.
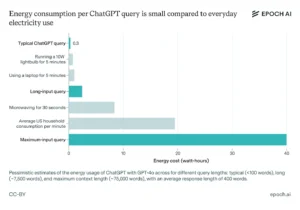
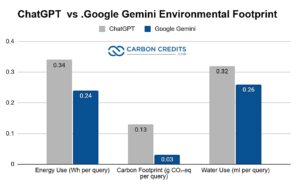
In a direct comparison of per-prompt energy use, Google found that a typical Gemini text prompt consumes about 0.24 watt-hours (Wh) of electricity. This is roughly equivalent to the energy used by a small household device running for a few seconds.
ChatGPT queries, on the other hand, use about 0.34 Wh of electricity. That’s similar to running a lightbulb for a short time. This makes per-query energy costs relatively low but still significant when scaled to billions of daily uses. Over time, improvements in hardware and software have greatly reduced energy and carbon use per prompt.
Carbon in the Cloud: Emissions of AI Systems
Carbon emissions from AI are tied closely to electricity use. Where the electricity comes from—renewable sources versus fossil fuels—greatly affects emissions. Data centers powered by coal or gas produce more carbon than those using wind, solar or hydroelectric power.
Global AI and data centers are currently responsible for a small but growing share of carbon emissions. Combined data center emissions contribute to the broader trend of digital technologies impacting climate change.
Projections show that by 2035, AI’s carbon footprint may vary greatly. This depends on future energy mixes and how AI is deployed. Estimates suggest possible annual emissions ranging from 300 to 500 million tonnes of CO₂ by the mid-2030s. The exact share attributable to AI specifically will vary based on how much AI workloads grow within overall data center use.
ChatGPT and Google’s Gemini differ in their carbon footprints per query. A typical ChatGPT query generates about 0.15 grams of CO₂ per text prompt. In comparison, a typical Google Gemini query emits around 0.03 grams of CO₂ per prompt. This means Gemini’s per-query carbon footprint is about five times lower than ChatGPT’s based on current estimates.
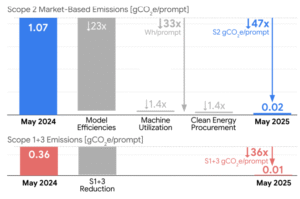
Both companies promise to cut carbon intensity. They plan to do this by improving data center efficiency, buying renewable energy, and upgrading hardware.
For example, Google reported dramatic reductions in energy and carbon footprints for Gemini queries over a one-year period due to efficiency gains and cleaner energy sourcing.
Cooling Costs: Water Use in AI Data Centers
Water consumption is another environmental concern for AI because data centers use water for cooling. Keeping servers cool in large facilities often requires water-cooled systems, especially in warmer climates.
Global AI-related water withdrawal has been rising. Estimates suggest that AI data centers might use 4.2–6.6 billion cubic meters per year by 2027, which is equivalent to 4.2–6.6 billion tonnes of water. This amount is similar to the yearly water use of medium-sized countries.
At the individual query level, water use is very small. For example, OpenAI’s CEO has stated that a single ChatGPT query uses about 0.000085 gallons of water (or ~0.32 ml)—a tiny amount comparable to a few drops. But at scale, with billions of queries each day, total water demand becomes significant in the context of data center cooling systems.
Google’s data reveals that a typical Gemini text prompt uses about 0.26 milliliters of water. That’s about the same as a few drops, considering data center operations.
The Bigger Picture: AI’s Environmental Footprint
AI’s environmental footprint extends beyond individual models and queries. Data centers are expanding rapidly because of increased AI adoption and other online services. Data center electricity use might reach almost 3% of global demand by 2030. This growth highlights the importance of sustainable practices in the tech industry.
While per-query energy and carbon figures can seem small, the aggregate impact of billions of daily AI interactions adds up. Power use and cooling needs can stress local energy grids and water supplies. This happens if companies don’t use renewable sources and efficient technologies.
Major tech companies have made public commitments to use renewable energy and improve energy efficiency at data centers. Experts say that real transparency in environmental impacts needs better reporting. It also requires standardized metrics throughout the AI industry.
So, Who Wins the AI Race?
In the AI chatbot market, ChatGPT continues to lead with about 68% market share in 2026, while Google’s Gemini holds approximately 18.2% and is growing fast. Their competition reflects differences in strategy, reach, and integration into broader technology ecosystems.
On environmental performance, both AI systems contribute to energy use, carbon emissions, and water consumption through data centers. Per-query measurements such as 0.24–0.30 Wh of electricity and tiny amounts of water per request show that individual impacts are small.
However, the aggregate resource use of running AI at scale is significant and growing. Global demand for electricity in data centers is expected to rise sharply by 2030. Water use might also increase as AI adoption expands.
Understanding these footprints and market dynamics helps users, developers, and policymakers see the costs and benefits of AI. AI tools like ChatGPT and Gemini will keep changing tech markets. They will also influence talks about sustainability in our digital world.
- MUST READ: AI Drives a Transformative Wave in Global Data Centers – and Energy Is the Real Bottleneck
The post ChatGPT vs. Gemini: Who Leads the AI Race and at What Environmental Cost? appeared first on Carbon Credits.
Key takeaways
- SBTi is the default reference point for corporate climate action: 51% of Fortune Global 500 companies now hold net-zero targets, up from 8% in 2020, and over 11,000 organizations worldwide have SBTi-validated targets.
- Net Zero Standard V2 redefines climate leadership as reducing emissions and mitigating ongoing emissions, not reduction alone.
- The new standard adds flexibility through five-year cycles, a “best efforts” standard, and an Asset Transition Method for companies whose path to net-zero doesn’t fit a straight-line trajectory.
- Voluntary carbon credits are formally recognized for the first time, with reduction and removal credits accepted from 2027, and removals required from 2035.
- Companies with 2030 targets keep using V1 for their current cycle and move to V2 in 2028; companies without targets can start using V2 on February 1, 2027.
Why every business needs to understand the SBTi Net-Zero Standard revision
The Science Based Targets initiative (SBTi) has become the default reference point for credible corporate climate action. Net-zero targets are now held by 51% of Fortune Global 500 (FG500) companies, up dramatically from just 8% in 2020, and more than 11,000 organizations worldwide have set SBTi-validated targets.
However, SBTi’s influence extends well beyond the companies formally participating in the program. Every business in the value chain of an SBTi participant will have to reduce its own carbon emissions, and businesses that aren’t SBTi participants themselves still look to the program for guidance on climate action.
In short, SBTi gives every business a credible blueprint for climate action, and companies that follow its principles can pursue climate action with confidence, whether or not they’re formally part of the program.
How will the Net Zero Standard revision affect business climate action?
SBTi participation is expected to grow. Despite strong target-setting participation among the F500, only 17% of companies use the SBTi Net Zero Standard V1 beyond target setting, largely because its rules have been seen as too rigid to apply in practice. Much of the Net Zero Standard revision has focused on creating more flexibility to enable higher participation. Medium and small businesses will also increasingly feel pressure for climate action, since SBTi mandates that its participants reduce carbon emissions across their value chains.
Net Zero Standard V2 also redefines climate leadership: leading climate action now means reducing emissions and mitigating ongoing emissions. Reducing your own emissions while ignoring the emissions you continue to release along the way is no longer considered leadership. Supporting voluntary carbon projects with high-integrity carbon credits is now backed by the leading authority on corporate climate action.
What lessons shaped the Net Zero Standard V2 revision?
The revision reflects a few learnings about what actually drives climate progress, and how SBTi built those lessons into the new standard.
| Net Zero Standard V1 Learnings | Net Zero Standard V2 Implementation |
|---|---|
| Making real short-term progress is more important and more difficult than making big long-term promises | Focus on short-term climate progress |
| Every company has a different path to net zero that doesn’t always fit generalized net-zero rules | Create asset transition plans based on each company’s unique asset lifecycles and capital planning |
| We need to mitigate our ongoing emissions to keep global carbon emissions in check | Reduce global carbon emissions by financing voluntary carbon projects with high-integrity carbon credits |
What are the key changes between the old and new Net Zero Standard?
Both versions of the standard are grounded in net-zero by 2050. However, the old standard treated climate leadership as simply reducing emissions, expected a long-term commitment to net zero, based emission reduction targets on generalized net-zero goals, revoked status from companies that fell behind on targets, and ignored voluntary carbon projects entirely.
The new standard treats climate leadership as reducing emissions and mitigating ongoing emissions. It shifts the focus to short-term progress through five-year cycles, and it bases emission reduction targets on both the net-zero goal and a company’s own asset decarbonization plan. A new Asset Transition Method lets companies set decarbonization targets through asset plans with committed, verifiable steps; an ambitious but achievable path based on a company’s starting point, financial resources, and technology, with multiple pathways to reflect the unique opportunities and constraints of different industries and companies.
Crucially, the new standard moves to a “best efforts” basis that creates real flexibility on progress against targets. Businesses that miss their targets can keep their status if they’ve used “every lever” within their control, and minimum progress rules will be set out in the SBTi Assurance Manual.
Finally, the new standard formally uses voluntary carbon projects to mitigate ongoing emissions. From 2027 through 2034, this mitigation is recognized, and both carbon reduction and removal credits are accepted. From 2035 forward, mitigation with carbon removal credits becomes required, with durability matching between the removal and the emission it offsets.
| Old Net Zero Standard | New Net Zero Standard |
|---|---|
| Grounded in net-zero by 2050 | Grounded in net-zero by 2050 |
| Climate leadership is reducing emissions | Climate leadership is reducing emissions and mitigating ongoing emissions |
| Make a long-term commitment to net-zero | Focus on short-term progress in 5-year cycles |
| Emission reduction targets are based on net-zero goal |
|
| Businesses who fall behind targets lose status |
|
| Ignores voluntary carbon projects |
|
When does the new Net Zero Standard take effect?
Companies with existing 2030 targets should continue using the old Net Zero Standard for their current cycle, and start using the new Net Zero Standard in 2028 to set targets for the next cycle (2030–2035).
Companies that don’t yet have targets can use the new Net Zero Standard starting February 1, 2027.
What are SBTi’s Category A and Category B companies?
The new Net Zero Standard splits companies into two categories, with different requirements attached to each.
Category A covers large companies from all countries and medium-sized companies from high-income countries. A company from any country qualifies if it meets at least one of: net turnover of €450 million or more, or 1,000 or more full-time employees. A company from a high-income country qualifies if its Scope 1 and 2 emissions are 10,000 tCO2e or more, or if it meets at least two of: balance sheet of €25 million or more, net turnover of €50 million or more, or 250 or more full-time employees.
Category B covers small companies from all countries and medium-sized companies from lower-income countries.
How do Scope 1 targets work under Net Zero Standard V2?
Scope 1 targets aim to transition companies to net-zero direct emissions by 2050 or sooner, and companies can choose from three approaches.
- Absolute emissions reduction follows a straight-line emissions trajectory from the target base year to the net-zero year.
- Emissions intensity reduction lets companies follow sector-specific pathways designed to reflect the reduction opportunities available in sectors like steel, cement, or chemicals.
- Asset transition is designed for companies whose capital stock turnover doesn’t follow a linear or sector pathway. These companies design a transition plan to operate existing assets efficiently and replace them with low-carbon assets, using predetermined milestones.
How do Scope 2 targets work under Net Zero Standard V2?
Scope 2 targets address emissions from purchased electricity through three pathways:
- Reducing electricity consumption,
- Reducing grid consumption by installing onsite or direct-line offsite clean energy generation, and
- Cleaning up the regional grid using market-based tools like PPAs, RECs, and GOs that drive clean energy development.
V2 introduces a dual Scope 2 framework requiring two separate targets, with an overall goal of 100% low-carbon electricity by 2040.
The location-based target addresses the carbon intensity of a company’s physical power use, and requires companies to show that their grid consumption is falling and/or that their physical grid use is getting cleaner; in other words, that their market-based solutions are actually making the grid cleaner.
The market-based (or zero-carbon electricity) target tracks a company’s use of low-carbon power generation contracts and Energy Attribute Certificates. It requires geographical matching of these certificates with electricity consumption based on deliverability regions (grid regions); annual matching is allowed, though hourly matching is encouraged. Category A companies with large electricity loads must report the percentage of their Scope 2 electricity consumption matched with low-carbon attributes on an hourly basis, and there’s an optional recognition framework for companies that meet hourly matching thresholds.
How do Scope 3 targets work under Net Zero Standard V2?
Scope 3 targets share the same 2050-or-sooner net-zero goal, but companies set near-term targets only for material emissions sources in their value chain and areas where they have real influence. Long-term Scope 3 targets are generally not required.
Limited, justified exclusions are allowed for near-term targets, including categories that individually account for less than 5% of total Scope 3 emissions, and activities where a company lacks practical influence, like leased assets it doesn’t operationally control, or the processing of sold products. Optional exclusions are also available in specific categories.
Companies can choose from three approaches to near-term Scope 3 targets:
- An overarching emissions reduction target, which follows a linear contraction of emissions from the base year to residual emissions of 10% or less by 2050 or sooner;
- An overarching supplier/customer alignment target, benchmarked against a growing share of tier 1 suppliers and customers reaching net-zero by 2050 or sooner; or
- A category- or activity-specific target, tailored for companies with concentrated emissions in particular Scope 3 categories or high-emitting activities.
What is “ongoing emissions mitigation” under the new SBTi standard?
This is one of the most significant additions in Net Zero Standard V2. Accelerated climate contributions are needed to help the world achieve climate objectives, limit temperature overshoot, mitigate transition risks, and support the scale-up of climate solutions, and V2 formally recognizes that. Ongoing emissions mitigation runs as a parallel track to companies also reducing their own emissions.
The framework is initially voluntary, with recognition available at three contribution levels to encourage early action.
- Engaged companies address more than 1% of total Scope 1, 2, and 3 emissions.
- Advanced companies address more than 10% of total Scope 1, 2, and 3 emissions, including 100% of Scope 1 and 2 emissions.
- Leadership companies address 100% of total Scope 1, 2, and 3 emissions with a contribution budget of $80/tCO2e.
Carbon credits used for this purpose have to meet certain quality standards. They must be ex-post (issued after the mitigation has actually occurred), independently third-party-assured, emissions reductions or removals, measured in tCO2e, that occur within five years prior to the reporting year. They must be sourced from outside the company’s own value chain. Further minimum criteria will be set to align with high-integrity frameworks, with additional details on the recognition program expected in the second half of 2026.
Starting in 2035, carbon removals become mandatory for Category A companies. From that point, the carbon removal coverage requirement rises linearly from 1% of Scope 1–3 emissions to 100% by a company’s net-zero year. Within that, 10% of long-lived GHG emissions must specifically be covered by durable removals, also rising linearly to 100% by the net-zero year.
How must companies neutralize residual emissions?
At a company’s net-zero target year and thereafter, it must reduce its Scope 1, 2, and 3 emissions to zero or to residual levels, and neutralize all residual emissions using eligible carbon removals. Those removals have to meet two conditions: they must occur within the same reporting period as the residual emissions they’re neutralizing, and long-lived GHGs must be neutralized with long-lived removals, matching the durability of the removal to the atmospheric lifetime of the emission being addressed.
What is the SBTi implementation hierarchy?
Net Zero Standard V2 also lays out how companies should prioritize their actions for credible target delivery, in three tiers.
- Direct actions, at the activity level, are actions that reduce emissions at the source within a company’s own operations and value chain; things like efficiency improvements, fuel switching, and engaging suppliers and customers to reduce their emissions.
- Actions within shared systems, or activity pools that reduce the emissions of shared systems like electricity or gas grids. This includes market instruments that convey low-carbon attributes, such as PPAs, RECs, and GOs, all of which must meet minimum integrity criteria that SBTi will elaborate on in future guidance.
- Sector-level actions relate to the same type of activity occurring in a relevant geography or system, in a way that meaningfully reduces the emissions a company is responsible for.
How Terrapass helps businesses meet the new SBTi standard
As the rules around carbon credits become more rigorous, the quality of the credits behind them matters more than ever. Terrapass has expanded our global network of carbon projects: more project types, locations, prices, ICVCM CCPs, and UN SDGs, spanning super-pollutant destruction, nature-based solutions, and durable removals. We offer Green-e® Climate Certification and we only source from third-party-verified projects on ICVCM-Eligible registries.
We also help clients with impact beyond carbon: EACs, RECs, and GOs including Green-e® Certified credits that support leading renewable energy projects; water credits that support water restoration projects; and custom environmental product needs like RNG and SAF. Wherever your organization is on its sustainability journey, we help clients around the world address climate risk, advance their environmental and social goals, and get the most out of their sustainability budgets.
FAQ: SBTi Net-Zero Standard revision
What is the SBTi Net-Zero Standard?
It’s the framework the Science Based Targets initiative publishes for companies that want validated, credible net-zero targets tied to limiting global warming.
What is changing in the SBTi Net Zero Standard V2 revision?
The biggest changes are more flexibility (five-year cycles and a “best efforts” standard), a new Asset Transition Method for companies whose emissions don’t follow a straight-line path, and formal recognition of voluntary carbon credits for mitigating ongoing emissions.
When do companies need to switch to the new SBTi standard?
If your company already has 2030 targets, you keep using V1 for your current cycle and move to V2 in 2028. If you don’t have targets yet, you can start using V2 as of February 1, 2027.
Can companies use carbon credits to meet SBTi targets?
They can. Under V2, high-integrity carbon reduction and removal credits count toward mitigating ongoing emissions from 2027 through 2034. Starting in 2035, only removal credits count, and they need to be durability-matched to the emissions they offset.
What’s the difference between Category A and Category B companies under SBTi?
Category A is large companies everywhere plus medium-sized companies in high-income countries, based on thresholds like revenue, headcount, or emissions. Category B is small companies everywhere and medium-sized companies in lower-income countries.
What happens if a company misses its SBTi target?
Under the old standard, falling behind could cost a company its SBTi status. Under V2’s “best efforts” approach, a company can hold onto its status as long as it’s used every lever within its control, with minimum progress rules coming in the SBTi Assurance Manual.
Sources: This post is based on Terrapass’s internal analysis of the SBTi Corporate Net-Zero Standard V2.0. Facts and figures were checked against SBTi’s official V2.0 announcement, SBTi’s Corporate Net-Zero Standard V2.0 — Chapter 6: Ongoing Emissions Responsibility, Trellis’s coverage of the standard, Trellis’s reporting on Ongoing Emissions Recognition costs, Sylvera’s analysis of what comes next, Anthesis Group’s Fortune 500 net-zero commitments research, and Climate Impact Partners’ seventh annual FG500 analysis, as reported by CarbonUnits.com.
The post SBTi Net-Zero Standard V2: What the Revision Means for Every Business appeared first on Terrapass.
For most businesses, the emissions that matter most sit outside their own walls. Scope 3 emissions, everything generated across your value chain, from the suppliers who make your inputs to the customers who use your products, typically make up the majority of a company’s total carbon footprint. Under the Corporate Sustainability Reporting Directive (CSRD), those value-chain emissions now have to be measured and disclosed with a rigour that spend-based estimates alone struggle to satisfy. This guide sets out how to improve Scope 3 data accuracy for CSRD: the calculation methods open to you, how to move from estimates to verified supplier data, and how to govern that data so it holds up to audit.
![]()
A carbon credit is a commitment that extends well into the future. The tonne of CO₂ compensated for today from a nature-based carbon project must remain out of the atmosphere for good, which means the forest behind the credit has to remain standing long after the transaction is complete. For any buyer, this raises a defining question: What ensures that the forest endures?
![]()


-
Greenhouse Gases12 months ago
Guest post: Why China is still building new coal – and when it might stop
-
Climate Change12 months ago
Guest post: Why China is still building new coal – and when it might stop
-

 Greenhouse Gases2 years ago
嘉宾来稿:满足中国增长的用电需求 光伏加储能“比新建煤电更实惠”
-

 Climate Change2 years ago
嘉宾来稿:满足中国增长的用电需求 光伏加储能“比新建煤电更实惠”
-
Climate Change2 years ago
Bill Discounting Climate Change in Florida’s Energy Policy Awaits DeSantis’ Approval
-

 Renewable Energy9 months ago
Sending Progressive Philanthropist George Soros to Prison?
-

 Carbon Footprint2 years ago
US SEC’s Climate Disclosure Rules Spur Renewed Interest in Carbon Credits
-
Greenhouse Gases1 year ago
嘉宾来稿:探究火山喷发如何影响气候预测