
Brazil’s President Luiz Inácio Lula da Silva has asked his government to draft by February guidelines for a national roadmap to transition away from fossil fuels, an idea he championed during COP30.
In a directive issued on Monday, the Brazilian leader requested the ministries of finance, energy and environment, together with the chief of staff’s office, to come up with a proposal for a roadmap to a “just and planned energy transition” that would lead to the “gradual reduction of the country’s dependence on fossil fuels”.
The order also calls for the creation of financial mechanisms to support a roadmap, including an “Energy Transition Fund” that would be financed with government revenues from oil and gas exploration.
The guidelines, due in 60 days, will be delivered “as a priority” to Brazil’s National Energy Policy Council, which will use them to craft an official fossil fuel transition roadmap.
-
COP30 fails to land deal on fossil fuel transition but triples finance for climate adaptation
Instead of a global agreement to create roadmaps to shift away from fossil fuels and end deforestation, Brazil announces voluntary initiatives -
Trade breaks into agenda of UN climate talks – but will it have teeth?
Governments have agreed to hold a set of dialogues on overlapping climate and trade policies and how they can enable development -
World leaders get behind climate action at first COP in the Amazon
Government heads urged political unity on efforts to tackle climate change while criticising President Trump and others who are undermining that push


At the COP30 climate summit in Brazil, President Lula and Environment Minister Marina Silva called on countries to agree a process leading to an international roadmap for the transition away from fossil fuels, after Silva argued earlier in June that “the worst possible thing would be for us to not plan for this transition”.
Yet, to the disappointment of more than 80 countries, the proposal for a global roadmap did not make it into the final Belém agreement as other nations that are heavily reliant on fossil fuel production resisted the idea. Draft compromise language that would have offered countries support to produce national roadmaps was axed.
Brazil seeks to set an example
Instead, Brazil’s COP30 president said he would work with governments and industry on a voluntary initiative to produce such a roadmap by next year’s UN climate summit, while a group of some 25 countries backed a conference to discuss a just transition away from coal, oil and gas that will be hosted by Colombia and the Netherlands in April 2026.
Experts at Observatório do Clima, a network of 130 Brazilian climate NGOs, welcomed Lula’s subsequent order for a national roadmap and said in a statement it sends signals abroad that Brazil is “doing its homework”.
“President Lula seems to be taking the roadmap proposal seriously,” said Cláudio Angelo, international policy coordinator at Observatório do Clima. “If Brazil – a developing country and the world’s eighth-largest oil producer – demonstrates that it is willing to practice what it preaches, it becomes harder for other countries to allege difficulties.”
The Amazon rainforest emerges as the new global oil frontier
Brazil is one of a number of countries planning a major expansion of oil and gas extraction in the coming decade, according to the Production Gap report put together by think-tanks and NGOs. Much of the exploration is set to take place offshore near the Amazon basin, which is poised to become a new frontier for fossil fuel development.
Significant funding needed
Natalie Unterstell, president of the Brazilian climate nonprofit Talanoa Institute and a member of Lula’s Council for Sustainable Social Economic Development, welcomed the national roadmap proposal in a post on LinkedIn, but emphasised it must tackle Brazil’s goal of becoming the world’s fourth largest oil producer by 2030.
Another key question is whether the Energy Transition Fund it envisages will be large enough to catalyse a real shift over to clean energy, she added. “Small and fragmented tools won’t move the dial,” she wrote.
Some Brazilian states have tested a model similar to the proposal for a national Energy Transition Fund. In the oil-producing state of Espirito Santo, for example, a percentage of the state government’s oil revenues go to a sovereign fund that invests in renewable energy, energy efficiency projects and substitution of fossil fuels with less polluting alternatives.
Colombia seeks to speed up a “just” fossil fuel phase-out with first global conference
Andreas Sieber, associate director for policy at campaign group 350.org, said a meaningful roadmap for Brazil would need to secure “adequate, fair and transparent financing to make the transition real on the ground”.
He also called for “a truly participatory process – involving scientists, civil society, workers whose livelihoods are at stake, and frontline and traditional communities whose rights must be upheld – while ensuring that those with vested fossil fuel interests do not shape the outcome”.
The post Brazil’s Lula requests national roadmap for fossil fuel transition appeared first on Climate Home News.
Brazil’s Lula requests national roadmap for fossil fuel transition
Britain’s new prime minister announced in his first week that he will cut the cost of public transport and electricity, making lower-emission technologies like bus travel, electric vehicles and heat pumps more affordable for voters. But some of the funding for those policies will come from the budget for international climate finance, the government has said, raising concerns about fairness.
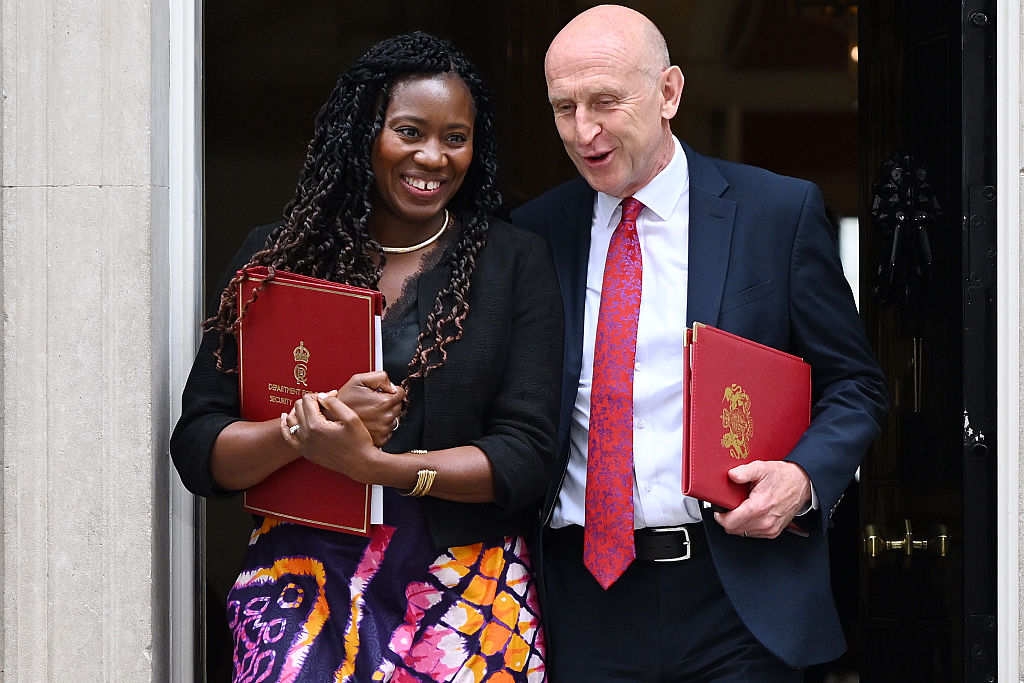
Former Manchester Mayor Andy Burnham took over from Keir Starmer as Labour Party leader and prime minister on Monday, appointing climate advocates Ed Miliband as foreign and development minister and Miatta Fahnbulleh as climate and energy minister.
On Tuesday, Burnham said his government would cut the value added tax (VAT) households and some small businesses pay on their electricity bills from 5% to zero from October 1, saving households £45 ($60) a year.
On Wednesday, he said the maximum fare bus companies in England can charge for a single journey will be reduced from £3 ($4) to £2 ($2.67) from January 1, 2027. The government said the subsidies to achieve this would be mostly funded by switching money set aside for overseas climate finance projects from grants to loans. It did not give further information in its announcement, while the UK’s transport minister told Sky News the plan is still being worked out.
-
Tropical forest protection fund at risk after UK stalls on pledge
The Brazil-led TFFF was launched at COP30 as an innovative financial model to keep rainforests standing, but is still short on startup cash -
UK halves Green Climate Fund contribution, as it spends more on security
After promising £1.6 billion to the UN’s flagship climate fund in 2023, the UK government has now said it will only hand over half as much -
EU, UK lead push for electrification as “powerful weapon” against fossil fuels
A group of dozens of countries seeks to build momentum for a COP31 pledge to electrify 35% of global energy use by 2035 as an alternative to fossil fuels


The floated changes to the climate finance budget were immediately criticised by groups working on climate justice for developing countries, including Bond, the UK network for NGOs, which described the decision as “disappointing”.
“Robbing Peter to pay Paul is not the answer and pitches marginalised communities in the UK against marginalised communities in lower-income and climate-vulnerable countries,” BOND CEO Romilly Greenhill said in a statement. “Climate finance must not worsen the debt burden of countries that are already suffering the worst – and most costly – impacts of a climate crisis they did not cause.”
Hunt for money
Burnham promoted both policies as measures to combat the rising cost of living and “give people breathing space”, with climate campaigners and industry groups noting they are also likely to reduce the UK’s climate-heating emissions by encouraging bus travel and the use of electric vehicles and heating.
But thorny questions remain over how the policies will be paid for. The government said Tuesday’s VAT cut for electricity would be funded by scrapping the previous government’s digital ID programme, but Darren Jones, a former minister involved with that policy, said it had been “unfunded” – a statement that dominated media coverage.
A day later, the government said the new bus fare cap would cost £454 million ($606m). Transport minister Heidi Alexander told Sky News that £54 million would be taken from an under-spend in the budget of the Department for Energy Security and Net Zero (DESNZ) and £400 million would come from changing unspecified international climate finance from grants to loans. The details “still need to be worked through”, she said, adding that the government “had wanted to make an announcement today”.
Mohamed Adow, director of Nairobi-based think-tank Power Shift Africa, said “climate finance was never meant to be a pot of money that governments raid when they need to pay for domestic spending”.
DESNZ had not responded to a request for comment at the time of publication. “We’re not wanting to fleece anyone here, and we actually want to maximise the development potential of this money that is available,” minister Alexander said in her TV interview.

Aside from the controversy over their funding, the policies themselves were widely welcomed by climate campaigners. Jess Ralston, energy lead at the Energy and Climate Intelligence Unit (ECIU), said the tax cut on electricity bills “could help households to switch to electric heat pumps, protecting UK homes from becoming ever more exposed to the whims of Putin and Trump when turning on their gas boiler”.
The last few months have seen global momentum build behind electrification, spurred by the US-Iran war disrupting oil and gas supplies and driving up prices. The Turkish and Australian COP31 presidencies have announced a global target to boost electrification, backed by the European Union, Canada, Philippines, UK and others.
Campaigners call for lower power prices
While reaction to the VAT cut was supportive, some questioned whether £45 a year of savings per household is enough and called for more measures to cut electricity bills.
Friends of the Earth’s energy lead Imogen Dow said those on the lowest incomes should be given cheaper electricity through a “social tariff” and the Institute for Public Policy Research (IPPR) think-tank – which is close to the Labour Party – said levies on energy bills should be shifted to general taxation.
Matthew Paterson, a politics professor at Manchester University, told Climate Home News that the most effective way to reduce electricity bills is to take on the UK’s private electricity companies, while consumer-oriented measures like the VAT cut are “tinkering around the edges”.
Jarrod Birch, head of policy and public affairs for the EV charging industry association Charge UK, said that while the policy would make home-charging cheaper, people who charge their vehicles at public points will still have to pay 20% VAT. The UK’s tax authority is fighting a court ruling that ordered it to reduce the tax motorists pay on public chargers to the current household rate of 5%.
Further measures will be the responsibility of Secretary of State for Energy Security and Net Zero Miatta Fahnbulleh, who is relatively new to politics after a career at left-wing, pro-climate think tanks the IPPR and the New Economics Foundation.
Michael Jacobs, political economy professor at Sheffield University and former adviser to UK Labour prime minister Gordon Brown, said Fahnbulleh would be a “climate advocate” who would continue the “progressive climate agenda” of her predecessor Ed Miliband.
“She’s a very creative policy wonk so I expect there to be lots of policy innovation under her,” he said, “I think she will be looking at new ways to encourage take-up of heat pumps and domestic batteries.”
Aid budget in Miliband’s hands
Despite reports he could be made finance minister, Miliband has been appointed Secretary of State for Foreign and Commonwealth Affairs. Miliband has attended many climate COP meetings over several decades, most recently representing the UK at COP29 and COP30, and has been targeted by the right-wing media for his support for climate action and opposition to new oil and gas drilling in the UK’s part of the North Sea.
In his new role, Miliband will be responsible for the UK’s overseas aid budget including its international climate finance, which the Starmer government had slashed to fund increases in defence spending.
UK cuts support for climate action abroad to fund military instead
Jacobs said he expected Miliband to prioritise climate and development in the UK’s foreign policy and to push Burnham and new finance minister John Healey to reverse Starmer’s aid cuts.
But there are fears Healey could try to cut the aid budget further to fund the military. Healey was a surprise pick for Chancellor of the Exchequer and grabbed headlines when he resigned as Starmer’s defence minister in June over what he saw as insufficient defence spending.
The post Will new UK PM’s green measures at home cause climate finance pain overseas? appeared first on Climate Home News.
Will new UK PM’s green measures at home cause climate finance pain overseas?
AMSTERDAM, Netherlands, 22 July 2026 – Greenpeace Netherlands has launched legal proceedings against a multi-billion-dollar global expansion plan by the biggest meat producer in Australia, JBS, in an escalation of climate litigation against the livestock industry.
Greenpeace petitioned a Dutch court to compel the meat giant to disclose information in order to challenge its business policies in court, including a US$6 billion global expansion, for which almost half is earmarked for Nigeria.
Elizabeth Atieno, Food Campaigner at Greenpeace Africa, said: “JBS’ meat empire expanded hand-in-glove with Amazon destruction, colossal emissions, human rights and corruption scandals, all with barely a semblance of transparency. This is the business model it wants to export to sub-Saharan Africa. JBS promises food security, but its expansion in Nigeria risks causing irreversible environmental damage and the displacement of smallholder farmers to line the pockets of wealthy global elites.
“Nigerians know well from the legacy of companies like Shell the destructive impact wrought by unchecked corporate power. As Greenpeace Africa has argued before the African Court of Human Rights, states with jurisdiction over multinationals must hold those corporate actors accountable – wherever they operate in the world. We welcome this bold legal action: the Netherlands and other European states must not be safe havens for corporations like JBS seeking to evade their responsibilities.”
In light of JBS’ longstanding failure to publish accurate and reliable information on its climate, nature and human rights impacts or its expansion plans, Greenpeace Netherlands views accessing this data as a necessary precursor to formal litigation in order to support its case. The case has the potential to be the first climate litigation of this scale against the livestock industry. This could set a major precedent for future legal challenges against the industrial agriculture sector, a major source of global emissions, particularly of methane, a potent greenhouse gas, responsible for 0.5°C of warming since the Industrial Revolution.[1]
JBS, via its subsidiary JBS Foods Australia, is the largest meat and food processing company in Australia. With a weekly processing capacity of over 50,000 cattle, it accounts for almost a quarter of all beef processing in the country, as well as a significant presence in the lamb, pork and farmed fish markets. [2] In 2022, ABC’s Four Corners accused the company of ‘repeatedly failing to protect its workers from horrific injuries.’ [3]
Marieke Vellekoop, Executive Director at Greenpeace Netherlands, said “In a month where JBS has thrown its flagship environmental commitments onto the scrap heap, JBS’ disdain for basic transparency only adds to the impression that this meat giant has something to hide and is desperate to prevent its expansion plans from going public. We were hoping we wouldn’t have to trouble a judge with this matter, but JBS has left us no choice but to seek our right to information through the Dutch courts.
“JBS appears to believe that despite moving to the Netherlands, our rules do not apply to it. This legal action aims to prove it wrong – and lay the ground for a first major climate and nature lawsuit against the dangerous expansion of the global meat industry.“
At the centre of the dispute is JBS’ planned US$ 2.5 billion investment in industrial livestock production in Nigeria.[2] Civil society groups in Nigeria have raised urgent warnings that the aggressive expansion will threaten local food security, drive regional instability, and accelerate ecological degradation. There is no available evidence that JBS has conducted any impact assessments or community consultations in Nigeria, and local efforts to gather more information via Freedom of Information requests have reportedly been ignored.[3]
The escalation to the courts follows the refusal of JBS, the world’s largest meat company, to comply with a formal disclosure demand delivered by Greenpeace Netherlands in April. The environmental group is utilising new Dutch legislation, which grants parties with a legitimate interest the right to demand access to specific corporate data necessary to build litigation against Dutch companies.[4]
Greenpeace Netherlands’ lawyers allege that JBS’ historic business practices and future expansion plans are inconsistent with the company’s climate and biodiversity obligations and represent a breach of its Dutch duty of care, which requires companies to act in line with international human rights law.[5]
If the court rules in favor of Greenpeace Netherlands, it is entitled to seek the required information in the form of documents and from senior JBS figures under oath, raising the prospect of the Batista brothers being forced to testify in Dutch court. JBS reincorporated as a Dutch entity (JBS N.V.) last year to facilitate a dual listing on the New York Stock Exchange.
In April, JBS was forced to temporarily suspend its first annual general meeting since moving its headquarters to Amsterdam after it was disrupted by dozens of Greenpeace Netherlands activists.
Last week, JBS scrapped two flagship commitments to reach Net Zero emissions by 2040 and eradicate deforestation from its supply chain. It also removed any explicit reference to Indigenous lands from all of its current policies. Greenpeace Netherlands is concerned this indicates JBS is seeking to expand unconstrained by the climate, nature and human rights impacts of its business.
–ENDS–
Notes:
[1] The livestock sector is estimated to be responsible for 31% of global methane emissions (more than oil and gas operations). In comparison to CO2, methane is shorter lived (around 12 years) but has a much stronger ability to trap heat in the atmosphere over its lifetime: it has approximately 80 times more climate impact than CO2 when measured over 20 years. This means that changes in methane emissions have a more rapid effect on the climate than changes in CO2. See Greenpeace Netherlands letter to JBS dated 30 April 2026.
[2] JBS Foods Australia, Our Business
[3] ABC, Australia’s biggest meat company JBS is repeatedly failing to protect its workers from horrific injuries, 25 April 2022
[4] JBS announcement
[5] Experts raise concerns over the risks of industrial animal farming (The Sun Nigeria)
[6] Simplification and modernisation of Dutch evidence law (Fieldfisher)
[7] Greenpeace Netherlands petition to Dutch court available here. Media briefing with further details on JBS expansion plans, including in Nigeria, available here.
Greenpeace launches legal challenge against Australia’s biggest meat company
Climate Change
“Next year is too late for regulations”: Beetaloo Energy’s 2GW gas-powered AI data centre a “disaster proposal” destined to cause climate chaos
SYDNEY, Wednesday 22 July 2026 — Beetaloo Energy has secured land from the NT Government for a massive $40 billion “hyperscale” AI data centre near Darwin, which would be powered by 2 gigawatts (GW) of gas power fracked directly from the Beetaloo basin, prompting calls from Greenpeace for urgent federal legislation.
The proposal marks a dangerous escalation in the AI data centre industry’s expansion, which threatens to entrench fossil fuel infrastructure for decades and put immense pressure on the region’s fragile water resources — while continuing to be unregulated.
Joe Rafalowicz, Head of Climate and Energy at Greenpeace Australia Pacific, said: “This disaster proposal for a 2GW gas-powered AI data centre in the NT is a shocking example of the unchecked expansion of hyperscale data centres in Australia. It is also, critically, more evidence for the urgent need for a moratorium on all new data centres until strong, binding regulations are put in place to protect our communities and climate.
“This proposal mirrors the frenzied, unchecked expansion currently wreaking havoc on communities in the US. We are seeing cowboy data centre operators treat Australia like a playground, steam-rolling ahead with projects that would lock down precious water resources and spike emissions, despite the overwhelming community opposition.
“Every day, more councils, communities and environmental groups are joining Greenpeace’s call for a moratorium on data centres, yet as of today there is still no system of safeguards or rules in place to regulate these companies.
“While Beetaloo Energy and the NT Government prepare to bulldoze ahead with this climate and water disaster, the Prime Minister is asleep at the wheel, promising to legislate a vague set of standards next year.
“Next year is too late, and anything less than mandating data centres cover their own energy demand, and then some, with new renewable energy is not enough.”
-ENDS-
Media contact
Lucy Keller on 0491 135 308 or lucy.keller@greenpeace.org


-
Climate Change11 months ago
Guest post: Why China is still building new coal – and when it might stop
-
Greenhouse Gases11 months ago
Guest post: Why China is still building new coal – and when it might stop
-

 Greenhouse Gases2 years ago
嘉宾来稿:满足中国增长的用电需求 光伏加储能“比新建煤电更实惠”
-

 Climate Change2 years ago
嘉宾来稿:满足中国增长的用电需求 光伏加储能“比新建煤电更实惠”
-
Climate Change2 years ago
Bill Discounting Climate Change in Florida’s Energy Policy Awaits DeSantis’ Approval
-

 Renewable Energy9 months ago
Sending Progressive Philanthropist George Soros to Prison?
-

 Carbon Footprint2 years ago
US SEC’s Climate Disclosure Rules Spur Renewed Interest in Carbon Credits
-
Greenhouse Gases1 year ago
嘉宾来稿:探究火山喷发如何影响气候预测