

The year 2024 was marked by violence and elections, as conflicts escalated around the world and billions of voters went to the polls.
However, climate change still made headlines.
Thousands of peer-reviewed journal articles were published over the course of the year, helping shape online discourse around climate change.
Tracking these mentions was Altmetric, an organisation that scores research papers according to the attention they receive online.
To do this, it tracks how often published peer-reviewed research is mentioned online in news articles, as well as on blogs, Wikipedia and on social media platforms such as Facebook, Reddit, Twitter and – in a new addition for 2024 – Bluesky. (Carbon Brief explained how Altmetric’s scoring system works in this article.)
Carbon Brief has parsed the data to compile its annual list of the 25 most talked-about climate-related papers of the past year.
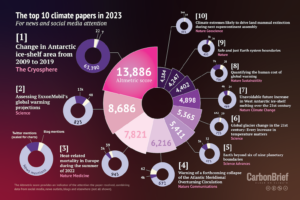
The infographic above highlights the most mentioned climate papers of 2024, while the article analyses the top 25 research papers in greater detail, including the diversity and country affiliation of authors.
Overall, Altmetric’s data reveals the papers which generated the most online buzz in 2024 were – for the fourth year running – associated with Covid-19, with five of the 10 most talked-about papers of the year related to the virus.
However, a number of the most-shared studies were about climate change, from how warming is impacting ocean currents, the economy and timekeeping, through to efforts aimed at mapping historical temperatures using proxy data.
A return from last year’s highs
After a blockbuster year for online mentions of climate science in 2023, last year saw a return to more typical levels.
The most widely shared climate paper of 2024 has a score of 5,414, placing it at the bottom end of the range for top climate papers over the past seven years.
By contrast, the three most talked-about climate papers of 2023 received the highest attention scores recorded across all of Carbon Brief’s annual reviews, which date back to 2015. They clocked scores of 13,886, 8,686 and 7,821.
(For Carbon Brief’s previous Altmetric articles, see the links for 2023, 2022, 2021, 2020, 2019, 2018, 2017, 2016 and 2015.)
The graph below shows how the score given to the top paper in Carbon Brief’s annual review has changed over the past 10 years.

A spokesperson for Altmetric says the falling popularity of climate papers was not due to any adjustments to its methodology, noting that its scoring system “had not changed”. They tell Carbon Brief that online mentions of papers – across all disciplines – have declined in recent years from a peak in 2020, resulting in lower average scores across the board.
The spokesperson said it was unclear why the average number of mentions had fallen since 2020, but hypothesised that several factors could be at play. This includes a surge of policy citations during the Covid-19 pandemic and changes in how people use social media – such as a decline in posts on public Facebook feeds and a spike in Twitter posts in 2021.
The top 10 climate papers of 2024
- Physics-based early warning signal shows that AMOC is on tipping course
- The economic commitment of climate change
- 2023 summer warmth unparalleled over the past 2,000 years
- The growing inadequacy of an open-ended Saffir-Simpson hurricane wind scale in a warming world
- Critical transitions in the Amazon forest system
- Highest ocean heat in four centuries places Great Barrier Reef in danger
- Abrupt reduction in shipping emission as an inadvertent geoengineering termination shock produces substantial radiative warming
- A global timekeeping problem postponed by global warming
- Accelerating glacier volume loss on Juneau Icefield driven by hypsometry and melt-accelerating feedbacks
- A 485-million-year history of Earth’s surface temperature
Later in this article, Carbon Brief looks at the rest of the top 25, and provides analysis of the most featured journals, as well as the gender diversity and country of origin of authors.
AMOC alarm
The most talked-about climate paper of 2024 is a Science Advances study that finds the Atlantic Meridional Overturning Circulation (AMOC) – a system of ocean currents that brings warm water up to Europe from the tropics and beyond – is “on route to tipping”.
The research, titled “Physics-based early warning signal shows that AMOC is on tipping course”, marks the first time that an AMOC tipping event has been identified in a cutting-edge climate model, in this case the Community Earth System Model.
The study’s Altmetric score of 5,414 shoots it to the top of Carbon Brief’s leaderboard and 1,272 points ahead of the second-placed paper.
However, as illustrated in the graph above, the research is the lowest-scoring climate paper to reach the top of the leaderboard since 2017.

The researchers from the Institute for Marine and Atmospheric Research Utrecht describe the paper’s finding as “bad news for the climate system and humanity”. They explain:
“Up until now one could think that AMOC tipping was only a theoretical concept and tipping would disappear as soon as the full climate system, with all its additional feedbacks, was considered.”
The study paints a grisly picture of the consequences of a collapse of AMOC. This includes a 10-30C drop in winter temperatures in northern Europe within a century, and a “drastic change” in rainfall patterns in the Amazon. The paper states:
“These – and many more – impacts of an AMOC collapse have been known for a long time, but thus far have not been shown in a climate model of such high quality.”
Papers exploring the stability of AMOC have dominated Carbon Brief’s climate science leaderboard in recent years, coming in fourth and second place, respectively, in 2023 and 2021.
Media coverage has been amplified by disagreement over what metrics to use to measure the strength of AMOC. Previous studies have used sea surface temperature to make projections about when the tipping point may occur.
The Science Advances paper reaches its conclusions using a new, “physics-based” early warning signal for the breakdown of the vital ocean currents based on the salinity of water in the southern Atlantic.
Overall, the study racked up 601 news mentions, with the Times, Guardian, Daily Telegraph, Associated Press and CNN all reporting on its findings. It was also featured in 39 blogs, the highest of any paper in the top 25, and was shared more than 3,866 times on Twitter.
Study author Dr René van Westen tells Carbon Brief he believes the paper owes its popularity to its alarming conclusion that AMOC is approaching a tipping point, as well as the detail it offers around the “large-scale changes” and “substantial” climate impacts such an event could trigger. He explains:
“The urgency of the situation, suggesting that we are heading toward this collapse, underscores the need for immediate action to prevent such a scenario. We believe that the combination of these far-reaching climate impacts and the risk of AMOC collapse contributed to the extensive media coverage of our study.”
Economic commitment
The second highest-scoring climate paper of 2024, published in the journal Nature, is “The economic commitment of climate change”. The study has an Altmetric score of 4,142 and clocks in at second in the 2024 rankings.

The three-person authorship team, from Germany’s Potsdam Institute for Climate Impact Research, used 40 years of data on damages from temperature and rainfall from more than 1,600 regions around the world to assess how damages could increase under a warming climate.
They estimate that the world economy is committed to an income reduction of 19% within the next 26 years, regardless of how rapidly humanity now cuts emissions. These damages are six times higher than the mitigation costs required to limit global warming to 2C in the near term, the authors say.
They also warn that climate change is likely to exacerbate existing inequalities, adding:
“The largest losses are committed at lower latitudes in regions with lower cumulative historical emissions and lower present-day income.”
The study was mentioned 55 times on Bluesky. It has also been cited by Wikipedia seven times, including in pages on climate justice and climate change mitigation.
The study’s lead author, Dr Maximilian Kotz, tells Carbon Brief:
“We think we made a helpful contribution by pushing the limits of the spatial scales, climate information and assumptions around long-term persistence which are used in these kinds of studies.”
However, he said the media coverage mainly focused on the final numbers, speculating that “part of the wide interest in the media was likely that these numbers were large”. He told Carbon Brief that, in his experience, it is “normal for the media not to pay much attention to the kind of details a researcher finds important”.
Kotz added that since his study came out, a number of other papers have been published using different approaches, but arriving at similar final numbers.
Record hot summer
Coming in third place is a Nature paper which uses temperatures reconstructed from tree rings to conclude the northern hemisphere summer of 2023 was the hottest in two millennia.
To build a picture of summer temperatures stretching back to AD1, the researchers turn to nine of the longest temperature-sensitive tree ring chronologies in North America and Europe, as well as observational data for 1901-2010.

Rest of the top 10
In fourth place, with an Altmetric score of 3,907, is a paper that assesses whether the classification system for tropical cyclone wind speed needs to be expanded to reflect storms’ growing intensity in a warming world. It was published in Proceedings of the National Academy of Sciences.
The research, “The growing inadequacy of an open-ended Saffir-Simpson hurricane-wind scale in a warming world”, says climate change has led to more intense storms, which could justify a new category on the Saffir-Simpson scale.
Introduced in the 1970s, the scale is used to communicate the risk tropical cyclone winds present to property. Events are ranked from category 1, for storms with winds of 74-95 miles per hour (mph), to category 5 for storms with a wind-speed of 157mph and above.
The study highlights how five tropical cyclones of the last nine years were so intense they could sit in a hypothetical sixth category, which could cover storms with winds of 192mph and above.
The study received more news coverage than any other in this year’s top 25, amassing 720 mentions.
In fifth and sixth place, with scores of 3,757 and 3,248, respectively, are a pair of Nature papers.
The first, “Critical transitions in the Amazon forest system”, finds that by 2050, 10-47% of the Amazon forest will be exposed to “compounding disturbances” that may trigger a tipping point, causing a shift from lush rainforest to dry savannah. Carbon Brief covered the study.
The second is a paper looking at how rising ocean temperatures are endangering the Great Barrier Reef. It cautions that without “urgent intervention” the world’s largest coral reef system is at risk of experiencing “temperatures conducive to near-annual coral bleaching” with negative consequences for biodiversity and ecosystem services.
The seventh-placed paper finds a reduction in sulphur emissions from ships – driven by cleaner fuel regulations introduced in 2020 – has led to “substantial radiative warming” that could lead to a “doubling (or more)” of the rate of warming this decade. (Carbon Brief published its own analysis of how low-sulphur shipping rules are affecting global warming in 2023.)
The Communications Earth & Environment study goes on to suggest that marine cloud brightening – a geoengineering technique where marine low clouds are “seeded” with aerosols – may be a “viable” climate solution.
Coming in eighth is a paper which finds that ice melt in Greenland and Antarctica is delaying an observed acceleration of Earth’s rotation, with consequences for global timekeeping.
The Nature paper, “A global timekeeping problem postponed by global warming”, finds the redistribution of mass on Earth as polar ice melts means timekeepers will have to remove a second from global clocks around 2029. If it were not for the acceleration in polar ice melt, this second would have been due for removal by 2026, it says.
Timekeepers are no strangers to tweaking time to adjust for the Earth’s rotation; 27 leap seconds have been added to Coordinated Universal Time (UTC) since the 1970s. However, the paper cautions the first-ever removal of a second is set to pose “an unprecedented problem” for computer network timing.
(Similarly, in 25th place is a Proceedings of the National Academy of Science paper that finds melting ice sheets and glaciers are redistributing the planet’s mass, causing days to become longer by milliseconds.)
In ninth place is a Nature Communications paper which finds that rates of glacier area shrinkage on the Juneau ice field, which straddles Alaska and British Columbia, were five times faster over 2015-19 relative to 1948-79.
Rounding out the top 10 is a Science study that uses proxy data to conclude that the Earth’s average surface temperature has varied between 11C and 36C over the past 485m years.
Retracted papers go viral
One of the most shared papers of the year looks into a CO2 “saturation hypothesis” – a popular topic among climate sceptics. The theory contends the atmosphere has reached a CO2 saturation point, which means that additional emissions of the gas will cause little or no further warming.
The paper argues “continued and improved experimental work” is needed to ascertain whether “additionally emitted carbon dioxide into the atmosphere is indeed a greenhouse gas”.
The research, entitled “Climatic consequences of the process of saturation of radiation absorption in gases”, was published by Applications in Engineering Science in March, but subsequently retracted by the editor.
In a retraction notice, Applications in Engineering Science said the rigour and quality of the peer-review process for the paper had been “investigated and confirmed to fall beneath the high standards expected”.
While the paper received just four news mentions, it was widely shared on Twitter, clocking more than 6,000 posts. With a score of 2,661, it would have been the ninth most talked-about climate paper of 2024 had it not been retracted.
UK political commentator and climate sceptic Toby Young, who was recently promoted to the UK House of Lords, shared an article promoting saturation theory in late December that references the research. As of 9 January, his Twitter post had been shared 6,500 times and viewed 128,300 times.
Controversial Covid-19 treatment and vaccination research also received significant attention in 2024, with four of the most talked-about papers of the year – of any topic – retracted by journal editors.
The studies in question – three of which relate to vaccines and one to hydroxychloroquine – would have placed first, third, fourth and sixth in Altmetric’s overall rankings, had they not been withdrawn.
A controversial paper that did make it into the top 25 without being retracted was a study in the journal Geomatics. It argues that a decrease in planetary albedo and variations in “total solar irradiance” explain “100% of the global warming trend” over 2000-23 and 83% of interannual variability in global temperatures.
The authors have previously proposed a theory that global warming is caused by atmospheric pressure – and were caught publishing their papers under pseudonyms, which were their own names spelled backwards.
With only four news mentions, most of the attention from this article came from other sources. A tweet from the study’s lead author prompted a heated discussion and generated thousands of likes and retweets. Overall, the research was mentioned on Twitter 9,599 times.
The study, which came 13th in the overall rankings with a score of 2,096, was also mentioned on 14 blogs, including a number of climate-sceptic websites.
Elsewhere in the top 25
The rest of the top 25 contains a varied mix of papers that were typically well-received by the scientific community, including research on oil and gas system emissions (15th), mortality due to tropical cyclones in the US (16th) and the latest “state of wildfires” update (22nd).
Paper number 12 finds that a “record-low planetary albedo”, mainly caused by low cloud cover in the northern mid-latitudes and tropics, may have been an important driver of the record-high global temperatures in 2023.
Published on 5 December in the journal Science, it is a relatively late entry into the annual rankings. Despite its late publication date, the study tops the charts for Bluesky mentions, gaining 376 mentions in less than one month.
A Communications Earth & Environment study, called “A recent surge in global warming is not detectable yet”, sits at number 21, with an Altmetric score of 2,018. The study uses statistical methods to search for a recent acceleration in global warming, and concludes that it is not possible to detect one.
The lead author of the study told Carbon Brief that the findings do not rule out that an acceleration might be occurring. She said that “the point of the paper is that it will take additional years of observations to detect a sustained acceleration”. However, some scientists questioned the utility of the methods used in the study, arguing there is evidence of an acceleration in warming.
At number 23 is a study in the journal Science which evaluates 1,500 climate policies that have been implemented over the past 25 years. The lead author of the study told Carbon Brief that taxes are “the only policy instrument that has been found to cause large emission reductions on their own”. The study received 30 mentions in blogs and more than 200 news mentions.
Some studies receive a lot of attention because they provoke discussion or a significant backlash, which drives up news stories and discussion on social media.
For example, the paper ranking at number 14 is a Nature Climate Change study claiming that the planet has already exceeded the 1.5C warming threshold set under the Paris Agreement.
The authors use proxy data from sea sponges in the Caribbean Sea to create a record of ocean temperatures from AD700 to the present day. They find that warming started 40 years before the IPCC’s pre-industrial baseline period began, and argue that this means “warming is 0.5C higher than [Intergovernmental Panel on Climate Change] estimates”.
However, many experts were critical, warning Carbon Brief that the framing of the study is misleading, and arguing that the finding has no bearing on the Paris Agreement 1.5C limit. One expert, who was also not involved in the study, said that “the way these findings have been communicated is flawed, and has the potential to add unnecessary confusion to public debate on climate change”.
The study received 262 news mentions, with some outlets – including the Guardian and New Scientist – highlighting the disagreements over the study’s framing.
All the final scores for the top 25 climate papers of 2024 can be found in this spreadsheet.
Top journals
Across the top 25 papers in Carbon Brief’s leaderboard this year, Nature features most frequently with seven papers. Nature is perennially high-placed in this analysis, taking first or joint first spot in Carbon Brief’s top 25 six times – 2021, 2020, 2019, 2018, 2017 and 2015.
In joint-second place this year are Science, Proceedings of the National Academy of Sciences and Communications Earth & Environment with three papers each.
Earth System Science Data has two papers, and there are seven journals that each have one paper.

Diversity of the top 25
The top 25 climate papers of 2024 cover a wide range of topics and scope. However, analysis of their authors reveals an all-too-familiar lack of diversity. Carbon Brief recorded the gender and country of affiliation for each of these authors. (The methodology used was developed by Carbon Brief for analysis presented in a special 2021 series on climate justice.)
In total, the top 25 climate papers of 2024 have 275 authors. This is fewer than in the past two years, partly due to the absence of the Lancet Countdown report, which typically has more than 100 authors.
The analysis reveals that the authors of the climate papers most featured in the media in 2024 are predominantly men from the global north.
The chart below shows the institutional affiliations of all authors in this analysis, broken down by continent – Europe, North America, Oceania, Asia, South America and Africa.

The analysis shows that 85% of authors are affiliated with institutions from the global north – defined as North America, Europe and Oceania. Meanwhile, only two authors are from Africa.
Further data analysis shows that there are also inequalities within continents. The map below shows the percentage of authors from each country in the analysis, where dark blue indicates a higher percentage. Countries that are not represented by any authors in the analysis are shown in grey.

The top-ranking countries on this map are the US and the UK, with 26% and 18% of the total authors, respectively. Germany ranks third on the list with 15% of the authors.
Meanwhile, only one-third of authors from the top 25 climate papers of 2024 are women. And only five of the 25 papers have a woman as a lead author.
The plot below shows the number of authors from each continent who are men (purple) and women (yellow).

The full spreadsheet showing the results of this data analysis can be found here. For more on the biases in climate publishing, see Carbon Brief’s article on the lack of diversity in climate-science research.


The post Analysis: The climate papers most featured in the media in 2024 appeared first on Carbon Brief.
Analysis: The climate papers most featured in the media in 2024

An Lambrechts is a biodiversity politics expert at Greenpeace International with extensive experience in biodiversity-related multilateral negotiations. She is the head of the Greenpeace delegation at the Convention on Biological Diversity (CBD) COP17 happening in Yerevan, Armenia.
In 2022, COP15 delivered the landmark Kunming-Montreal Global Biodiversity Framework to halt and reverse biodiversity loss by 2030. With COP17 starting in Yerevan, we are now halfway to the deadline, and according to the first Global Review of progress, countries are not on track to meet the biodiversity targets, and implementation must accelerate fast.
One of the main findings of the Global Review is that funding falls far short of the scale needed to halt and reverse nature loss. But the crisis facing the world’s biodiversity is not an absolute scarcity of capital – it is a profound public policy distortion.
The global economy currently spends roughly $30 destroying nature for every single dollar invested in its protection. According to a report from the Intergovernmental Science-Policy Platform on Biodiversity and Ecosystem Services, a staggering $2.4 trillion is spent in public subsidies for fossil fuels, agriculture and water use, while global investment in biodiversity conservation and restoration stands at a mere $220 billion.
Countries urged to ramp up “insufficient” nature policies at COP17
Yet, discussions about how to close the biodiversity finance gap continue to claim that salvation lies in mobilising private capital, scaling offsets and “derisking” investments in nature. This is a fundamental misunderstanding of both the nature of ecological stewardship and of the global financial architecture.
Biodiversity conservation is not a speculative investment portfolio – it