
India’s carbon dioxide (CO2) emissions from its power sector fell by 1% year-on-year in the first half of 2025 and by 0.2% over the past 12 months, only the second drop in almost half a century.
As a result, India’s CO2 emissions from fossil fuels and cement grew at their slowest rate in the first half of the year since 2001 – excluding Covid – according to new analysis for Carbon Brief.
The analysis is the first of a regular new series covering India’s CO2 emissions, based on monthly data for fuel use, industrial production and power output, compiled from numerous official sources.
(See the regular series on China’s CO2 emissions, which began in 2019.)
Other key findings on India for the first six months of 2025 include:
- The growth in clean-energy capacity reached a record 25.1 gigawatts (GW), up 69% year-on-year from what had, itself, been a record figure.
- This new clean-energy capacity is expected to generate nearly 50 terawatt hours (TWh) of electricity per year, nearly sufficient to meet the average increase in demand overall.
- Slower economic expansion meant there was zero growth in demand for oil products, a marked fall from annual rates of 6% in 2023 and 4% in 2024.
- Government infrastructure spending helped accelerate CO2 emissions growth from steel and cement production, by 7% and 10%, respectively.
The analysis also shows that emissions from India’s power sector could peak before 2030, if clean-energy capacity and electricity demand grow as expected.
The future of CO2 emissions in India is a key indicator for the world, with the country – the world’s most populous – having contributed nearly two-fifths of the rise in global energy-sector emissions growth since 2019.
India’s surging emissions slow down
In 2024, India was responsible for 8% of global energy-sector CO2 emissions, despite being home to 18% of the world’s population, as its per-capita output is far below the world average.
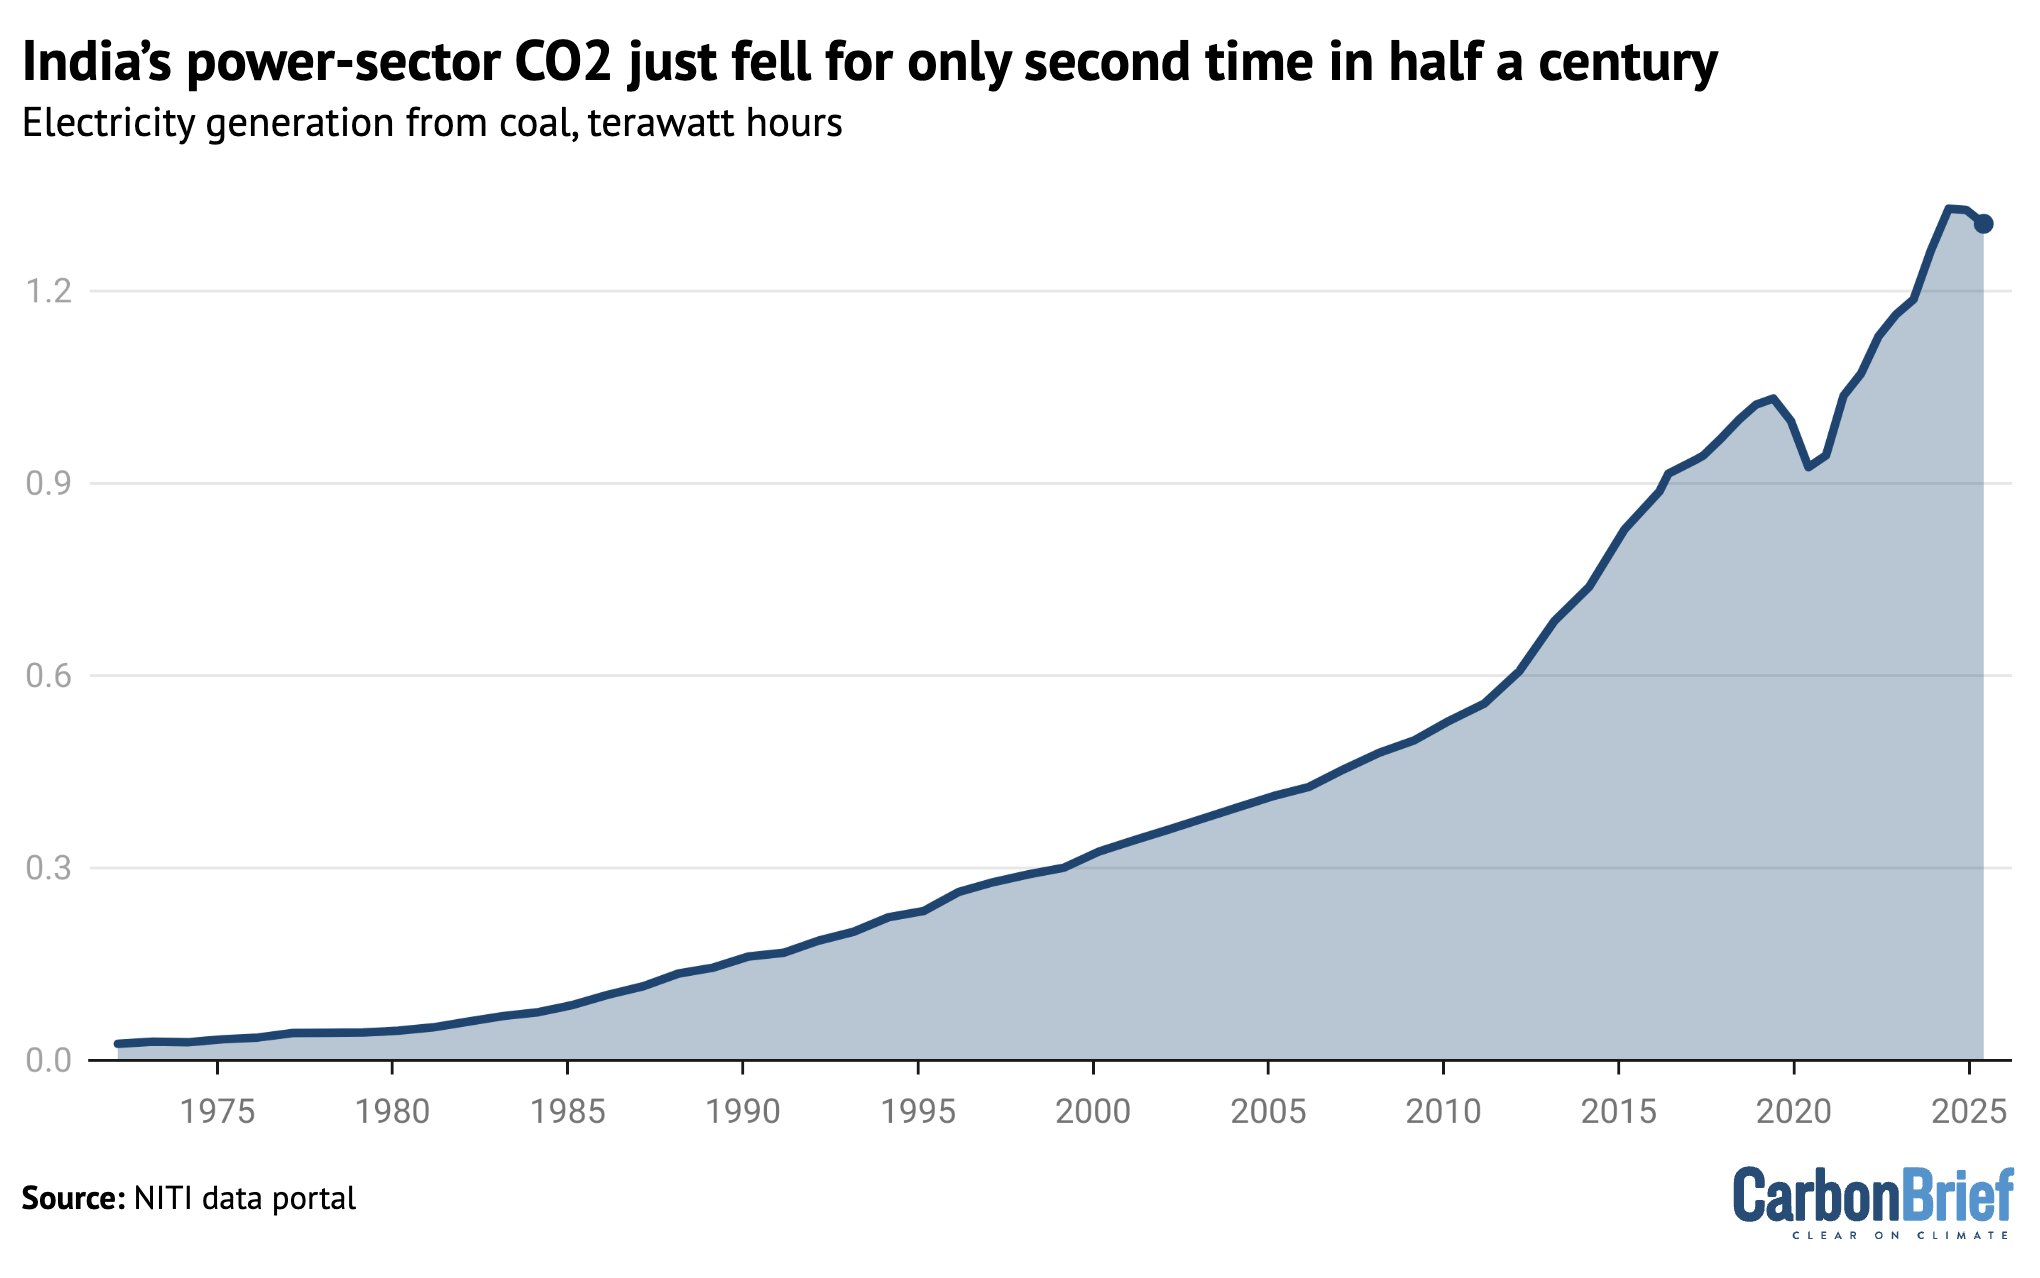
However, emissions have been growing rapidly, as shown in the figure below.
The country contributed 31% of global energy-sector emissions growth in the decade to 2024, rising to 37% in the past five years, due to a surge in the three-year period from 2021-23.
More than half of India’s CO2 output comes from coal used for electricity and heat generation, making this sector the most important by far for the country’s emissions.
The second-largest sector is fossil fuel use in industry, which accounts for another quarter of the total, while oil use for transport makes up a further eighth of India’s emissions.
India’s CO2 emissions from fossil fuels and cement grew by 8% per year from 2019 to 2023, quickly rebounding from a 7% drop in 2020 due to Covid.
Before the Covid pandemic, emissions growth had averaged 4% per year from 2010 to 2019, but emissions in 2023 and 2024 rose above the pre-pandemic trendline.
This was despite a slower average GDP growth rate from 2019 to 2024 than in the preceding decade, indicating that the economy became more energy- and carbon-intensive. (For example, growth in steel and cement outpaced the overall rate of economic growth.)
A turnaround came in the second half of 2024, when emissions only increased by 2% year-on-year, slowing down to 1% in the first half of 2025, as seen in the figure below.

The largest contributor to the slowdown was the power sector, which was responsible for 60% of the drop in emissions growth rates, when comparing the first half of 2025 with the years 2021-23.
Oil demand growth slowed sharply as well, contributing 20% of the slowdown. The only sectors to keep growing their emissions in the first half of 2025 were steel and cement production.
Another 20% of the slowdown was due to a reduction in coal and gas use outside the power, steel and cement sectors. This comprises construction, industries such as paper, fertilisers, chemicals, brick kilns and textiles, as well as residential and commercial cooking, heating and hot water.
This is all shown in the figure below, which compares year-on-year changes in emissions during the second half of 2024 and the first half of 2025, with the average for 2021-23.

Power sector emissions fell by 1% in the first half of 2025, after growing 10% per year during 2021-23 and adding more than 50m tonnes of CO2 (MtCO2) to India’s total every six months.
Oil product use saw zero growth in the first half of 2025, after rising 6% per year in 2021-23.
In contrast, emissions from coal burning for cement and steel production rose by 10% and 7%, respectively, while coal use outside of these sectors fell 2%.
Gas consumption fell 7% year-on-year, with reductions across the power and industrial sectors as well as other users. This was a sharp reversal of the 5% average annual growth in 2021-23.
Power-sector emissions pause
The most striking shift in India’s sectoral emissions trends has come in the power sector, where coal consumption and CO2 emissions fell 0.2% in the 12 months to June and 1% in the first half of 2025, marking just the second drop in half a century, as shown in the figure below.
The reduction in coal use comes after more than a decade of break-neck growth, starting in the early 2010s and only interrupted by Covid in 2020. It also comes even as the country plans large amounts of new coal-fired generating capacity.
In the first half of 2025, total power generation increased by 9 terawatt hours (TWh) year-on-year, but fossil power generation fell by 29TWh, as output from solar grew 17TWh, from wind 9TWh, from hydropower by 9TWh and from nuclear by 3TWh.
Analysis of government data shows that 65% of the fall in fossil-fuel generation can be attributed to lower electricity demand growth, 20% to faster growth in non-hydro clean power and the remaining 15% to higher output at existing hydropower plants.
Slower growth in electricity usage was largely due to relatively mild temperatures and high rainfall, in contrast to the heatwaves of 2024. A slowdown in industrial sectors in the second quarter of the year also contributed.
In addition, increased rainfall drove the jump in hydropower generation. India received 42% above-normal rainfall from March to May 2025. (In early 2024, India’s hydro output had fallen steeply as a result of “erratic rainfall”.)
Lower temperatures and this abundant rainfall reduced the need for air conditioning, which is responsible for around 10% of the country’s total power demand. In the same period in 2024, demand surged due to record heatwaves and higher temperatures across the country.
The growth in clean-power generation was buoyed by the addition of a record 25.1GW of non-fossil capacity in the first half of 2025. This was a 69% increase compared with the previous period in 2024, which had also set a record.
Solar continues to dominate new installations, with 14.3GW of capacity added in the first half of the year coming from large scale solar projects and 3.2GW from solar rooftops.
Solar is also adding the majority of new clean-power output. Taking into account the average capacity factor of each technology, solar power delivered 62% of the additional annual generation, hydropower 16%, wind 13% and nuclear power 8%.
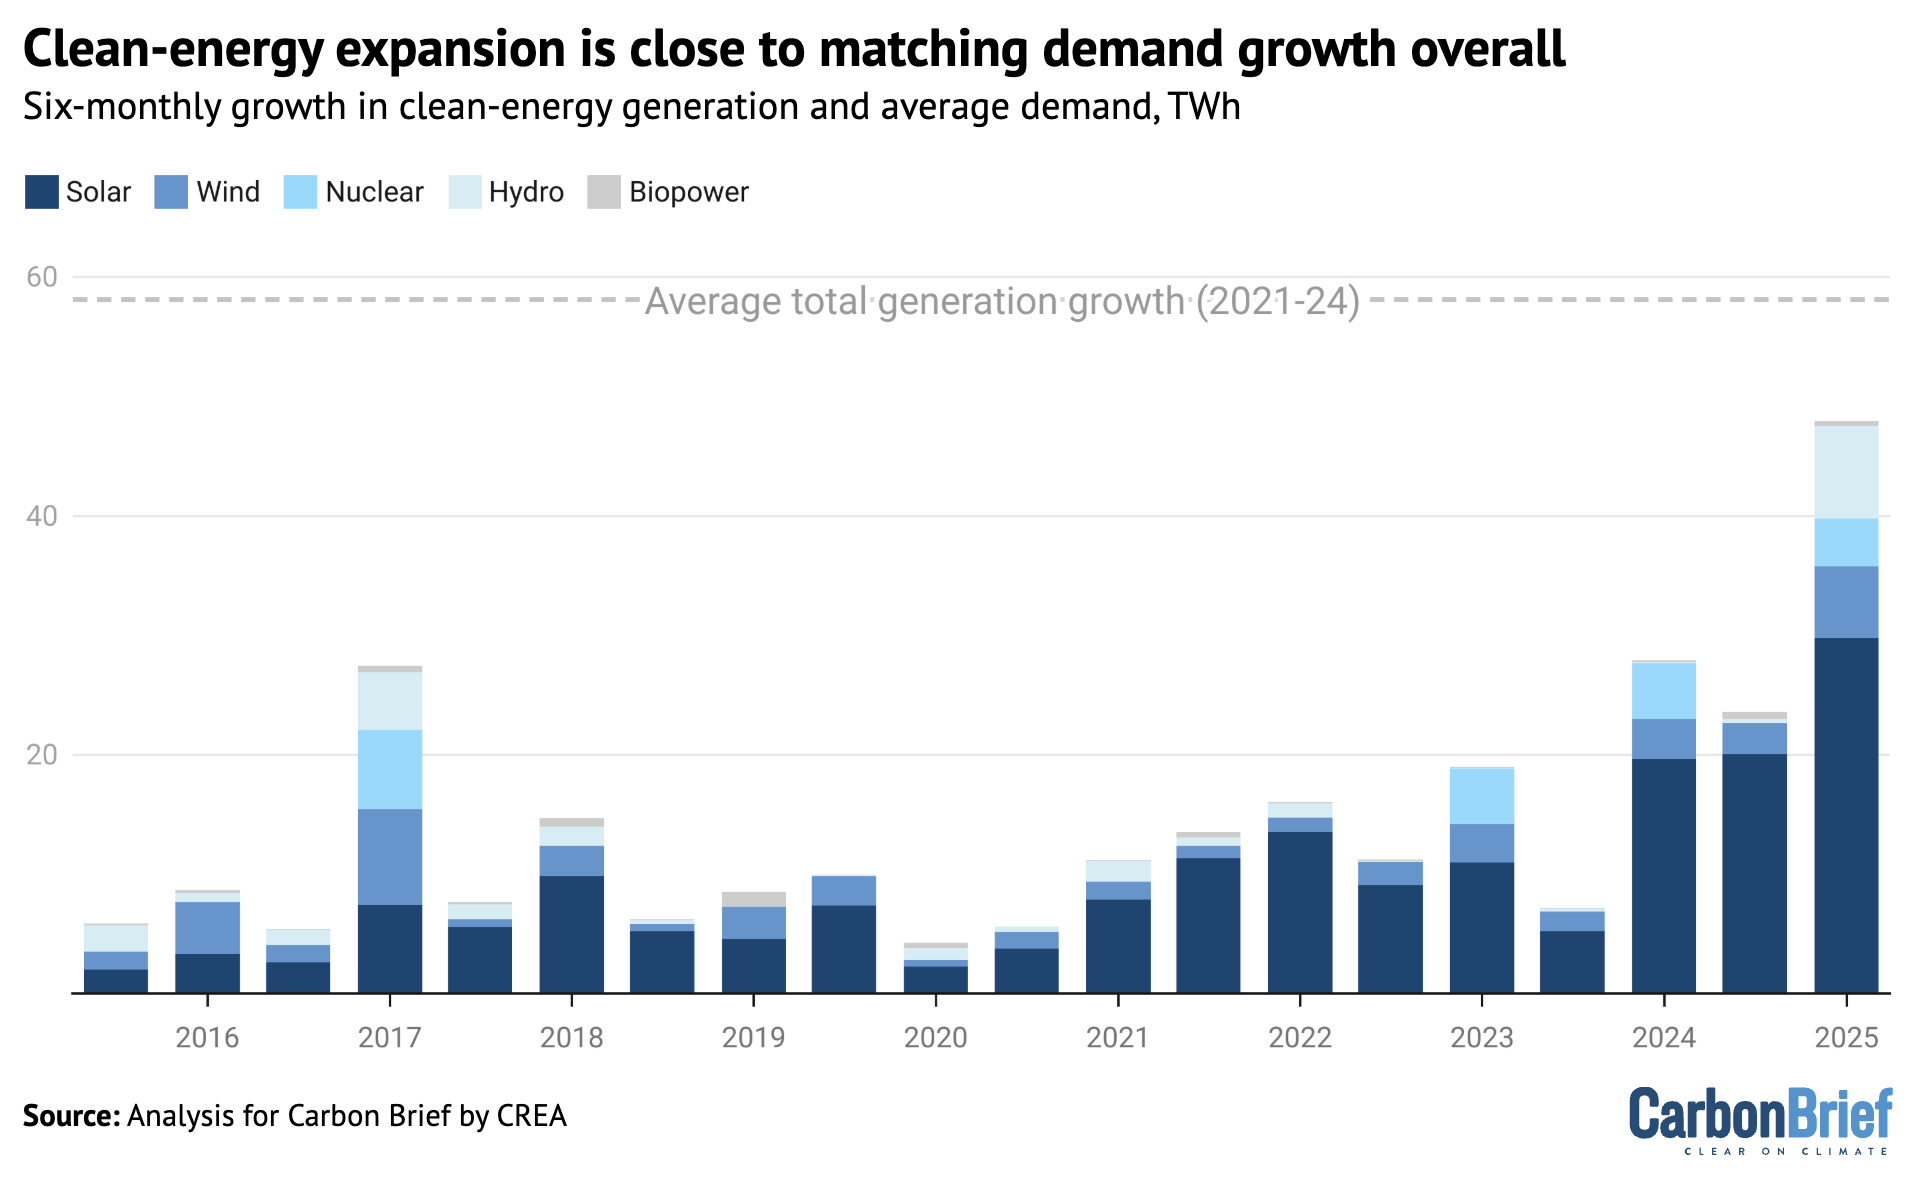
The new clean-energy capacity added in the first half of 2025 will generate record amounts of clean power. As shown in the figure below, the 50TWh per year from this new clean capacity is approaching the average growth of total power generation.
(When clean-energy growth exceeds total demand growth, generation from fossil fuels declines.)
India is expected to add another 16-17GW of solar and wind in the second half of 2025. Beyond this year, strong continued clean-energy growth is expected, towards India’s target for 500GW of non-fossil fuel capacity by 2030 (see below).
Slowing oil demand growth
The first half of 2025 also saw a significant slowdown in India’s oil demand growth. After rising by 6% a year in the three years to 2023, it slowed to 4% in 2024 and zero in the first half of 2025.
The slowdown in oil consumption overall was predominantly due to slower growth in demand for diesel and “other oil products”, which includes bitumen.
In the first quarter of 2025, diesel demand actually fell, due to a decline in industrial activity, limited weather-related mobility and – reportedly – higher uptake of vehicles that run on compressed natural gas (CNG), as well as electricity (EVs).
Diesel demand growth increased in March to May, but again declined in June because of early and unusually severe monsoon rains in India, leading to a slowdown in industrial and mining activities, disrupted supply-chains and transport of raw material, goods and services.
The severe rains also slowed down road construction activity, which in turn curtailed demand for transportation, construction equipment and bitumen.
Weaker diesel demand growth in 2024 had reflected slower growth in economic activity, as growth rates in the industrial and agricultural sectors contracted compared to previous years.
Another important trend is that EVs are also cutting into diesel demand in the commercial vehicles segment, although this is not yet a significant factor in the overall picture.
EV adoption is particularly notable in major metropolitan cities and other rapidly emerging urban centres and in the logistics sector, where they are being preferred for short haul rides over diesel vans or light commercial vehicles.
EVs accounted for only 7.6% of total vehicle sales in the financial year 2024-25, up 22.5% year-on-year, but still far from the target of 30% by 2030.
However, any significant drop in diesel demand will be a function of adoption of EV for long-haul trucks, which account for 32% of the total CO2 emissions from the transport sector. Only 280 electric trucks were sold in 2024, reported NITI Aayog.
Trucks remain the largest diesel consumers. Moreover, truck sales grew 9.2% year-on-year in the second quarter of 2025, driven in part by India’s target of 75% farm mechanisation by 2047. This sales growth may outweigh the reduction in diesel demand due to EVs. Subsidies for electric tractors have seen some pilots, but demand is yet to take off.
Apart from diesel, petrol demand growth continued in the first half of 2025 at the same rate as in earlier years. Modest year-on-year growth of 1.3% in passenger vehicle sales could temper future increases in petrol demand, however. This is a sharp decline from 7.5% and 10% growth rates in sales in the same period in 2024 and 2023.
Furthermore, EVs are proving to be cheaper to run than petrol for two- and three-wheelers, which may reduce the sale of petrol vehicles in cities that show policy support for EV adoption.
Steel and cement emissions continue to grow
As already noted, steel and cement were the only major sectors of India’s economy to see an increase in emissions growth in the first half of 2025.
While they were only responsible for around 12% of India’s total CO2 emissions from fossil fuels and cement in 2024, they have been growing quickly, averaging 6% a year for the past five years.
The growth in emissions accelerated in the first half of 2025, as cement output rose 10% and steel output 7%, far in excess of the growth in economic output overall.
Steel and cement growth accelerated further in July. A key demand driver is government infrastructure spending, which tripled from 2019 to 2024.
In the second quarter of 2025, the government’s capital expenditure increased 52% year-on-year. albeit from a low base during last year’s elections. This signals strong growth in infrastructure.
The government is targeting domestic steel manufacturing capacity of 300m tonnes (Mt) per year by 2030, from 200Mt currently, under the National Steel Policy 2017, supported by financial incentives for firms that meet production targets for high quality steel.
The government also imposed tariffs on steel imports in April and stricter quality standards for imports in June, in order to boost domestic production.
Government policies such as Pradhan Mantri Awas Yojna – a “housing for all” initiative under which 30m houses are to be built by FY30 – is further expected to lift demand for steel and cement.
The automotive sector in India is expected to grow at a fast pace, with sales expected to reach 7.5m units for passenger vehicle and commercial vehicle segments from 5.1m units in 2023, in addition to rapid growth in electric vehicles. This can be expected to be another key driver for growth of the steel sector, as 900 kg of steel is used per vehicle.
Without stringent energy efficiency measures and the adoption of cleaner fuel, the expected growth in steel and cement production could drive significant emissions growth from the sector.
Power-sector emissions could peak before 2030
Looking beyond this year, the analysis shows that CO2 from India’s power sector could peak before 2030, having previously been the main driver of emissions growth.
To date, India’s clean-energy additions have been lagging behind the growth in total electricity demand, meaning fossil-fuel demand and emissions from the sector have continued to rise.
However, this dynamic looks likely to change. In 2021, India set a target of having 500GW of non-fossil power generation capacity in place by 2030. Progress was slow at first, so meeting the target implies a substantial acceleration in clean-energy additions.
The country has been laying the groundwork for such an acceleration.
There was 234GW of renewable capacity in the pipeline as of April 2025, according to the Ministry of New and Renewable Energy. This includes 169GW already awarded contracts, of which 145GW is under construction, and an additional 65GW put out to tender. There is also 5.2GW of new nuclear capacity under construction.
If all of this is commissioned by 2030, then total non-fossil capacity would increase to 482GW, from 243GW at the end of June 2025, leaving a gap of just 18GW to be filled with new projects.
When the non-fossil capacity target was set in 2021, CREA assessed that the target would suffice to peak demand for coal in power generation before 2030. This assessment remains valid and is reinforced by the latest Central Electricity Authority (CEA) projection for the country’s “optimal power mix” in 2030, shown in the figure below.

In the CEA’s projection, the share of non-fossil power generation rises to 44% in the 2029-30 fiscal year, up from 25% in 2024-25. From 2025 to 2030, power demand growth, averaging 6% per year, is entirely covered from clean sources.
To accomplish this, the growth in non-fossil power generation would need to accelerate over time, meaning that towards the end of the decade, the growth in clean power supply would clearly outstrip demand growth overall – and so power generation from fossil fuels would fall.
While coal-power generation is expected to flatline, large amounts of new coal-power capacity is still being planned, because of the expected growth in peak electricity demand.
The post-Covid increase in electricity demand has given rise to a wave of new coal power plant proposals. Recent plans from the government target an increase in coal-power capacity by another 80-100GW by 2030-32, with 35GW already under construction as of July 2025.
The rationale for this is the increase in peak electricity loads, associated in particular with worsening heatwaves and growing use of air conditioning. The increase might yet prove unneeded.
Analysis by CREA shows that solar and wind are making an increasing contribution to meeting peak loads. This contribution will increase with the roll-out of solar power with integrated battery storage, the cost of which fell by 50-60% from 2023 to 2025.
The latest auction held in India saw solar power with battery storage bidding at prices, per unit of electricity generation, that were lower than the cost of new coal power.
This creates the opportunity to accelerate the decarbonisation of India’s power sector, by reducing the need for thermal power capacity.
The clean-energy buildout has made it possible for India to peak its power-sector emissions within the next few years, if contracted projects are built, clean-energy growth is maintained or accelerated beyond 2030 and demand growth remains within the government’s projections.
This would be a major turning point, as the power sector has been responsible for half of India’s recent emissions growth. In order to peak its emissions overall, however, India would still need to take further action to address CO2 from industry and transport.
With the end-of-September 2025 deadline nearing, India has yet to publish its international climate pledge (nationally determined contribution, NDC) for 2035 under the Paris Agreement, meaning its future emissions path, in the decades up to its 2070 net-zero goal, remains particularly uncertain.
The country is expected to easily surpass the headline climate target from its previous NDC, of cutting the emissions intensity of its economy to 45% below 2005 levels by 2030. As such, this goal is “unlikely to drive real world emission reductions”, according to Climate Action Tracker.
In July of this year, it met a 2030 target for 50% of installed power generating capacity to be from non-fossil sources, five years early.
About the data
This analysis is based on official monthly data for fuel consumption, industrial production and power generation from different ministries and government institutes.
Coal consumption in thermal power plants is taken from the monthly reports downloaded from the National Power Portal of the Ministry of Power. The data is compiled for the period January 2019 until June 2025. Power generation and capacity by technology and fuel on a monthly basis are sourced from the NITI data portal.
Coal use at steel and cement plants, as well as process emissions from cement production, are estimated using production indices from the Index of Eight Core Industries released monthly by the Office of Economic Adviser, assuming that changes in emissions follow production volumes.
These production indices were used to scale coal use by the sectors in 2022. To form a basis for using the indices, monthly coal consumption data for 2022 was constructed for the sectors using the annual total coal consumption reported in IEA World Energy Balances and monthly production data in a paper by Robbie Andrew, on monthly CO2 emission accounting for India.
Annual cement process emissions up to 2024 were also taken from Robbie Andrew’s work and scaled using the production indices. This approach better approximated changes in energy use and emissions reported in the IEA World Energy Balances, than did the amounts of coal reported to have been dispatched to the sectors, showing that production volumes are the dominant driver of short-term changes in emissions.
For other sectors, including aluminium, auto, chemical and petrochemical, paper and plywood, pharmaceutical, graphite electrode, sugar, textile, mining, traders and others, coal consumption is estimated based on data on despatch of domestic and imported coal to end users from statistical reports and monthly reports by the Ministry of Coal, as consumption data is not available.
The difference between consumption and dispatch is stock changes, which are estimated by assuming that the changes in coal inventories at end user facilities mirror those at coal mines, with end user inventories excluding power, steel and cement assumed to be 70% of those at coal mines, based on comparisons between our data and the IEA World Energy Balances.
Stock changes at mines are estimated as the difference between production at and despatch from coal mines, as reported by the Ministry of Coal.
In the case of the second quarter of the year 2025, data on domestic coal has been taken from the monthly reports by the Ministry of Coal. The regular data releases on coal imports have not taken place for the second quarter of 2025, for unknown reasons, so data was taken from commercial data providers Coal Hub and mjunction services ltd.
Product-wise petroleum product consumption data, as well as gas use by sector, was downloaded from the Petroleum Planning and Analysis Cell of the Ministry of Petroleum & Natural Gas.
As the fuel dispatch and consumption data is reported as physical volumes, calorific values are taken from IEA’s World Energy Balance and CO2 emission factors from 2006 IPCC Guidelines for National Greenhouse Gas Inventories.
Calorific values are assigned separately to different fuel types, including domestic and imported coal, anthracite and coke, as well as petrol, diesel and several other oil products.


The post Analysis: India’s power-sector CO2 falls for only second time in half a century appeared first on Carbon Brief.
Analysis: India’s power-sector CO2 falls for only second time in half a century
Mae Buenaventura is the manager of the debt justice programme of the Asian Peoples’ Movement on Debt and Development, a regional alliance of peoples’ movements, community organizations, coalitions, NGOs and networks
A potentially historic shift in public debt governance is set to unfold in Washington DC this week as Global South governments take a collective stand to stop a “silent killer” of development financing.
The first-ever UN-hosted borrowers’ forum will officially be launched on April 15 on the sidelines of the 2026 Spring Meetings of the International Monetary Fund (IMF) and the World Bank. Led by five convening countries – Zambia, Egypt, Nepal, the Maldives and Pakistan – the initiative is one of the key wins of last year’s 4th Financing for Development Conference (FFD4) in Sevilla, Spain.
The forum’s mandate is to establish a platform for borrower countries, supported by a UN secretariat, “to discuss technical issues, share information and experiences in addressing debt challenges, increase access to technical assistance and capacity-building in debt management, coordinate approaches and strengthen borrower countries’ voices in the global debt architecture”.
Instead of facing lenders alone, these countries will now use a UN-backed platform to share technical expertise and coordinate their approach to a global debt system that is fundamentally broken.
Debt grips climate-vulnerable nations
The human cost of the current debt architecture is staggering. According to the UN trade and development agency, UNCTAD, more than 40% of the global population – roughly 3.4 billion people – live in countries where the government is forced to spend more on debt payments than on the health, education and social protection of its citizens.
In so-called low-income countries, governments spend an average of 7.5% of their total budgets on debt service, with interest payments consuming up to 20% of total government revenue in these regions.
The Philippines is a case study in this financial stranglehold. It is part of a global majority forced to watch its public services crumble and infrastructure lag while its wealth is siphoned off to satisfy foreign lenders.
The policy of automatic appropriations – a legacy of the rule of late former President Ferdinand Marcos Sr. – mandates that debt servicing takes precedence over any other public expenditure, effectively placing the demands of lenders above the needs of the Filipino people. Even as it faces a $1.5 trillion regional financing gap to achieve the Sustainable Development Goals (SDGs) by 2030, its hands remain tied by a legal framework that values credit ratings over human lives.
-
GEF raises $3.9bn ahead of funding deadline, $1bn below previous budget
Amid aid cuts, donor governments pledge less nature and climate funding to the Global Environment Facility (GEF), with the four-year package to be finalised in late May -
Charging worries, high prices put brakes on EV growth in Bangladesh
Sales of e-bikes and rickshaws are up amid queues at fuel stations, but a lack of charging infrastructure and high prices still deter many Bangladeshis from going electric


As a “middle-income country” (MIC), the Philippines is stuck in a frustrating purgatory. It is often deemed “too wealthy” for the G20’s debt-relief framework, yet too poor to absorb global economic shocks. Last year, Finance Undersecretary Joven Balbosa hit the nail on the head when he called for support that goes “beyond the simplistic income categorization” that ignores a country’s actual vulnerabilities.
Without an inclusive and equitable global debt architecture, nations including the Philippines are left to navigate catastrophic climate risks and economic shocks with zero fiscal breathing space.
No respite during climate disasters
The regional evidence of this systemic failure is everywhere. Take Pakistan, which in 2022 was hit by catastrophic flooding that submerged a third of the country and caused billions in losses. Despite this climate-driven disaster, World Bank data shows that Pakistan made payments in 2023 of $11.8 billion for public and publicly guaranteed (PPG) external debt, while its PPG external debt reached $93 billion that same year, surpassing pre-pandemic debt of $87 billion (2020).
Sri Lanka followed IMF prescriptions throughout 16 lending programs since 1991, only to become the first Asian country this century to default. Its MIC status prevents application for debt relief and restructuring measures. Today, the Sri Lankan people bear the brunt of harsh conditionalities, including raising VAT from 8% to 15%, slashing food and fuel subsidies, and the erosion of hard-earned worker pensions.

Currently, the global rules of lending and borrowing are set by a “creditors’ club” composed of the IMF, the World Bank and the Global Sovereign Debt Roundtable it set up, and the Paris Club.
These institutions measure “debt sustainability” through a narrow lens of a country’s capacity to make timely repayments. They largely ignore internal economic inequalities, gender disparities and the existential threat of climate change.
Crises should trigger debt service cancellation
By organising the new borrowers’ forum, the Global South is signalling that the era of passive “standard-setting” by lenders is over.
The ultimate goal for global civil society and debt justice movements is the establishment of a UN Debt Convention; a democratic, binding and inclusive framework that governs both lenders and borrowers. This mechanism would ensure that debt restructuring and cancellation are sufficient to allow countries to fulfill their international human rights obligations and implement necessary climate actions.
Green Climate Fund picks locations for five developing country hubs
To be truly transformative, debt sustainability analyses must align with human rights and sustainable development needs. This means conducting impact assessments – both before and after loans are issued – to identify “illegitimate” debts that do not benefit the public.
Crucially, we need an automatic debt service cancellation mechanism that triggers during extreme climatic, environmental or health shocks. We also need a binding global debt registry to ensure that every loan is transparent and subject to public scrutiny.
Whether the borrowers’ forum becomes a true milestone depends on its courage to challenge the status quo. We can no longer allow debt to act as a “silent killer” of our future. It is time to demand a financial system that serves humanity, not just the balance sheets of the powerful.
The post Broken debt system must be fixed to confront future climate shocks appeared first on Climate Home News.
Broken debt system must be fixed to confront future climate shocks
Greenpeace and allies will be protesting outside Woodside’s Annual General Meeting to show the WA and federal governments strong community opposition to Woodside’s proposal to drill for gas at Scott Reef.
What: Protest outside Woodside Energy’s Annual General Meeting
When: 8am Thursday 23rd April 2026Where: Kagoshima Park (on the corner of Great Eastern Highway and Bolton Avenue)
What’s at stake
Scott Reef is a pristine ocean ecosystem off the north-west coast of Australia.
It is home to endangered and endemic species, including pygmy blue whales and the dusky sea snake, and a nesting ground for green sea turtles. Scott Reef is a place of extraordinary natural beauty, and a vital marine environment that supports a wide range of marine life.
What Woodside is proposing
Dirty fossil fuel corporation, Woodside Energy, is seeking approval to drill more than 50 gas wells underneath and around Scott Reef as part of its Browse project.
The gas would be extracted and transported to the Burrup Hub, the most polluting fossil fuel project in Australia. This proposal would industrialise the doorstep of Australia’s largest freestanding oceanic reef system – threatening the marine life that relies on it and the climate.
Why this can’t go ahead
The WA Environmental Protection Authority has already identified the risks of this project as “unacceptable”, issuing a preliminary rejection.
Serious concerns include:
- The risk of an oil spill
- Impacts on pygmy blue whales
- Damage to green sea turtle nesting grounds
These risks are severe, and potentially irreversible. But the decision hasn’t been made yet. The project is still being assessed.
The Federal Environment Minister is approaching a decision that will determine whether Scott Reef is protected – or vulnerable to decades of industrial gas destruction.
This is a defining moment.
Make opposition visible
Across Australia, people are speaking out to protect Scott Reef and oppose Woodside’s Browse project.
Showing that opposition is visible, coordinated and growing helps increase pressure on decision-makers ahead of this critical decision.
Join the protest
A protest outside Woodside’s AGM is a key public moment to demonstrate opposition and help protect Scott Reef.
Kagoshima Park (on the corner of Great Eastern Highway and Bolton Avenue) 8am, Thursday 23rd April 2026
Join the protest and help show how many people support protecting Scott Reef before the government makes its decision.
Join Greenpeace to save Scott Reef from Woodside’s dirty gas
As demand for whale meat declines at home, Norway exports it to Japan, markets it to tourists and sells it online as dog food.
Norway reopened its annual whale hunting season earlier this month, continuing a practice most countries abandoned decades ago.
Norway Reopens Annual Whale Hunt Despite Pressure to End Commercial Whaling


-
Climate Change8 months ago
Guest post: Why China is still building new coal – and when it might stop
-
Greenhouse Gases8 months ago
Guest post: Why China is still building new coal – and when it might stop
-

 Greenhouse Gases2 years ago
嘉宾来稿:满足中国增长的用电需求 光伏加储能“比新建煤电更实惠”
-
Climate Change2 years ago
Bill Discounting Climate Change in Florida’s Energy Policy Awaits DeSantis’ Approval
-

 Climate Change2 years ago
嘉宾来稿:满足中国增长的用电需求 光伏加储能“比新建煤电更实惠”
-
Climate Change Videos2 years ago
The toxic gas flares fuelling Nigeria’s climate change – BBC News
-

 Renewable Energy6 months ago
Sending Progressive Philanthropist George Soros to Prison?
-

 Carbon Footprint2 years ago
US SEC’s Climate Disclosure Rules Spur Renewed Interest in Carbon Credits