
A Conservative victory over the Liberals in the Canadian election could lead to nearly 800m extra tonnes of greenhouse gas emissions over the next decade, according to Carbon Brief analysis.
This amounts to the entire annual emissions of the UK and France combined.
These extra emissions would cause around C$233bn ($169bn) in climate damages around the world, based on the Canadian government’s official costings.
The right-leaning Conservative party, led by Pierre Poilievre, has pledged to cut one of the nation’s most significant climate policies – industrial carbon pricing – as well as other key regulations.
If these policies are removed and not replaced, modelling by researchers from Simon Fraser University and University of Victoria shows that Canada’s gradually declining emissions would likely start to creep up again in the coming years.
In contrast, emissions would continue to fall under the policies currently backed by Mark Carney’s centrist Liberal party, which has overseen a modest decrease over the past decade.
However, Carbon Brief analysis of the modelling also suggests that neither of the major parties’ policy platforms would put Canada on track to reach any of its climate targets.
These figures complement analysis by the Canadian government showing that the nation still needs to implement more ambitious measures in order to reach its target to cut emissions to net-zero by 2050.
(For more on Canada’s election, see Carbon Brief’s manifesto tracker, which captures what the major parties have said about climate change, energy and nature.)
Conservatives could raise emissions
Canada is the world’s 10th biggest emitter of greenhouse gases. Significant contributors include its sizeable oil-and-gas sector and high emissions from transport.
The nation has been relatively slow to decarbonise. However, after a decade of rule by the Liberals, led by prime minister Justin Trudeau, there has been a small dip in Canada’s emissions.
With a federal election looming, an unpopular Trudeau resigned and was replaced in March by Carney, an economist with a background in climate finance.
His main rival in the election, which takes place on 28 April, will be the Conservatives, a party that until recently was the clear favourite. Conservative leader Poilievre has accused the Liberal government of pursuing “net-zero environmental extremism” and Carney of being part of the “radical net-zero movement”.
A sudden shift in polling that put the Liberals ahead has been widely attributed to their right-leaning opponents’ alignment with Donald Trump. This alignment has become politically toxic, following the US president’s tariffs and talk of annexing Canada.
Carbon pricing is at the heart of Canadian climate politics. Poilievre has long pledged to “axe the tax”, referring to a consumer levy that is meant to incentivise people to use less fossil fuel.
When Carney took office, his first action was to cut this carbon tax to zero, effectively ending his party’s signature climate policy.
In response, Poilievre pledged to cut the “entire carbon tax”, referring to a federal backstop on carbon pricing applied to major industrial emitters, such as fossil-fuel producers. He has also committed to abandoning other climate regulations.
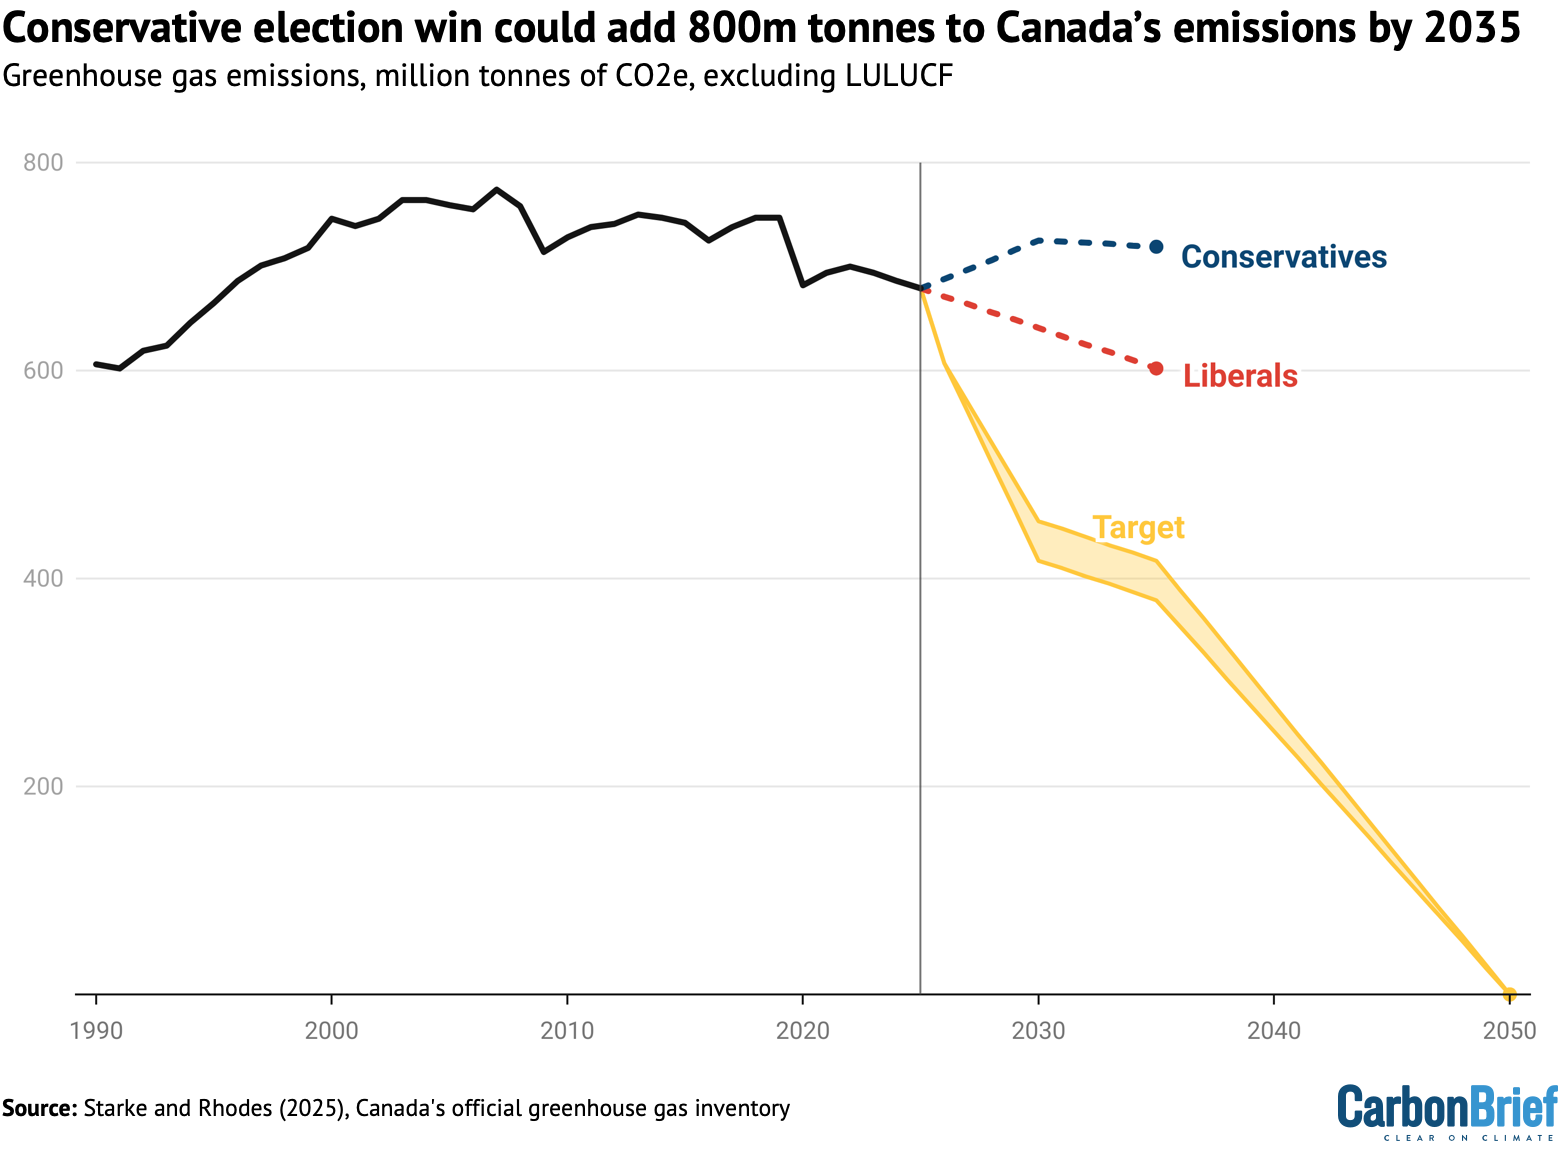
The impact of these rollbacks is illustrated by the “Conservatives” line in the figure below, based on the party’s climate-related announcements to date. Notably, Canada’s emissions would be expected to start rising again, reversing some of the recent decline.
The “Liberals” line is based on current federal policies, excluding the consumer carbon tax. It would see a continued, steady drop in emissions if the Liberals retain power, even if they fail to implement any new climate policies after the election.
As such, a Conservative victory could mean an additional 771m tonnes of carbon dioxide equivalent (MtCO2e) entering the atmosphere by 2035.
Along with the US, Canada has long calculated the “social cost of carbon” and other greenhouse gases, in order to place a value on any emissions changes resulting from new regulations.
Based on Carbon Brief analysis of the government’s own figures for this metric, the extra emissions released under a Conservative government could result in global damages worth C$233bn ($169bn).
The emissions trajectories out to 2035 are based on modelling carried out by climate scientists Emma Starke, a PhD researcher at Simon Fraser University, and Dr Katya Rhodes, an associate professor at the University of Victoria.
Starke and Rhodes simulated the policy platforms of the two major Canadian parties using the CIMS energy-economy model, a well-established tool for understanding the country’s federal climate policies.
The researchers ran the models out to 2035, twice the normal parliamentary term length, to reflect the timespan it can take for policies to significantly affect annual emissions.
Starke tells Carbon Brief the “simple message” of their work is that a federal Liberal government is “likely to continue reducing emissions while a Conservative government would see them rise significantly”.
If the Conservative party were to trigger such a reversal, Canada would be the only G7 nation with rising emissions.
The nation is already something of an outlier, with slower emissions cuts than most major global-north economies and per-capita emissions three times higher than the EU average.
Even in the “Liberals” scenario modelled by Starke and Rhodes, emissions would only fall to 1990 levels in 2035. Meanwhile, nations such as the UK and Germany have already roughly halved their emissions from 1990 levels, even as their economies have expanded.
Canada continues to miss targets
Canada has a net-zero target for 2050. Under the Canadian Net-Zero Emissions Accountability Act, it also has interim targets of cutting its emissions to 20% below 2005 levels by 2026, 40-45% by 2030 and 45-50% by 2035.
As the yellow lines in the chart above show, neither of the major Canadian parties has set out a policy programme that is sufficient to achieve the nation’s climate targets.
Emissions cuts from land use, land-use change and forestry (LULUCF), which count towards these targets, are not captured in the CIMS modelling of the two parties’ climate policies.
However, even when accounting for projected LULUCF emissions reductions, Carbon Brief analysis suggests a potential Liberal government’s annual emissions could be nearly one-third higher than the 2030 target.
Under a Conservative government, this gap could widen to more than 50% higher. (For more information about LULUCF estimates, see the Methodology.)
For context, the Conservatives’ gap in 2030 would be nearly equivalent to the entire annual emissions of Bangladesh. The Liberals’ gap in the same year would be roughly the size of Kuwait’s annual emissions.
This pessimistic outlook is supported by analysis from the Canadian government itself and independent analysts at the Canadian Climate Institute (CCI). Both have repeatedly shown that Canada is not on track to achieve its climate targets. (Analysts at Climate Action Tracker have also described Canada’s policies as “insufficient” to reach the world’’s Paris Agreement targets.)
This is confirmed by the most recent official projections, published by the government in December 2024 alongside Canada’s first “biennial transparency report” (BTR) to the UN.
The chart below shows that neither of the main scenarios modelled by the government would be sufficient for Canada to reach its targets, meaning further policies would be needed to get on track.
Even in the government’s most optimistic scenario, Canada would only achieve an 18% emissions cut by 2026 – rather than the 20% being targeted – and a 34% cut by 2030, rather than 40%.
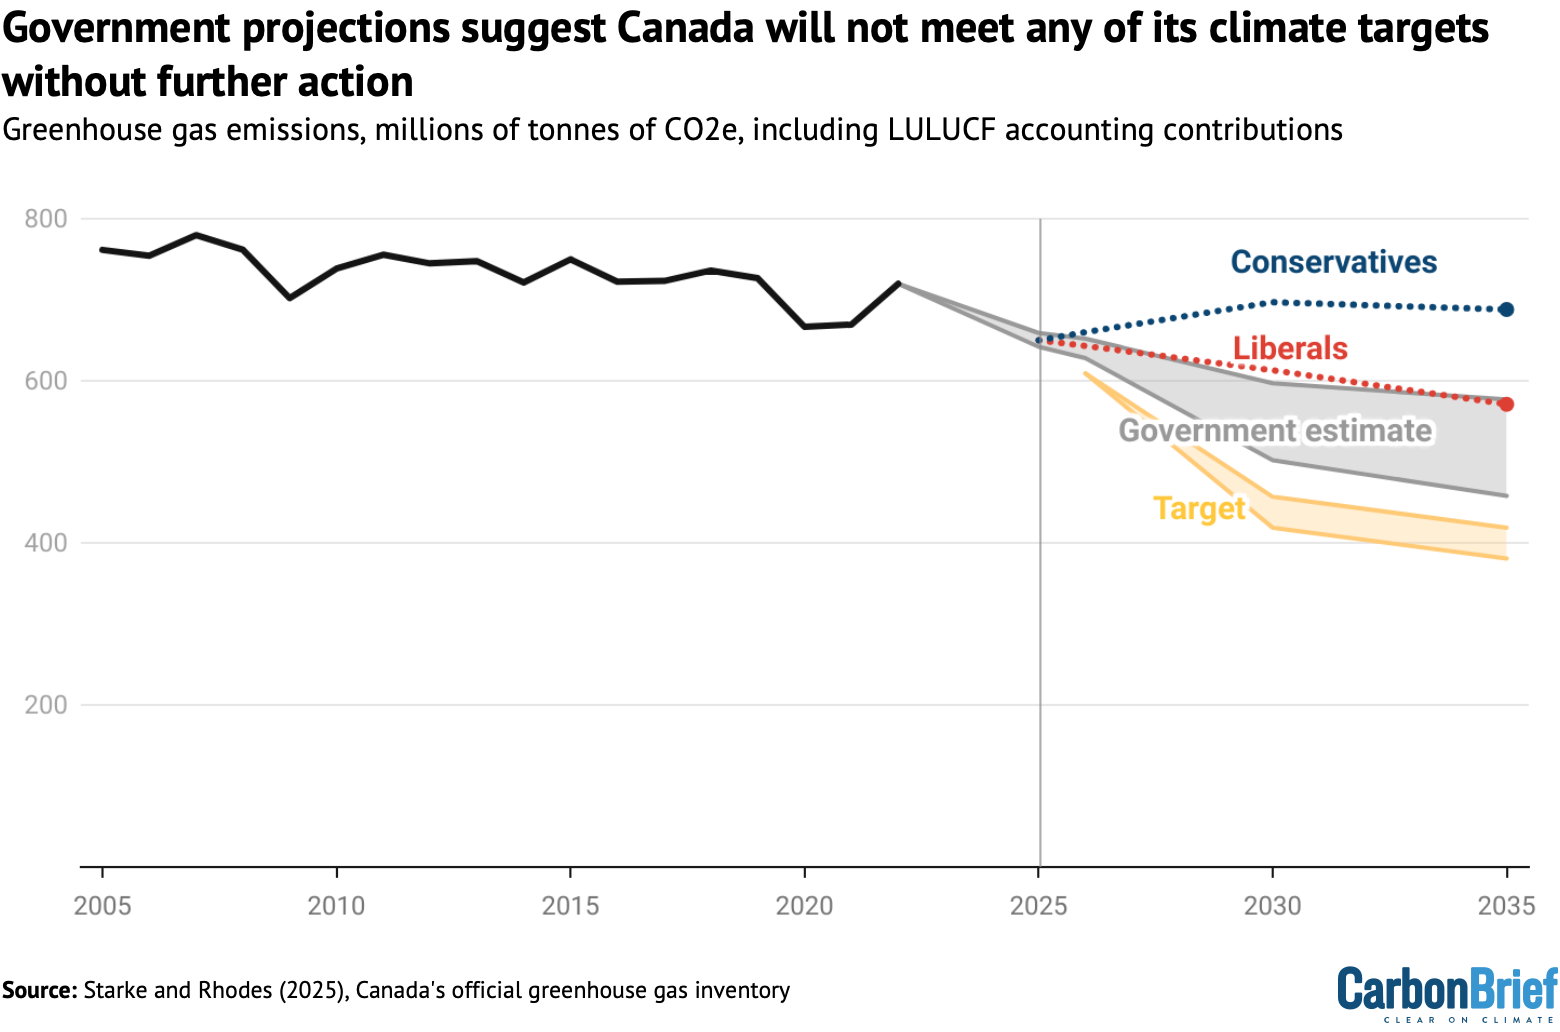
The “reference” scenario, shown by the upper grey line in the chart above, accounts for all federal, provincial and territorial policies that were in place by August 2024 and assumes no further government action. (This means it does not include more recent actions, such as scrapping consumer carbon pricing.)
The “additional measures” scenario, shown by the lower grey line in the chart above, includes extra measures that were announced, but not yet implemented.
It also includes extra emissions cuts from nature-based solutions, agricultural changes and a small number of international carbon credits purchased from the Western Climate Initiative. (Both scenarios also include accounting contributions from LULUCF.)
As the chart shows, the “Liberals” scenario modelled by Starke and Rhodes broadly aligns with the reference scenario, once LULUCF contributions are included. (This is despite Starke and Rhodes excluding the consumer carbon tax, see below.)
In the introduction to Canada’s 2024 BTR, Liberal climate minister Steven Guilbeault writes:
“We have more work to do to achieve our enhanced 2030 target of 40-45% below 2005 emissions.”
The parties’ climate platforms
In an election dominated by the growing economic threat from the US, climate change has not been seen as a key issue by either politicians or voters. (See Carbon Brief’s election manifesto tracker for more on how climate has featured so far.)
The modelling by Starke and Rhodes captures the impact of the climate policy proposals that have been announced by the Liberals and the Conservatives ahead of election day.
These mainly consist of Conservative commitments to eliminate parts of Canada’s climate strategy, citing high costs. Perhaps most significantly, the party has pledged to scrap industrial carbon pricing.
This policy involves setting limits on emissions from high-polluting businesses such as steel and fossil-fuel companies. Industries pay for emissions above a certain limit and can obtain saleable credits if they reduce their emissions below that limit.
Provinces and territories can set up their own pricing systems, but there is a federal backstop representing the minimum standards that are required.
Oil-producing regions have already moved to abandon industrial carbon pricing, challenging the federal government to enforce the backstop.
Canada’s climate policies overlap and complement each other in various ways, making it difficult to assign shares of emissions cuts to specific policies.
However, the CCI calculated in 2024 that industrial carbon pricing was set to be the “single biggest driver of emissions reductions” by 2030, accounting for 20-48% of emissions cuts expected over the next five years.
Consumer carbon pricing, commonly referred to simply as the “carbon tax”, is paid by households and small businesses on fuels such as petrol and gas. The CCI estimates that it would only have been responsible for 8-14% of emissions cuts by 2030.
Both parties have abandoned consumer carbon pricing and this is captured in the emissions trajectories modelled by Starke and Rhodes.
The Conservative election manifesto confirms earlier pledges to scrap a list of climate policies, which are also captured in the modelling. These include Canada’s electric vehicle sales mandate, clean-fuel regulations and clean-electricity regulations.
The electric-vehicle targets, part of Canada’s objective to phase out petrol and diesel vehicle sales by 2035, have been dismissed by Poilievre as a “tax on the poor” that result in people being “forced to pay” extra for electric cars.
Poilievre has referred to clean-fuel regulations, which are intended to boost hydrogen and other alternative fuels in the transport sector, as another form of “carbon tax”. Government estimates suggest these measures would cut emissions by 26MtCO2s annually by 2030.
Unlike these transport-related measures, the clean-electricity regulations are not set to kick in until 2035, so they make minimal difference to the two parties’ trajectories.
The Conservatives have also pledged to scrap the planned emissions cap on Canada’s oil-and-gas sector. The modellers left this out of their simulations, as it has yet to be legislated and there are still uncertainties about its implementation.
The modelling assumes that the Conservatives remove these climate policies and then do not replace them with anything else.
This may not be how things would play out. While the Conservatives are traditionally more opposed to climate action than the Liberals, they have not confirmed that they would withdraw from their national or international obligations altogether.
Indeed, Poilievre has described “technology, not taxes” as “the best way to fight climate change”, saying clean industries should be encouraged in Canada by expanding tax credits. Such proposals are not captured in this modelling.
Starke and Rhodes write that these would in any case have limited impact:
“We do not analyse the effect of various subsidies such as tax credits and grants because all political parties promise these and they have only a marginal effect on greenhouse gas emissions.”
There is also uncertainty around the impact an escalating trade war might have in Canada – including its fossil-fuel sector – as politicians seek to bolster domestic industries. This makes it harder to predict future emissions trajectories under the two parties.
The Conservatives have been more vocal about backing Canada’s fossil-fuel industry, but the Liberals have also expressed support for the sector, including pipeline projects. However, the lack of clarity on such measures mean they only have a “modest effect” in the CIMS modelling, according to Starke and Rhodes.
Methodology
The “Liberal” and “Conservative” scenarios in this article come from modelling by Emma Starke, a PhD researcher at Simon Fraser University, and Dr Katya Rhodes, an associate professor at the University of Victoria.
They used the CIMS energy-economy model to simulate the impact of removing key climate policies, in cases where parties have been clear about their intention to do so.
They did not account for policies that were deemed to have “only a marginal effect on greenhouse gas emissions” and focused on “key regulatory and pricing policies because these are the most important for reducing greenhouse gas emissions”. Their approach is outlined in an article for Policy Options.
The analysis uses the “medium growth scenario” from Statistics Canada forecasts of population and GDP growth.
In the first chart, Carbon Brief uses historical emissions data from Canada’s official greenhouse gas inventory, which at the time of publication includes figures up to 2023. Note that Canadian historical emissions data has undergone changes between years as the government has shifted its methodology. This results in differences between datasets.
Canada’s emissions targets use the baseline year of 2005, for example a 40-45% reduction from 2005. In the most recent inventory, annual emissions in 2005 were 759MtCO2e. This baseline year does not include emissions from LULUCF.
However, Canada can use “accounting contributions” from the LULUCF sector to meet its emissions targets. This involves using a “reference level approach” for managed forest and associated harvested wood products, meaning the government compares actual emissions and removals to a projected “reference level”. It uses a “net-net approach” for all the other LULUCF sub-sectors, meaning both emissions are removals are accounted for to get a net emissions figure.
For simplicity, Carbon Brief has left LULUCF contributions, which are relatively small, out of the historical emissions figures used in the first chart.
The CIMS modelling does not include emissions from LULUCF, so these are not included in the “Liberal” and “Conservative” emissions trajectories. However, in order to calculate the size of the emissions gap between the trajectories and Canada’s future targets, Carbon Brief simply added figures from government projections to these trajectories. These figures amount to emissions reductions of roughly 28-31MtCO2e annually from 2030 out to 2040.
In the second chart, Carbon Brief has used emissions data from the Canadian government’s most recent emissions projections, which appeared in its BTR, published at the end of 2024. These figures are slightly different from the ones in the most recent inventory, include LULUCF contributions and only go out to 2022.
Besides LULUCF contributions, the government reports separately on the impact of nature-based climate solutions, “agriculture measures” and credits purchased under the Western Climate Initiative (WCI), all of which are considered “additional measures” in its modelling. Nature-based solutions and “agriculture measures” cut another 12MtCO2e annually from 2030 onwards, whereas WCI credits are barely used. These figures are included in the “additional measures” government estimate in the second chart.


The post Analysis: Conservative election win could add 800m tonnes to Canada’s emissions by 2035 appeared first on Carbon Brief.
Analysis: Conservative election win could add 800m tonnes to Canada’s emissions by 2035
Andreas Sieber is head of political strategy at 350.0g. Cat Abreu is director of the International Climate Politics Hub.
From the US abduction of Venezuela’s president at the start of this year to the Iran war which rumbles on, disruption is the new normal for global geopolitics, more often than not linked to conflict over supplies of oil and gas.
Events so far in 2026 – driven largely by the desire of the Trump administration to grab control of fossil fuels around the world – show that the climate community’s approach to energy diplomacy will have to evolve if we are to operate effectively and push for climate action in such a volatile landscape.
Today’s climate and energy governance must be able to cope with trade wars, genocide, fascism, spiralling inequality and challenges to multilateralism. The increasingly dominant paradigms of economic competitiveness, energy security and green industrialisation can help drive the transition but they also challenge our collective mission to deliver an equitable green shift.
US-China rivalry dominates
Longer-term geopolitical trends that are seeing power move from West to East and North to South have fuelled a US–China “superpower rivalry”, which is pulling the global economy apart and reining in trade.
A key question will be how the fracture “lines” are drawn: by the US and China, or also by other countries or blocs? Many governments will try to remain “in the middle” between the two giants to capture economic gains from both sides. Yet despite the language of “strategic autonomy”, Washington and Beijing may be in a position to force choices via market access, export controls and sanctions.
-
Top maritime court rejects bid to halt UN deep-sea mining inquiry
Two subsidiaries of The Metals Company sought to block the probe into potential contract breaches launched after the firm’s application for US-sponsored permits

At first glance, this may not seem particularly relevant for climate and energy politics. But Huawei’s exclusion from 5G operations across the political West and India following the so-called Clean Network Campaign by the US government serves as a warning of what could happen to climate green tech.
And the recent debate to cut out Chinese inverters from European markets follows the same pattern – US security forces perceive a risk and start encouraging their allies to drop Chinese technology.
The new drivers: competition and security
Despite this fracturing geopolitical and economic context, energy transition is still happening. To ensure it is effective and equitable, we need to understand what is driving it and how to adapt climate politics so that it better responds to these drivers.
Put simply, China is supplying the world with low-cost renewables (roughly 60% of critical wind and 80% of solar components), batteries, EVs and other key elements. Other countries now also want their piece of the green tech pie and are forming industrial policies to get it.
It is this new competitiveness-driven logic that will shape the quest for decarbonisation, which has shifted from cooperating around the cost of tackling climate change to rivalry for the benefits of climate action.
Over 90% of new renewables projects are now cheaper than fossil alternatives. Gas-fired power is 3–4 times more expensive than solar and wind. In 2015, most decarbonisation policies were “traditional” emissions-cutting strategies like carbon pricing or net zero dates, whereas green industrial policies now underpin the majority.
Iran war could boost fossil fuel phase-out push, says Colombian minister
Meanwhile, security has become a central driver of energy politics. We are living through the second major fossil fuel crisis in just four years. Elevated oil and gas prices will impose up to $1 trillion in additional costs on the global economy by the end of the year if disruption continues in the Strait of Hormuz. Fossil fuel supply chains have exposed countries to conflict, coercion and brutal price shocks.
Fossil fuel volatility destabilises whole economies – higher fuel costs drive up food prices, increase political instability, and push millions into poverty and hunger. This incentivises governments to shield themselves from global shocks, especially in countries that are net fossil fuel importers and home to roughly three-quarters of the world’s population.
Yet security fears can cut both ways. The same instability that makes fossil fuel dependence untenable is also sharpening concern over China’s dominance of critical clean technologies and supply chains.
Equity, cooperation and the opportunity for change
Developing countries benefit from the rapid uptake of renewables enabled by low-cost Chinese technologies. But significant fiscal space and public investment is needed for the electricity grids and infrastructure required to fully unleash the energy transition, as well as for green industrialisation to diversify revenue streams.
Despite this, industrial-scale domestic production and ownership often remain out of reach for too many countries that lack the fiscal space to allow green supply chains to flourish and compete with their traditional industrial base. But more just and diversified green tech supply chains could be achieved with concomitant support.
Can giant batteries unlock Africa’s green industrial future?
For the first time in decades, the international order is being substantially reshaped. If within this context, decarbonisation is increasingly driven by green industrial policy, energy security and competitiveness, the climate policy community must better anticipate where these debates are moving. We must speak the same language, and enter the forums where decisions are made, including security, trade and bilateral or trilateral spaces.
We should build on an enlightened self interest recognising that cooperation remains essential and beneficial. This includes using the UN climate process differently: less as an ever-expanding negotiation machine, and more as a space for norm-setting, political alignment and deal-making. In an age of fragmentation, effective cooperation must not only be framed as necessary but thought of as a strategically compelling source of resilience and shared advantage.
The post Energy transition policymaking must evolve to fit an age of rupture appeared first on Climate Home News.
Energy transition policymaking must evolve to fit an age of rupture
Low-income Indian workers, many of them migrants from rural areas hit by climate change, are paying for worsening extreme heat through lost working days and health complications, with the cost equivalent to 2% of national GDP per year, new research shows.
The International Institute of Environment and Development (IIED), a London-based think-tank, worked with local organisations to survey around 540 households of informal workers in three Indian cities: Ajmer, Delhi and Agra. Most had migrated from rural areas to find work in industries such as construction, brick-making, garment manufacturing and food packaging.
The survey found them struggling through long working days with little access to shade, cooling, rest or water, as well as few toilets for women. And even when they go home, many live in makeshift shelters or airless cramped rooms with barely a single fan, bringing almost no respite.
Outdoor workers are losing about 24 days of work a year due to heat, costing them nearly a tenth of their annual earnings, while indoor workers sacrifice roughly 15 days. On top of losing income, they are also bearing the cost of health problems like heat exhaustion, psychological stress and kidney damage brought on by repeated dehydration.
If the survey’s findings are extrapolated to a national level, the IIED researchers estimate that the decline in productivity and effects of kidney disease combined add up to lost wages of $78 billion each year.
-
Top maritime court rejects bid to halt UN deep-sea mining inquiry
Two subsidiaries of The Metals Company sought to block the probe into potential contract breaches launched after the firm’s application for US-sponsored permits -
Most “zombie credits” locked out of new UN carbon market after China and India snub
Fears of a flood of environmentally-dubious carbon credits have faded, with most old projects not able to transition to new UN market

Vishram Meena, 45, from Alwar in Rajasthan, has worked on construction sites in Ajmer for more than a decade, toiling for 10 to 12 hours a day carrying materials and mixing cement in the full sun.
In May 2024, on one of the hottest days, he collapsed after feeling dizzy and suffering a nosebleed. His wife and colleagues managed to get him to hospital where he was diagnosed with heat stroke. He has since returned to the same building work because the family needs the money.
“I went back because what else could I do? We are not machines. We are human beings. The heat is killing us slowly,” he was quoted as saying in a report on the survey’s findings.
“Victorian-era” conditions
Ritu Bharadwaj, IIED’s director of climate resilience, finance and loss and damage, described some of the stories from workers about their experiences of extreme heat as “genuinely horrifying”.
Kusum, a tailor at a garment manufacturing and export unit in Kapashera, Delhi, recounted how the machines for ironing finished garments are in the same tiny room where workers are making the clothes, with steam and hot air building up through her shift.
Fans are too far apart to move the air and nothing has changed in over a decade, she said, adding that “in summer, the unit feels like a furnace”.
“These are Victorian-era working conditions and they’re completely unacceptable in the 21st century,” said Bharadwaj. She called for stepped-up social protection from the government to pay people for days they are unable work due to heat, as well as micro-insurance schemes with payouts triggered by temperature measurements.
This money would help families buy food and pay medical bills when their income dips if they fall ill or cannot work their usual hours due to soaring temperatures.
Climate change-driven heatwaves hit Delhi’s Red Fort market traders
The aim of the IIED study, Bharadwaj added, is to get policy-makers’ attention by showing the scale of damage extreme heat is doing to India’s GDP in an economy whose growth relies on service-led industries. “If the workers within them start falling sick, you know it’s the economic growth which is going to get impacted,” she told a webinar to present the research.
“Whether [policymakers] care about the workers or not, at least they would care about the GDP, and therefore then invest in their care,” she explained.
Labour code leaves out heat
However, Bharadwaj noted that a 2026 reform to India’s labour law bringing a range of regulations together in one code does not include heat-related protections for workers and only applies to businesses above a certain size. She urged the government to introduce a temperature threshold above which all workers would be able to stop their activities.
IIED and its partners have also carried out a similar study in Bangladesh which will be published later this month, showing that extreme heat is costing its workforce the equivalent of nearly 1.4% of GDP.
Shakirul Islam, chairperson of the Ovibashi Karmi Unnayan Program (OKUP) in Bangladesh, said the government had introduced stricter safety policies for garment-making companies after the Rana Plaza complex collapsed in 2013. But, he said, these rules are rarely followed by manufacturers, especially at the level of smaller subcontractors.
The workers’ welfare centres that do exist are open mainly during work hours so they are difficult to visit. Some companies also make saline water available for heat stress, which is no good for those with high blood pressure, he noted.
For Indian women workers, a just transition means surviving climate impacts with dignity
Archana Shukla Mukherjee, CEO of India’s Change Alliance, which also partnered with IIED on the survey, said it was time to hold both the government and businesses accountable for finding solutions to the intensifying problem of extreme heat’s effects on workers.
She said that employee state insurance schemes should identify heat stroke as an occupational disease while companies along the whole supply chain should start putting in place heat protection measures, including for informal workers and migrants.
If the tools and mechanisms available to help workers do not reach the most vulnerable and marginalised people, “then I think we are not doing something right,” she said.
The post Extreme heat costing India’s poorest workers 2% of GDP, survey finds appeared first on Climate Home News.
Extreme heat costing India’s poorest workers 2% of GDP, survey finds
A United Nations investigation into deep-sea mining firms will continue after the world’s top maritime court rejected their bid to suspend the inquiry triggered by a US-backed push to extract critical minerals from the ocean floor.
In two orders issued on Saturday, the International Tribunal for the Law of the Sea (ITLOS) declined to halt an inquiry launched by the International Seabed Authority (ISA) into whether permit holders, including Tonga Offshore Mining Ltd (TOML) and Nauru Ocean Resources Inc (NORI), have breached their obligations under UN exploration contracts.
The two companies are subsidiaries of Canadian firm The Metals Company (TMC), which earlier this year sought permits from the United States to commercially mine the deep seabed in an area already covered by its UN exploration licences, bypassing the ISA’s regulatory process.
The inquiry was opened after TMC’s move raised questions over whether its subsidiaries had complied with their contractual obligations to the ISA, which regulates mining in international waters under the UN Convention on the Law of the Sea. TOML and NORI sued the ISA last June for allegedly targeting them “in breach of due process” and without “good faith”.
-
UN seabed regulator defends authority as mining firms seek to halt inquiry
Campaigners accused deep-sea mining frontrunner The Metals Company of obstructing an inquiry into its subsidiaries. The firm says it is being targeted without procedural basis -
Flood deaths in West African cities raise fraught issue of slum evictions
Deadly floods expose poor urban planning, over-population and spread of informal settlements on disaster-prone land – a problem authorities are struggling to manage -
Most “zombie credits” locked out of new UN carbon market after China and India snub
Fears of a flood of environmentally-dubious carbon credits have faded, with most old projects not able to transition to new UN market


While allowing the inquiry to proceed, the court ordered the ISA to ensure the companies receive due process. Judges said the regulator must explain the factual and legal basis of its inquiry, clarify the procedures being followed and provide TOML and NORI with a meaningful opportunity to respond.
The companies seeks to mine an area called the Clarion-Clipperton Zone, which holds vast reserves of critical minerals like nickel, manganese and rare earths but is also home to a little-studied deep ocean ecosystem with thousands of unnamed species.
In response to the court’s ruling, the ISA welcomed the decision, saying the inquiry “remains in effect” and would continue “with due regard to all applicable legal requirements”.
Last week, during an annual meeting of its member governments, ISA secretary-general Leticia Carvalho said the resources in the ocean floor are “the common heritage of humankind” and upheld the agency’s role as “more important than ever”.
TMC also welcomed the court decision in a statement and claimed that judges ruled to “protect the rights of TMC subsidiaries”.
“Contractors like NORI and TOML, who have together spent hundreds of millions of dollars on the promise of a fair regulatory framework, should be informed of the factual and legal basis of any non-compliance inquiries, understand the procedure being applied, and receive a meaningful opportunity to respond,” said Gerard Barron, CEO of The Metals Company.

Environmental groups said the ruling allows scrutiny of the companies’ actions to continue.
Louisa Casson, deep-sea mining campaigner with Greenpeace, said the “entire litigation has been an egregious waste of time and money”, which was part of the industry’s “textbook distraction tactic” meant to delay the consequences of the inquiry.
“If the inquiry confirms that TMC’s subsidiaries are breaching their contracts, governments must send the strongest possible signal that complicity in unlawful deep sea mining will not be tolerated,” she said.
While investigation is still ongoing, NORI’s contract is set to expire this week and is up for review. Governments asked the ISA to report back and make “make appropriate recommendations” by the next ISA assembly, its main decision-making body set to take place next week from July 27 to 31.
The court ordered both the ISA and TMC to submit a report on how they complied with the ruling by August 31, and called on both to “cooperate and refrain from any action that might lead to
aggravating the dispute”.
The post Top maritime court rejects bid to halt UN deep-sea mining inquiry appeared first on Climate Home News.
Top maritime court rejects bid to halt UN deep-sea mining inquiry


-
Climate Change11 months ago
Guest post: Why China is still building new coal – and when it might stop
-
Greenhouse Gases11 months ago
Guest post: Why China is still building new coal – and when it might stop
-

 Greenhouse Gases2 years ago
嘉宾来稿:满足中国增长的用电需求 光伏加储能“比新建煤电更实惠”
-

 Climate Change2 years ago
嘉宾来稿:满足中国增长的用电需求 光伏加储能“比新建煤电更实惠”
-
Climate Change2 years ago
Bill Discounting Climate Change in Florida’s Energy Policy Awaits DeSantis’ Approval
-

 Renewable Energy9 months ago
Sending Progressive Philanthropist George Soros to Prison?
-

 Carbon Footprint2 years ago
US SEC’s Climate Disclosure Rules Spur Renewed Interest in Carbon Credits
-
Greenhouse Gases1 year ago
嘉宾来稿:探究火山喷发如何影响气候预测