
Anton and I have just brought CTD cast number 45 to light. While we are once again shaking freshly tapped bottles with great enthusiasm, I think I can make out question marks in Jamileh’s expression as she smiles good morning to us. That’s what everyone here seems to be thinking: 45 CTD casts already? And many of them in the same place? Why all this? We should know the water once we’ve “measured” it, right? Well, somehow we do.

“Our” CTD, which biologists prefer to call a “water sampler”, is moved out of the side of the hangar, lowered and in the basic version measures Conductivity (salinity), Temperature and pressure (Depth) quasi continuously (at 24 Hz), ideally down to the seafloor. In addition, oxygen and fluorescence are measured, which makes it possible to estimate biological productivity (see previous blog entries by Nicole and Manfred). As an addition, water samples can be taken at various depths using the 24 Niskin bottles (Manfred is by far our best customer in this respect). For oceanographers, however, the continuous measurements of temperature and salinity are of crucial importance, as they allow us to see how stable the water is stratified, for example, or to deduce the origin of the water masses and geostrophic currents. This is important information that forms the framework conditions that strongly influence the local ecosystem. In order to achieve maximum precision in the physical measurements, I take water samples myself “only” to calibrate the oxygen and salinity sensors later, but not to analyze the suspicious living beings in it.

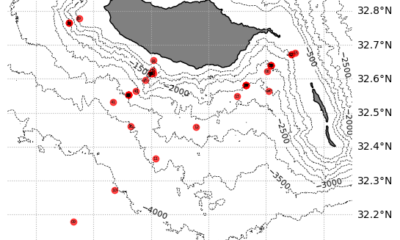
Most of the deployments to date have been close to shore at a depth of about 1500 meters. The following figure shows one of our precious deeper profiles down to a depth of almost 3300 meters. Here, the top 100 meters form the so-called “mixed layer”, in which all measured variables are well mixed by the wind. We observe that the depth of this surface layer varies, but is generally comparatively thick – as is typical for the winter months at these latitudes. At our first station, the mixed layer depth was even around 200m! Temperature (red), salt (blue), oxygen (yellow) and chlorophyll (green) draw practically vertical lines in the diagram. Interestingly, a maximum of chlorophyll often forms exactly at or below the surface layer, which serves as an indicator for the presence of phytoplankton (see Nicole’s and Manfred’s blog entry on “Micro-Creatures”). Although phytoplankton is basically autotrophic, i.e. dependent on sunlight, it can survive in this rather deep layer with very little sunlight. One reason for this is the increased nutrient content in deeper layers.

In addition, the pycnocline directly below the mixed layer forms a strong physical barrier to vertical mixing and can practically “trap” organisms that cannot actively swim themselves. The pycnocline is the layer in which the density of the water increases very rapidly with depth (here due to the temperature gradient). These layers contain a wide range of temperature and salt contents and are also called Central Waters. To identify water masses, temperatures and salinities are plotted against each other in a so-called “T-S diagram” (as shown in Figure 4). In our example, you can clearly see that the water around Madeira consists largely of Eastern North Atlantic Central Water (ENACW). This water mass dominates the pycnocline in the large North Atlantic Gyre and is significantly more saline than in the South Atlantic (see Eastern South Atlantic Central Water). In our profile number 41 (Figure 3), however, something else catches the eye. At around 1100m, there is a nose with a significantly higher salinity, which does not seem to match the linear Central Water. The influence of the Mediterranean Water (MW) is noticeable here, which has a particularly high salt content due to the predominantly high evaporation and low precipitation in the Mediterranean region.
Due to this high salt content, it manifests itself at greater depths, typically around 1100m to 1200m, despite the warm temperatures. However, we can also see in the T-S diagram that the Mediterranean water in the south of Madeira is already somewhat more mixed, i.e. less warm and saline than directly at the outflow of the Mediterranean. Even further down, which we can observe particularly well at our deeper CTD stations around 3000m, resides the famous North Atlantic Deep Water (NADW). This is formed by, for instance, deep convection in the North Atlantic and plays a central role in global thermohaline circulation and climate dynamics. Although constituting deep water, it is comparatively “young” and therefore rich in oxygen (we like to say “well ventilated”) and forms a contrast to the oxygen minimum, which we observe here around Madeira at around 800-900 meters. This minimum zone is formed by respiration of the sunken organic material, e.g. from the sunlight-dependent phytoplankton in the uppermost ~150 meters. Compared to the large known oxygen minimum zones in the subtropical eastern Atlantic and Pacific, however, there is still comparatively abundant oxygen.

Now, we know the profile of a single CTD station a little better. Basically, this one is actually fairly representative of the other 44, so the question of why Anton and I keep “driving CTDs” like madmen remains unanswered. However, if we take a closer look, we can see that the temperature and salinity profiles are not completely “smooth”. In fact, we discover small wavelike deviations. Measurement inaccuracies? No. It is internal waves that bring “life” to the profiles. Internal waves can occur in any stratified medium, i.e. fluids in which the density is not constant. There are two restoring forces that act on internal waves in the ocean: Gravity and the Coriolis force. The main drivers of internal waves are the tides (such as ebb and flow), closely followed by wind. We know that internal waves play a crucial role in energy transport in the ocean. Like ordinary surface waves, internal waves can also break. When they do, mixing takes place. This in turn can transport nutrients and thereby influence biological productivity. The interaction of internal waves with topography (i.e. islands such as Madeira) and currents is very complex and not yet fully understood. By using a large number of stations at different times (and tidal stages), we obtain a better spatial and temporal resolution of the internal wave field and improve our understanding. That’s also why we are fans of so-called “yo-yo CTDs”. Just like a real yo-yo, we move the CTD up and down several times in direct succession at one and the same location.

In the figure above, we have plotted six directly consecutive profiles of a “CTD yo-yo” on top of each other. You can see that the profiles deviate more from each other at some depths and not at others (nodal points). The most impressive influence is exerted by internal waves on the mixed layer depth, which can vary by several tens of meters within minutes.
There is a particular thrill when the “Eddy hunt” is called for. That sounds more martial than it is meant to be. Eddies are oceanic vortices that reach a diameter of about 50 km around Madeira, interact with topography (islands) and internal waves and are known to have an impact on biodiversity. They develop over a period of days/weeks and are unfortunately hardly predictable. Therefore, we check satellite and model data for the region daily to identify a possible feature and, if possible, sample in situ with Merian. Strong eddies can generate a signal in sea level, surface temperatures and chlorophyll, recognizable via satellites. Our colleagues from the Oceanographic Institute of Madeira are helping us on site by providing the regional satellite and model data (see https://oomdata.arditi.pt/msm126/). Overall, it is impressive how well the collaboration on board and beyond works! One “eddy hunt” has already taken place on the night of February 13-14. However, the satellite signal was weak, and accordingly we were unable to detect a strong, coherent eddy In Situ with our shipboard ADCP (Acoustic Doppler Current Profiler, which measures ocean currents down to a depth of almost 1000m). (Side note: However, another exciting feature (presumably a strong internal wave) was identified in the surface layer, which we are now analyzing.)

In one of the following contributions, we want to prove to you that our beloved CTD is something very special in purely “objective” terms thanks to sophisticated tuning, including high-resolution camera systems. Then we’ll explain why Anton, although he’s not a physical oceanographer, also likes to drive “CTD yo-yos” and there will finally be photos of aquatic animals again!
Greetings from on board RV MARIA S. MERIAN,
Marco Schulz und Anton Theileis

By Leonie Jaeger (ICBM Oldenburg)
The ocean is the dominant climate regulator of our Earth. I am on board the RV Meteor to conduct measurements that helps us better understand the critical processes at the interface between the atmosphere and the ocean. The focus of these measurements is heat and freshwater fluxes, two key drivers that both influence and regulate Earth’s climate.
The ocean stores and transports vast amounts of heat across the whole globe. The exchange of heat between the atmosphere and the ocean is controlled by different surface heat fluxes. The sun emits shortwave radiation, which warms the surface ocean, though part of this radiation is reflected at the water surface. At the same time, the ocean emits longwave radiation towards the sky due to its temperature, some of which is reflected and absorbed by water vapor and clouds. To quantify these fluxes, I use radiometers: sets of upward- and downward-looking sensors that measure radiation coming from the sky and from the ocean. Specifically, pyranometers measure shortwave radiation, while pyrgeometers measure longwave radiation.
Over the open ocean, freshwater fluxes result from two processes: evaporation and precipitation. Approximately 80% of the global freshwater flux occurs over the ocean, underscoring the ocean’s dominance in the global water cycle and its influence on climate over land. In a warming climate, evaporation is expected to intensify as temperatures rise and the atmosphere’s capacity to hold moisture increases. That makes is very important to better understand these fluxes. However, high-quality measurements of precipitation and evaporation using remote techniques remain challenging. On this cruise, I am using a disdrometer, an instrument that measures rain in high resolution. It allows us to investigate not only the total amount of rain but also the velocity and size of individual raindrops, enabling a detailed characterization of rain events.
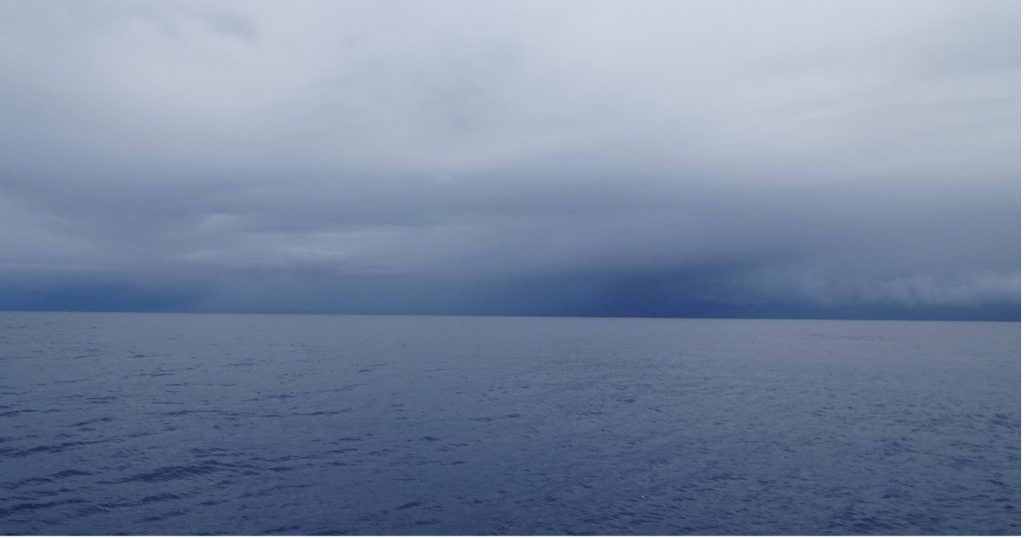
Our cruise track crosses the Atlantic Ocean from South to North, passing the equator. This transect will provide a valuable dataset. Importantly, we will cross the Inter-Tropical Convergence Zone (ITCZ), a region near the equator characterized by heavy rain and thunderstorms. These storms originate from warm, moist air that rises continuously. As the air rises, it cools and condenses, forming thick clouds and intense precipitation. Because the ITCZ is driven by the convergence of trade winds from both hemispheres, it maintains persistent bands of convection. In this zone, these convective systems can trigger even more convection in the atmosphere driving the tropical climate. Together with warm surface temperatures, these high-energy processes can lead to the genesis of tropical cyclones. Thus, the atmosphere influences the ocean, and the ocean influences the atmosphere. Direct measurements at their interface are essential to better understand these processes shaping our climate. My responsibilities include installing and maintaining the measurements systems, as well as data validation and data storage. Maintaining sensors close to the ocean requires frequent cleaning, because sea spray leaves salt deposits everywhere, leading to corrosion. Together with ship-based measurements such as air temperature, wind speed and humidity, and oceanographic underway measurements including continuous observation of the water temperature, salinity, turbidity and chlorophyll, our data will provide a comprehensive dataset to study fresh and heat water fluxes between the ocean and the atmosphere.
Welcome to the M219 ocean blog!
Here, we will share updates and stories about the scientific work taking place during this research expedition. We also hope to offer a glimpse into daily life and work at sea.
For many members of the scientific party, this is their first time aboard METEOR. It will also be their last, as METEOR is embarking on its final voyage before retiring from service as a German research vessel after more than 40 years at sea. Over the course of its distinguished career, METEOR has travelled more than 1.7 million nautical miles, which is equivalent to more than 8 times the distance between the Earth and the Moon. Throughout those decades the vessel has supported countless scientific discoveries and generations of marine scientists. We are very grateful and honored to be part of the final chapter of this remarkable ship’s history and to accompany her on the last few thousand miles of her legendary journey.
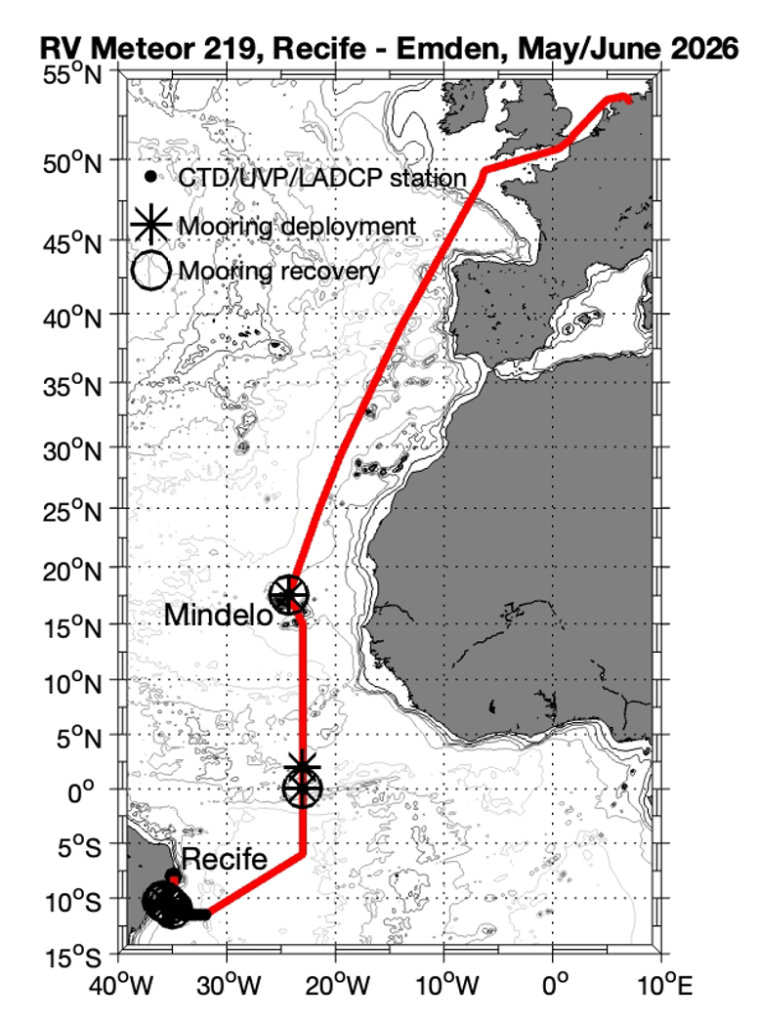
The scientific program of this cruise focuses on long-term observations of ocean currents off the coast of Brazil and at the equator, as well as interdisciplinary measurements near the Cape Verde Islands. At all these sites, GEOMAR has maintained observational programs for the past 10 to 20 years. Over the next four weeks, we will introduce these regions and the measurements carried out there in more detail. But first, let’s look at what happened in Brazil before the cruise began.
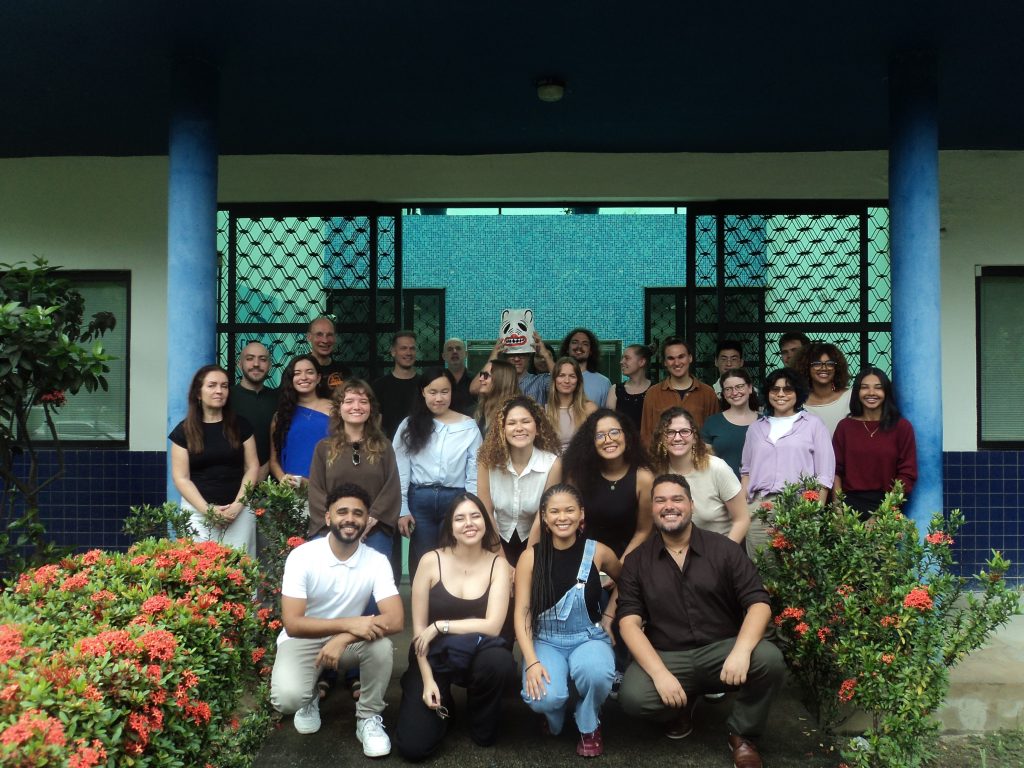
On Thursday, May 28, many of the scientists and students left the hotel early in the morning to attend a seminar at the Universidade Federal de Pernambuco (UFPE), celebrating the long-standing scientific collaboration between Brazil and Germany.
The seminar was opened by Prof. Dr. Marius Müller, a former student at GEOMAR and now a professor for biological oceanography at UFPE. These meetings have become a valued tradition, having been organized for more than 20 years by now. This year marked the 9th edition of the seminar since its inception over 20 years ago.
A total of 8 scientists and students from Brazil, Germany, and the U.S. presented their research on various aspects of the tropical Atlantic Ocean. We would like to thank Marius Müller, Doris Veleda and all the Brazilian scientists and students who helped organize the seminar and provided such a warm welcome. We greatly enjoyed the exchange of ideas and look forward to celebrating the 10th seminar in the years to come.
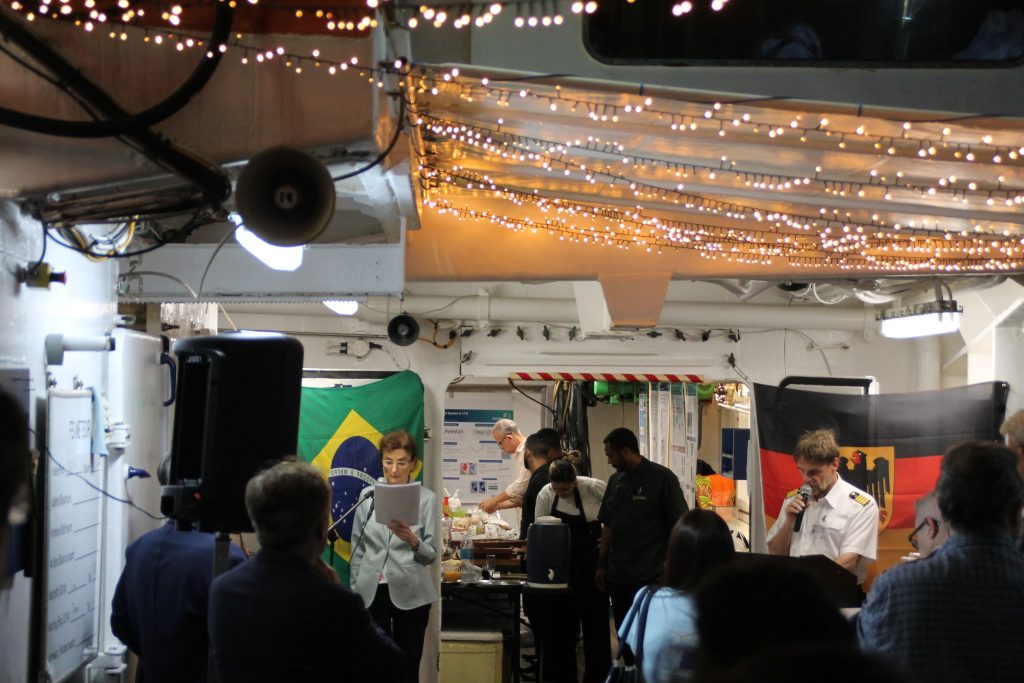
After the seminar we returned to the hotel, but there was little time to rest. Later that same day, the captain of METEOR and the German Consul General in Recife hosted a reception aboard METEOR in the Port of Recife.
The event brought together members of the scientific party, representatives of local institutions, and guests from the Brazilian and German scientific communities. It provided an excellent opportunity to celebrate the long-standing partnership between the two countries.
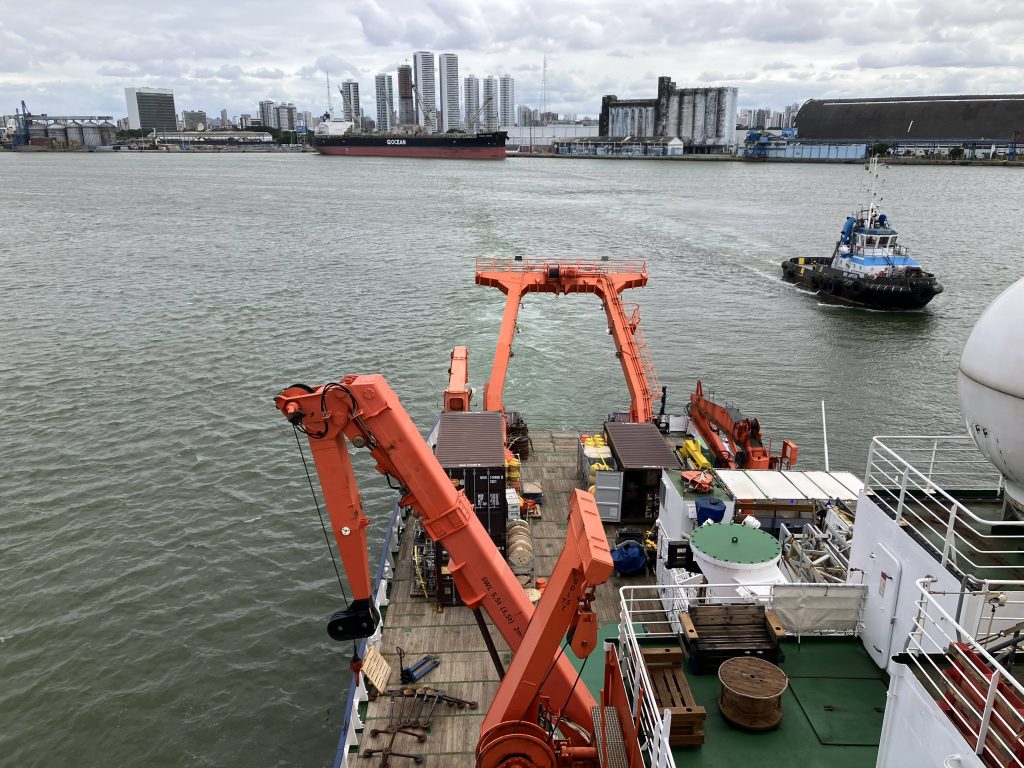
On Friday, May 29, the scientific party finally boarded METEOR. There was little time to settle into our cabins and workspaces, as preparations for departure were already in full swing. We left the Port of Recife as soon as possible and at around 1pm METEOR set sail and began the final voyage of her remarkable career.
About 12 hours after leaving port, we arrived at our first station. Thanks to the dedicated efforts of technical and scientific teams, all instruments had been installed and prepared in time for the start of operations. This station marked the beginning of our observational program off the coast of Brazil, which includes the deployment and recovery of tall moorings as well as CTD measurements. An intensive first week lies ahead, with a demanding schedule of measurements and mooring operations. After months of planning and preparation, everyone is excited to finally begin the scientific work and make the most of the final weeks aboard METEOR.
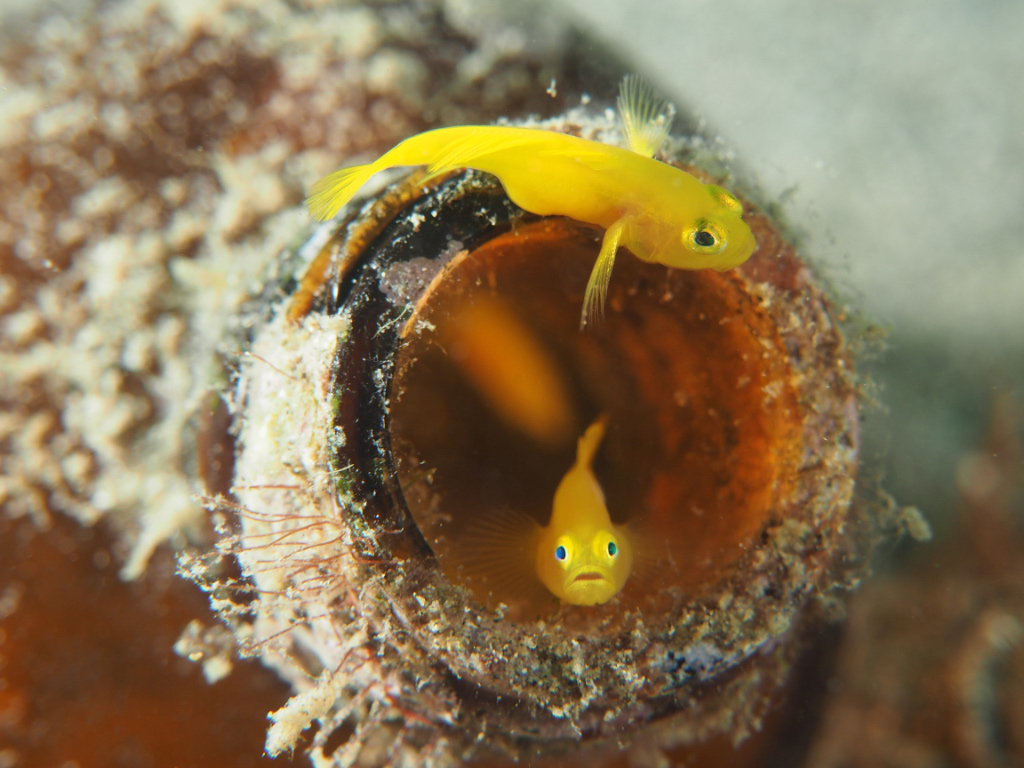
There are more than 2,000 species of gobies (Gobiidae) known to science today, making them the largest family of fish in the ocean. But these small creatures are far more complex and essential to marine ecosystems than first meets the eye. Found all around the world in brackish, fresh and salt water in tropical and subtropical regions, they are an astonishingly diverse group of fish with several curious characteristics that set them apart.
Most gobies are quite small and don’t usually measure more than six inches long. Measuring just about eight millimeters long, the dwarf pygmy goby (Trimmatom nanus) is not only the tiniest goby known to science but also one of the smallest of all fish species in the world.
Primarily bottom-dwellers, gobies are known to be excellent foragers and have evolved expert burrowing behaviors over time. As they sift around looking for food like copepods, seaworms and tiny crustaceans, their movement helps to aerate sediment and keep algae in check. Some are even known to be “cleaner fish,” snacking on parasites they remove off larger creatures. It’s like a spa day for the animal being cleaned and a choose-your-own-adventure buffet for the gobies. Studies also show that cleaner goby activity is largely tied to the microbial health of coral reefs, showcasing that even the tiniest of species are essential to functioning marine ecosystems.
Gobies have some unique aspects to their anatomy, too. First, their fused pelvic fins are designed to help them form a strong suction cup to perch on coral reefs, rocks and other ocean terrain amidst turbulent currents. Some freshwater species are even known to use this suction to climb waterfalls. It may come as no surprise then that gobies are cousins to mudskippers, animals known to “walk” through mud. There are more species-specific features that set certain gobies apart. From the use of bioluminescence to symbiotic relationships with shrimp, the adaptations within the goby family are truly wide-ranging. Some species have even been found to use marine terrain memorization to navigate back to the tide pools where they were born. Isn’t nature mind-blowing sometimes?
Get Ocean Updates in Your Inbox
Sign up with your email and never miss an update.
Gobies have equally complex and varied behaviors. Male gobies are infamous for being territorial protectors of their nests. Many larger males are known as “guarders;” these hopeful fish make careful nests to attract a mate, and once fertilization occurs, guarders will remain diligently near the nests to keep eggs safe. However, there’s another type of male goby that complicates this dynamic. These other males are known as “sneaker gobies” and are called that for one reason: They’re sneaky! If guarder gobies aren’t careful, sneakers can creep into the nest, fertilize some of the eggs and quickly escape. As if on an underwater episode of Maury, guarder males who aren’t careful could end up unknowingly babysitting little gobies that aren’t their actual offspring.
Gobies serve as indicators of ecological health and are essential to keeping delicate food webs in check. Unfortunately, many changes in our ocean threaten their ability to survive and thrive today. Coral bleaching and degradation endanger the health of one of their key habitats, and a combination of warming waters and coastal development can make it difficult for both juvenile and adult gobies to survive and thrive.
Healthy gobies mean a healthy ocean. Their essential role in marine ecosystems demonstrates that even the tiniest creatures play a major role in helping hold together the beautiful yet fragile habitats that make up our beloved ocean. Visit Ocean Conservancy’s Action Center and join the movement to protect our blue planet today and for years to come—from the tiniest goby to the largest whales, our ocean is counting on us.
The post All About Gobies appeared first on Ocean Conservancy.


-
Climate Change10 months ago
Guest post: Why China is still building new coal – and when it might stop
-
Greenhouse Gases10 months ago
Guest post: Why China is still building new coal – and when it might stop
-

 Greenhouse Gases2 years ago
嘉宾来稿:满足中国增长的用电需求 光伏加储能“比新建煤电更实惠”
-

 Climate Change2 years ago
嘉宾来稿:满足中国增长的用电需求 光伏加储能“比新建煤电更实惠”
-
Climate Change2 years ago
Bill Discounting Climate Change in Florida’s Energy Policy Awaits DeSantis’ Approval
-

 Renewable Energy8 months ago
Sending Progressive Philanthropist George Soros to Prison?
-

 Carbon Footprint2 years ago
US SEC’s Climate Disclosure Rules Spur Renewed Interest in Carbon Credits
-
Greenhouse Gases11 months ago
嘉宾来稿:探究火山喷发如何影响气候预测