
Methane, a potent greenhouse gas, is responsible for about 30% of the global temperature increase observed since the industrial revolution.
China accounts for more than 10% of annual global human methane emissions, in large part due to unintended releases – known as “fugitive” emissions – from its energy sector.
In a recently published study, we take a closer look at China’s coal-mine methane (CMM) emissions, which account for roughly 40% of the nation’s total methane emissions.
Leveraging newly collected, mine-specific data, we develop granular estimates of CMM emissions in China since 2000.
These estimates reveal that China’s coal production is shifting towards provinces with lower-emission mines.
In addition, there has been a significant increase in the capturing of methane from coal mines for energy use.
Together, these developments have helped to limit the rise of CMM emissions, despite an overall increase in coal production since 2016.
Mine data
To estimate CMM emissions at a granular level, we needed to understand how emissions vary from one mine to the next across China.
To do this, we made use of existing safety regulations in China. As methane is a highly flammable gas, the Chinese government enforces mandatory methane gas level identification in coal mines and implements safety regulations accordingly.
Coal mines are categorised based on their “methane emission factors”, the volume of methane emitted per tonne of coal produced.
At one end are low-gas mines, with an emissions factor of less than 10 cubic metres (m3) of methane emitted per tonne of coal. At the other are high-gas mines, at more than 10m3 of methane emitted per tonne. Beyond this are “outburst” mines, which are those that have experienced coal seam or gas outburst incidents.
To get a clearer sense of how much low-gas, high-gas and outburst mines emit in practice, we built a model of the relationship between gas levels and emission factors, using a 2011 database of all Chinese coal mines.
This database includes information on methane gas levels, mine-specific emission factors, coalbed depth, mine ownership and production capacity. We further validated this relationship with newly collected coal mine data from 2023, published by Chinese local governments.
The results show that the distribution of emission factors, as shown in the figure below, varies significantly with gas level.
The top row in the figure below shows the emissions factors for a range of mines in 2011 classed as low-gas (top left, green), high-gas (top centre, pink) or outburst (top right, red). The dashed vertical lines show the central estimate for each type, ranging from 4.1m3 per tonne for low-gas mines through to 19.9m3/tonne for high-gas and 28.4m3/tonne for outburst mines.
The bottom row shows the same metrics based on the more recent 2023 data.
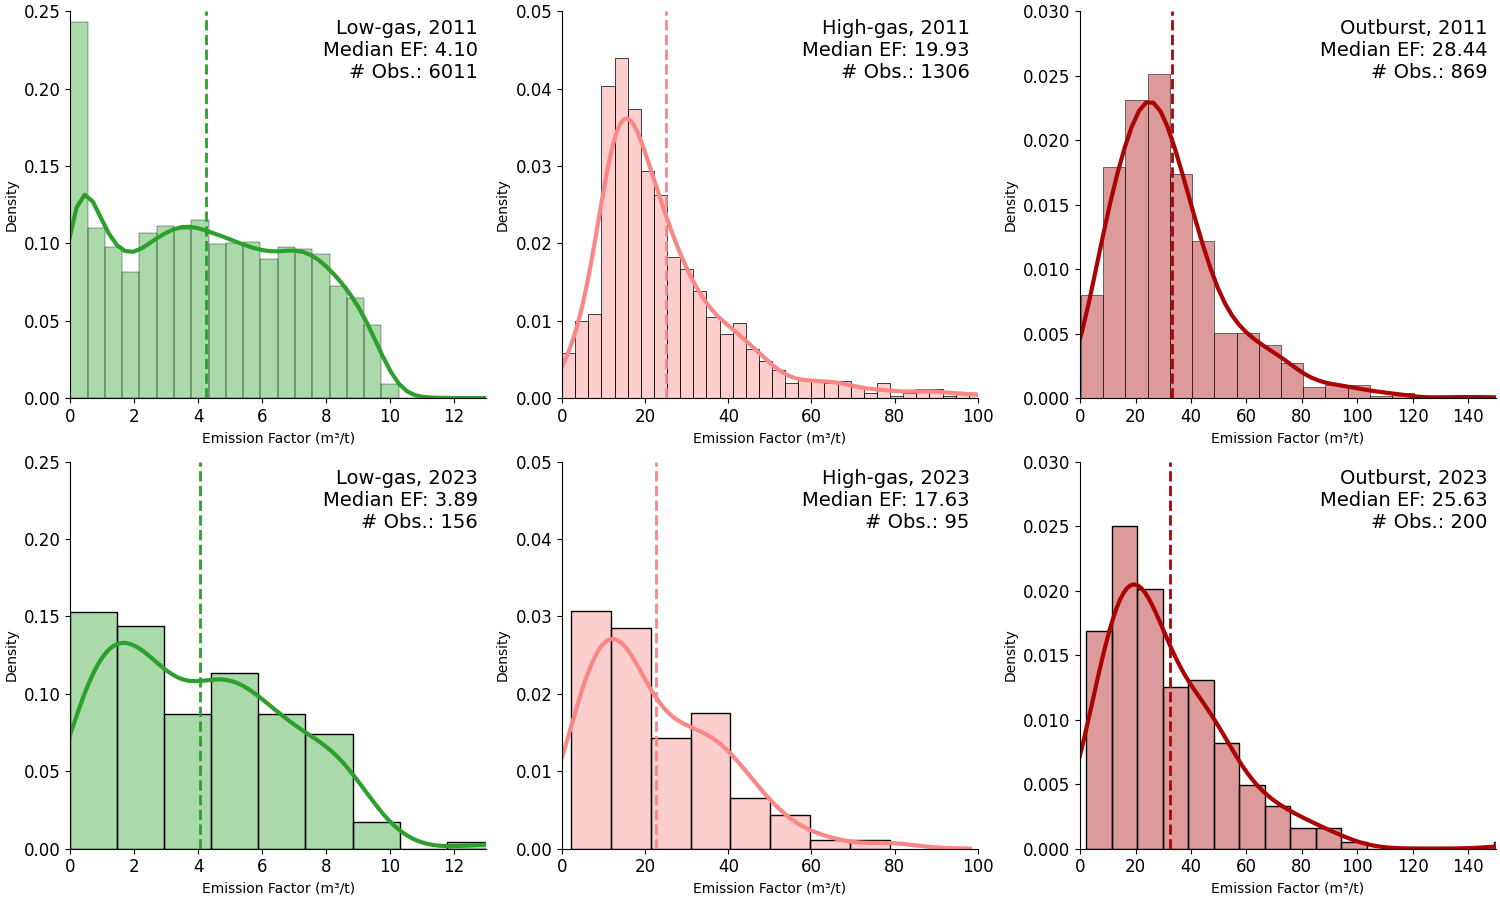
The strong correlation shown in the data above suggests that gas level is a crucial indicator of how much methane a coal mine emits.
In contrast, our analysis reveals no significant correlation between how much a coal mine emits and either coal mine depth or ownership.
Comparing the distributions for the same gas levels between 2011 and 2023 also shows that the link between gas levels and methane emissions remains fairly constant over time.
Therefore, the gas level of a mine can reliably serve as a proxy for its methane emissions per tonne of production, when direct measurements are unavailable.
Provincial shift
To estimate CMM emissions for each province in China, we assumed that the percentage of coal produced by mines of each gas level remains roughly constant as in 2011.
For instance, if 20% of Guizhou’s coal production in 2011 came from low-gas mines, we maintained this percentage for subsequent years.
We then calculated CMM emissions by multiplying provincial-level production-weighted emission factors by total coal production.
The line chart below illustrates our estimated CMM emissions since 2000.
The raw estimates, depicted by the lower grey dashed line, show a rapid increase in CMM emissions from approximately 5m tonnes in 2000 to nearly 21m tonnes in 2013.
This was followed by a decrease to 15m tonnes in 2016 and a subsequent rebound to 24m tonnes in 2023.
The decline between 2013 and 2016 aligns with a period of reduced coal production in China.
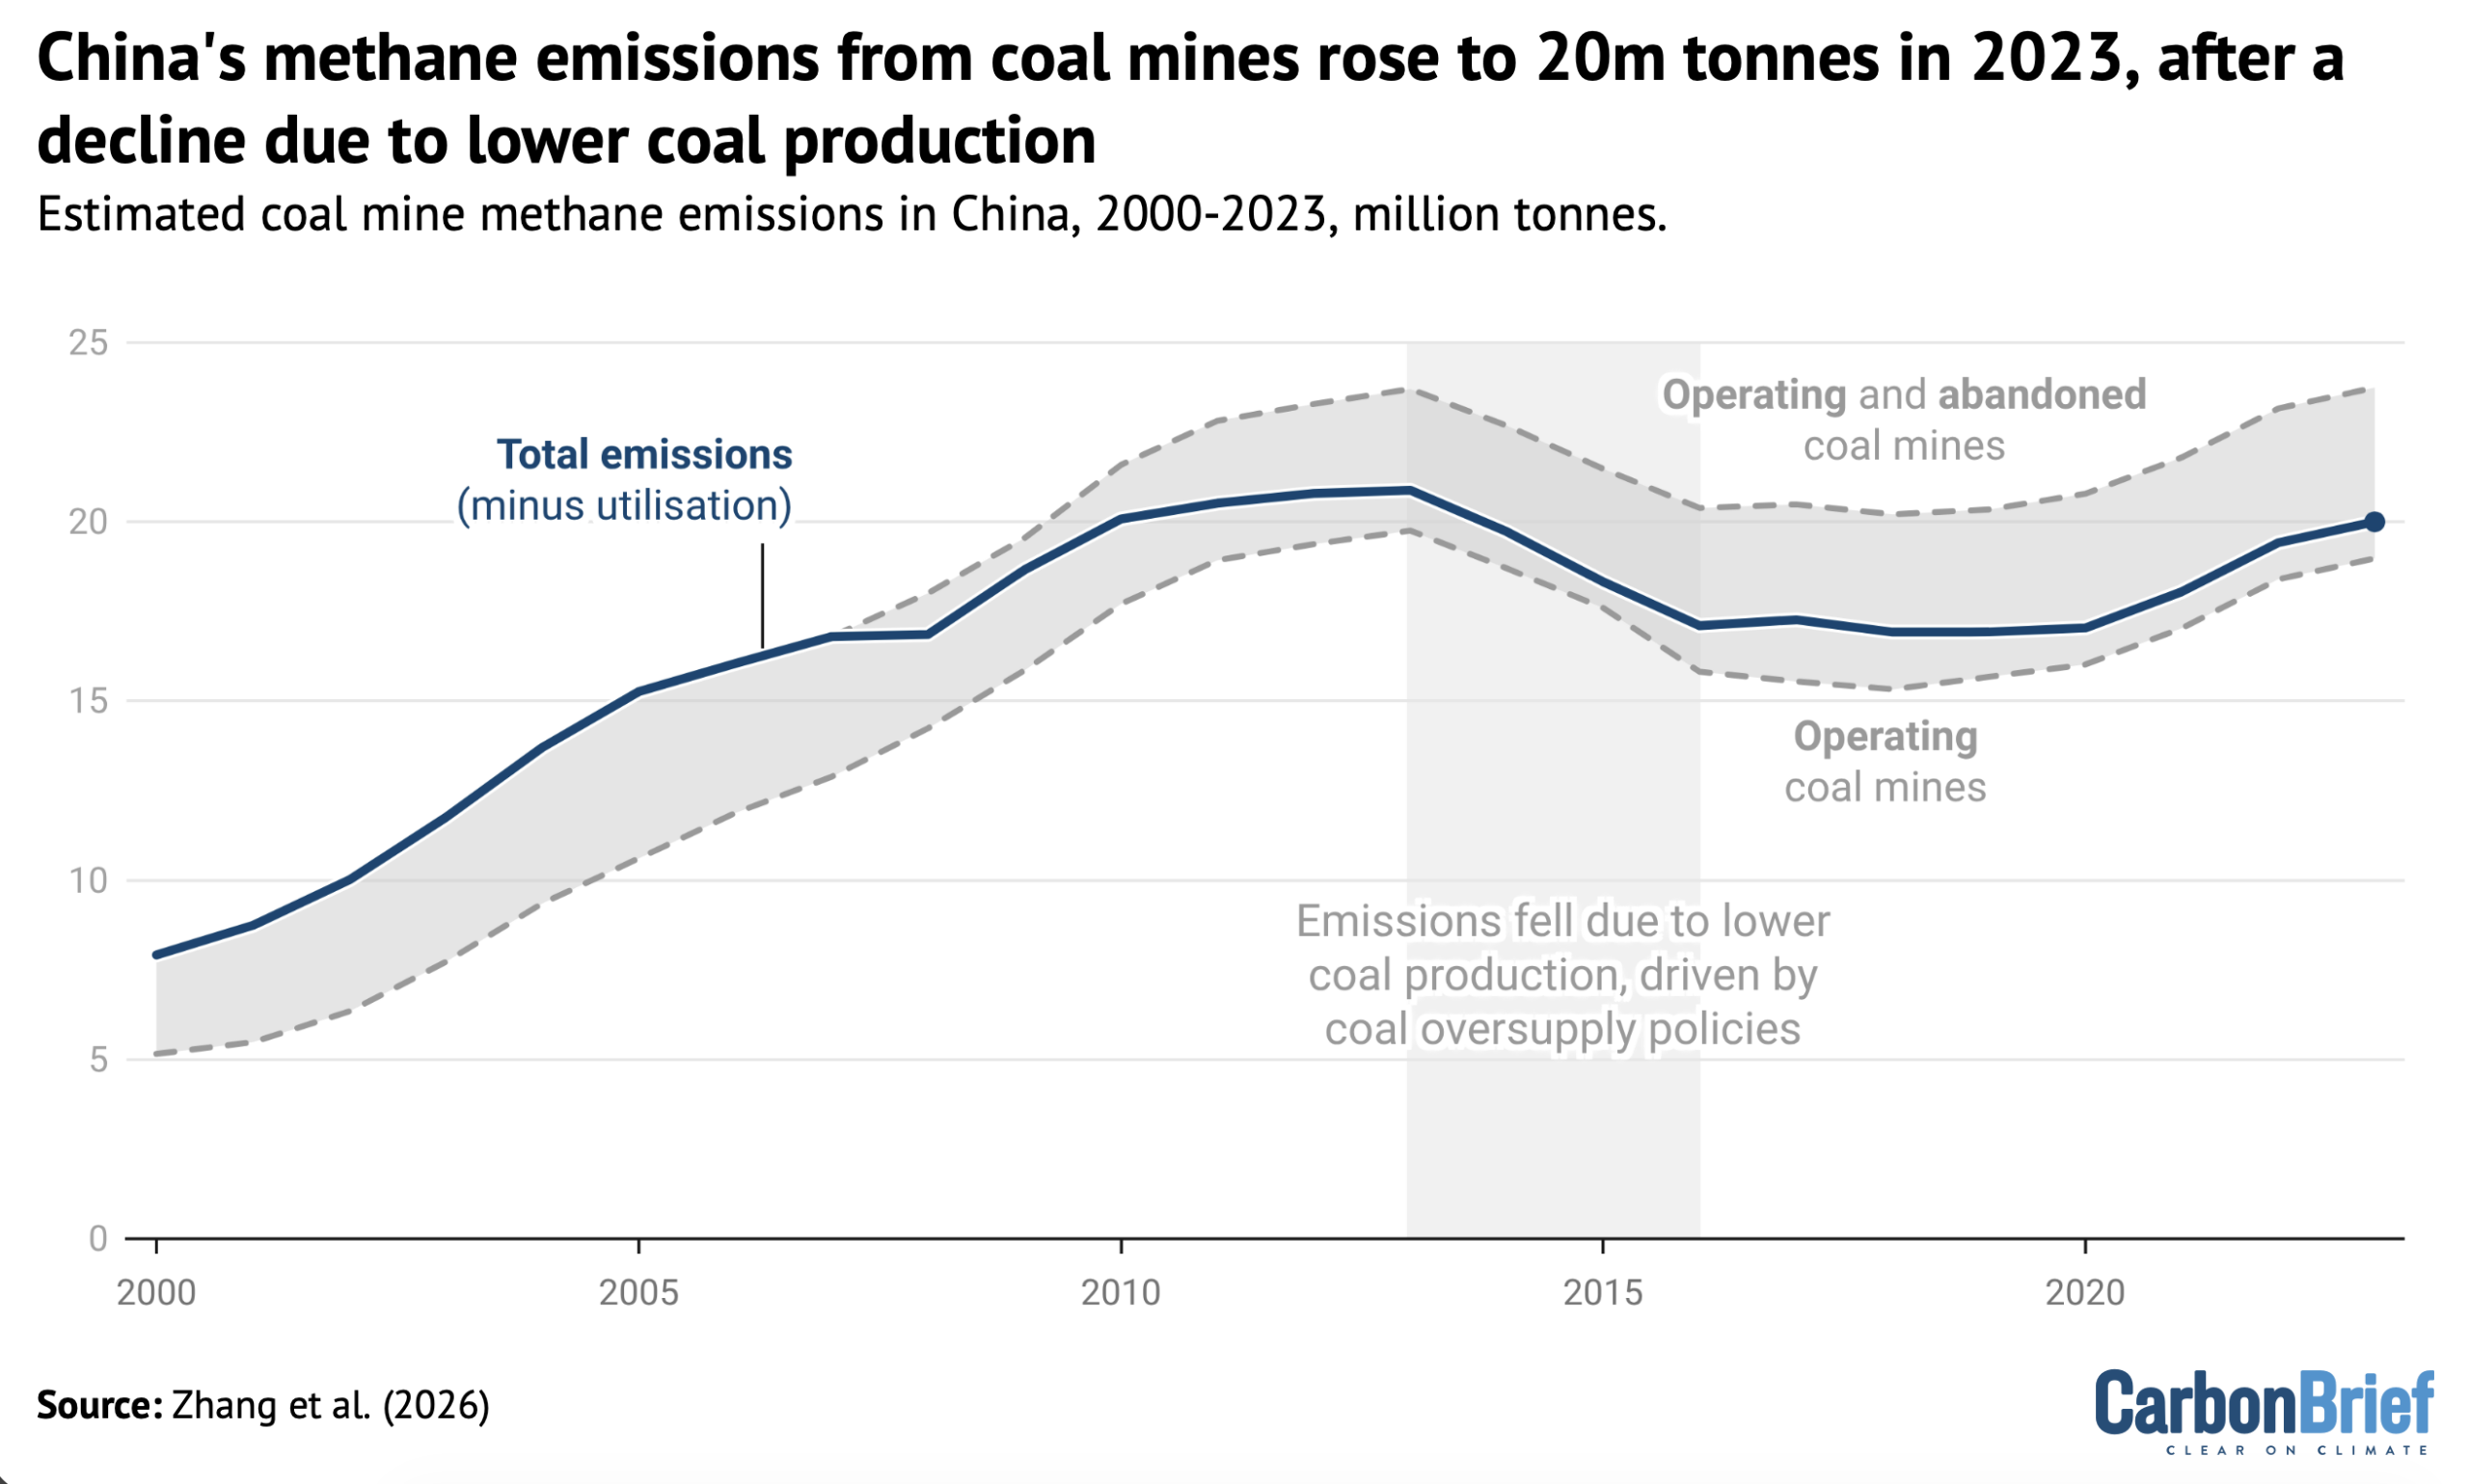
On the chart, the upper grey line represents CMM emissions when abandoned coal mines are included.
These mines, which continue to release methane long after operations cease, were responsible for 4.8m tonnes of methane emissions in 2020, contributing approximately 25% to the total CMM emissions.
Meanwhile, the blue line shows CMM emissions when the capture and use of methane in energy supply is taken into consideration.
National methane utilisation increased from 1.2m tonnes in 2008 to 3.7m tonnes in 2020, resulting in a reduction of total emissions by 5% and 17%, respectively.
It is noteworthy that CMM emissions did not immediately rebound after 2016, despite a reported increase in coal production by China’s National Bureau of Statistics.
This delay can likely be attributed to shifts in production locations to lower-emissions provinces, the closure of high-emissions mines and the adoption of technologies for capturing and using methane that effectively mitigate emissions.
The figure below compares CMM emissions across provinces in 2012 and 2021, two years with nearly identical total coal production levels.
Overall, changes in methane emissions closely mirrored shifts in where the coal was being mined. There is a clear geographic trend: production and emissions surged in northern and north-western regions such as Xinjiang, Shaanxi and especially Shanxi.
In fact, Shanxi alone emitted nearly 8m tonnes of coal-mine methane in 2021, making up roughly half of China’s total CMM emissions.
Meanwhile, both production and emissions dropped in south-western provinces, including Guizhou, Sichuan and Yunnan.
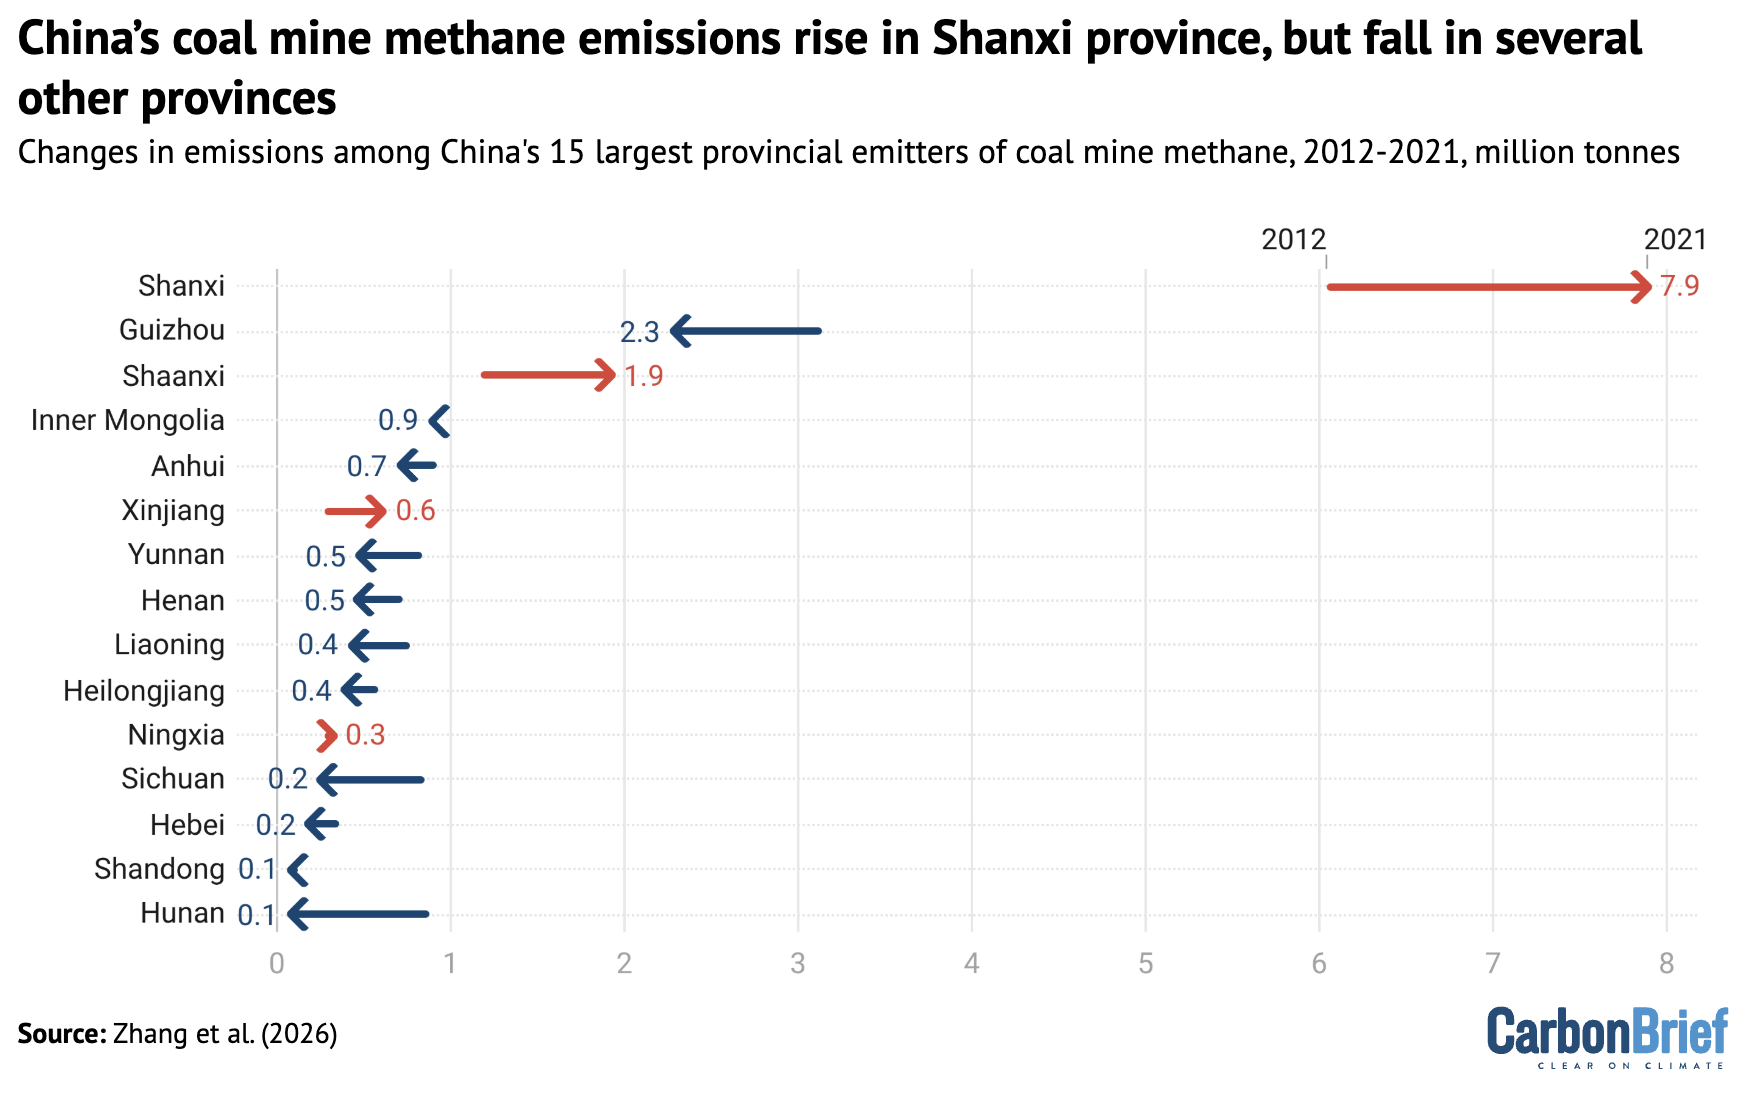
The figure shows that China’s coal production has switched from regions in the south-west where emissions per unit of coal production are relatively high, to lower-emission areas in the north and north-west. At the same time, total production levels have stayed similar, at just over 4bn tonnes in both 2012 and 2021.
Tackling methane
China has signalled its intention to address methane emissions, with key tasks for the next five years outlined in a national methane action plan published in 2023.
The broad trends of CMM emissions observed in this study will likely continue in China.
Small-scale coal mines – those producing less than 300,000 tonnes of coal per year – are at risk of closing or being consolidated, while increased production from large-scale, lower-emission mines in Xinjiang and Inner Mongolia will likely lead to an overall reduction in national production-weighted emission factors.
(This reduction in the rate of emissions per unit of coal production does not guarantee a reduction in methane emissions overall, as several analyses show this also depends on the total coal output. Even following closures, methane may still leak from abandoned mines.)
However, this regional shift in coal production – and, thus, methane emissions – could also help to address public health concerns from pollution associated with the gas.
The Chinese government has also introduced significant changes in policy on the capturing and use of methane gas. The Ministry of Ecology and Environment recently revised coal-mine methane standardsto mandate the capture and use of methane with concentrations above 8%, down from a previous 30%.
In addition, the government has a programme providing financial incentives for capturing methane and reducing CMM emissions.
Together, these measures could help China achieve its short- and medium-run methane capture and use goals set by the methane action plan.


The post Guest post: How changes to coal mining have affected China’s methane emissions appeared first on Carbon Brief.
Guest post: How changes to coal mining have affected China’s methane emissions
A United Nations investigation into deep-sea mining firms will continue after the world’s top maritime court rejected their bid to suspend the inquiry triggered by a US-backed push to extract critical minerals from the ocean floor.
In two orders issued on Saturday, the International Tribunal for the Law of the Sea (ITLOS) declined to halt an inquiry launched by the International Seabed Authority (ISA) into whether permit holders, including Tonga Offshore Mining Ltd (TOML) and Nauru Ocean Resources Inc (NORI), have breached their obligations under UN exploration contracts.
The two companies are subsidiaries of Canadian firm The Metals Company (TMC), which earlier this year sought permits from the United States to commercially mine the deep seabed in an area already covered by its UN exploration licences, bypassing the ISA’s regulatory process.
The inquiry was opened after TMC’s move raised questions over whether its subsidiaries had complied with their contractual obligations to the ISA, which regulates mining in international waters under the UN Convention on the Law of the Sea. TOML and NORI sued the ISA last June for allegedly targeting them “in breach of due process” and without “good faith”.
-
UN seabed regulator defends authority as mining firms seek to halt inquiry
Campaigners accused deep-sea mining frontrunner The Metals Company of obstructing an inquiry into its subsidiaries. The firm says it is being targeted without procedural basis -
Flood deaths in West African cities raise fraught issue of slum evictions
Deadly floods expose poor urban planning, over-population and spread of informal settlements on disaster-prone land – a problem authorities are struggling to manage -
Most “zombie credits” locked out of new UN carbon market after China and India snub
Fears of a flood of environmentally-dubious carbon credits have faded, with most old projects not able to transition to new UN market

While allowing the inquiry to proceed, the court ordered the ISA to ensure the companies receive due process. Judges said the regulator must explain the factual and legal basis of its inquiry, clarify the procedures being followed and provide TOML and NORI with a meaningful opportunity to respond.
The companies seeks to mine an area called the Clarion-Clipperton Zone, which holds vast reserves of critical minerals like nickel, manganese and rare earths but is also home to a little-studied deep ocean ecosystem with thousands of unnamed species.
In response to the court’s ruling, the ISA welcomed the decision, saying the inquiry “remains in effect” and would continue “with due regard to all applicable legal requirements”.
Last week, during an annual meeting of its member governments, ISA secretary-general Leticia Carvalho said the resources in the ocean floor are “the common heritage of humankind” and upheld the agency’s role as “more important than ever”.
TMC also welcomed the court decision in a statement and claimed that judges ruled to “protect the rights of TMC subsidiaries”.
“Contractors like NORI and TOML, who have together spent hundreds of millions of dollars on the promise of a fair regulatory framework, should be informed of the factual and legal basis of any non-compliance inquiries, understand the procedure being applied, and receive a meaningful opportunity to respond,” said Gerard Barron, CEO of The Metals Company.

Environmental groups said the ruling allows scrutiny of the companies’ actions to continue.
Louisa Casson, deep-sea mining campaigner with Greenpeace, said the “entire litigation has been an egregious waste of time and money”, which was part of the industry’s “textbook distraction tactic” meant to delay the consequences of the inquiry.
“If the inquiry confirms that TMC’s subsidiaries are breaching their contracts, governments must send the strongest possible signal that complicity in unlawful deep sea mining will not be tolerated,” she said.
While investigation is still ongoing, NORI’s contract is set to expire this week and is up for review. Governments asked the ISA to report back and make “make appropriate recommendations” by the next ISA assembly, its main decision-making body set to take place next week from July 27 to 31.
The court ordered both the ISA and TMC to submit a report on how they complied with the ruling by August 31, and called on both to “cooperate and refrain from any action that might lead to
aggravating the dispute”.
The post Top maritime court rejects bid to halt UN deep-sea mining inquiry appeared first on Climate Home News.
Top maritime court rejects bid to halt UN deep-sea mining inquiry
The European Commission has put forward new plans to cut emissions under the EU carbon market more slowly, from 2031 onwards.
On 17 July, the commission presented its long-awaited proposal for reform of the EU’s Emissions Trading System (ETS).
It recommended a number of changes, including giving companies free allowances to cover their emissions for longer than previously planned, conditional on climate investment plans.
The proposal offers a more business-friendly and “savvy” approach, argued EU climate commissioner Wopke Hoekstra in a press conference.
But critics believe it could “weaken” the system and put EU climate targets at risk.
Alongside the proposal, the commission also announced a new target for electricity to make up 46% of energy consumption by 2040, doubling the current rate of 23%.
This could cut EU spending on imported fossil fuels by €260bn annually, according to the commission.
In this Q&A, Carbon Brief outlines the details of the new ETS proposal – which is subject to negotiation with member states – and explores what it could mean for climate action.
- What is the EU Emissions Trading System?
- What did companies and countries want from the ETS review?
- What is in the new proposal from the European Commission?
- What could the changes mean for greenhouse gas emissions?
- How was the proposal received?
- What is ‘ETS2’?
- What happens next?
What is the EU Emissions Trading System?
The EU ETS is a carbon market, which puts a price on the greenhouse gas emissions of companies in power generation, industry, aviation and other sectors.
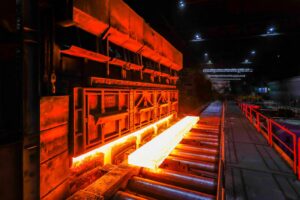
It covers everything from electricity generation to steel production, as well as flights within the EU and a handful of other European countries.
Emissions in these sectors have halved since the ETS launched in 2005, according to the European Commission.
A European parliament briefing describes the system as a “cornerstone” of EU climate policy, covering around 40% of the bloc’s overall emissions.
It applies to emissions in all 27 EU countries alongside Iceland, Liechtenstein, Norway and electricity generation in Northern Ireland. (The UK established its own ETS after Brexit.)
The ETS operates as a “cap and trade” system, which puts a limit on the amount of carbon dioxide equivalent (CO2e) that can be emitted within the sectors it covers.
The “cap” on emissions gradually decreases each year until, eventually, they are expected to reach zero.
The currency of trade within the system is “allowances”. One allowance is equal to one tonne of CO2-equivalent emissions.
At present, around 57% of these allowances are bought by companies in auctions. The EU generated around €43bn in revenue from these auctions in 2025.
The remaining 43% of allowances are given to companies for free, to cover some or all of their emissions.
This is intended to prevent “carbon leakage” – the idea that companies operating in countries with strict climate policies will relocate to countries with looser rules.
The amount of free allowances varies by sector, depending on factors including the level of competition with overseas firms that do not face a carbon price.
What did companies and countries want from the ETS review?
Countries and companies have been divided on how they wanted the ETS to evolve.
Some pushed for more ambition to help meet European climate goals. Others called for it to be rolled back, amid rising costs for businesses.
In March, 10 countries including Italy, Hungary and Poland wrote a letter to the commission calling the ETS an “existential risk” for key industrial sectors, reported Euronews.
Italy had earlier even called for the system to be suspended outright.
France and other countries favoured introducing a slower descent towards bringing the emissions cap to zero by 2039.
Some steel and chemical companies also criticised the cost burden of the ETS.
Other organisations focused on calls for stability and predictability in the system.
In recent weeks, Spain, the Netherlands and five other countries called on the commission to “resist gutting” the ETS in its review, said E&E News. They said the ETS should be strengthened to “ensure long-term investment predictability and regulatory stability”.
Weakening the system could “undermine investment signals and leave Europe more exposed to fossil-fuel shocks”, said a March 2026 briefing from climate thinktank E3G.
Another E3G briefing said the “risk” is that politicians weaken the system as a short-term economic fix, “undermining one of the EU’s main tools for delivering on its industrial transformation ambitions”.
Dozens of investment organisations called on EU countries to facilitate a “robust and predictable” ETS. They said that “policy stability is the cheapest investment stimulus available to the EU”.
In its list of priorities for ETS reform, the NGO Carbon Market Watch said that “now is not the time to backslide” on its aims and terms.
What is in the new proposal from the European Commission?
The commission’s proposal outlines a number of changes to the ETS, to bring it in line with the EU’s climate goal to cut emissions to 90% below 1990 levels by 2040.
The review will “bring relief to industry”, the commission says, while also continuing the ETS’ “essential” role in climate action.
However, others are more sceptical about the impacts it could have on climate action.
Below, Carbon Brief details the main aspects of the proposal.
Free allowances extended
The European Commission proposes to extend free allowances beyond a previously agreed date.
Free allocations were due to reduce from this year and be fully removed by 2034.
However, the commission has proposed to extend this to 2038, on the condition that companies receiving free allowances set out how they will invest in decarbonising their EU operations.
It proposes that from 2031 onwards, 80% of free allowances in the system would be given to companies that have submitted plans for investment in EU decarbonisation.
The remaining 20% of free allowances would only be allocated to those that can prove they followed through with planned investments and achieved the emissions reductions they had previously outlined.
This move is a “step in the right direction”, says Dr Kirsten Scholl, the director for EU affairs at thinktank Epico, but it must not “impose excessive administrative burdens”.
The EU’s carbon border adjustment mechanism (CBAM) was designed to replace the existing system of free allowances in the ETS.
It is a tax applied to certain imported goods, based on the amount of CO2 emissions released during their production. It began to be phased in at the start of 2026.
As a result, free allocation is being gradually phased out from 2026-38.
However, the commission has proposed that 15% of free allocations due to be removed because of CBAM should be reintroduced from 2028, to “reduce the speed at which CBAM is phased-in and mitigate the remaining carbon leakage risk”.
The commission says that preventing carbon leakage “remains a crucial element” of the ETS.
Pushing back the phase-out of free allowances and the full implementation of CBAM “risks squandering the EU’s credibility with investors and trading partners alike”, says Francesco Lombardi Stocchetti, a policy advisor on sustainable economy at the Bellona Foundation, an environmental NGO.
“Europe cannot lead the clean industrial transition just by moving the goalposts,” he adds in a statement.
Slowing path to reach zero emissions by a decade
The commission has proposed to cut emissions in the ETS more slowly from 2031 onwards.
This could mean new allowances are able to enter the scheme into the 2040s, instead of ending in 2039 as previously planned.
But the planned changes are still “aligned” with the EU’s 2040 climate target and net-zero requirement by 2050, says the commission.
The overall ETS cap on emissions was reduced by 1.7% each year up to 2020 and then by 2.2% annually since 2021.
It is then agreed to drop by 4.3% over 2024-27 and 4.4% from 2028 onwards.
Maintaining similar rates after 2030 would not be “realistic”, says the commission’s proposal.
Instead, it suggests that the cap should fall by 3.7% per year over 2031-35 and by just 1.7% annually over 2036-40.
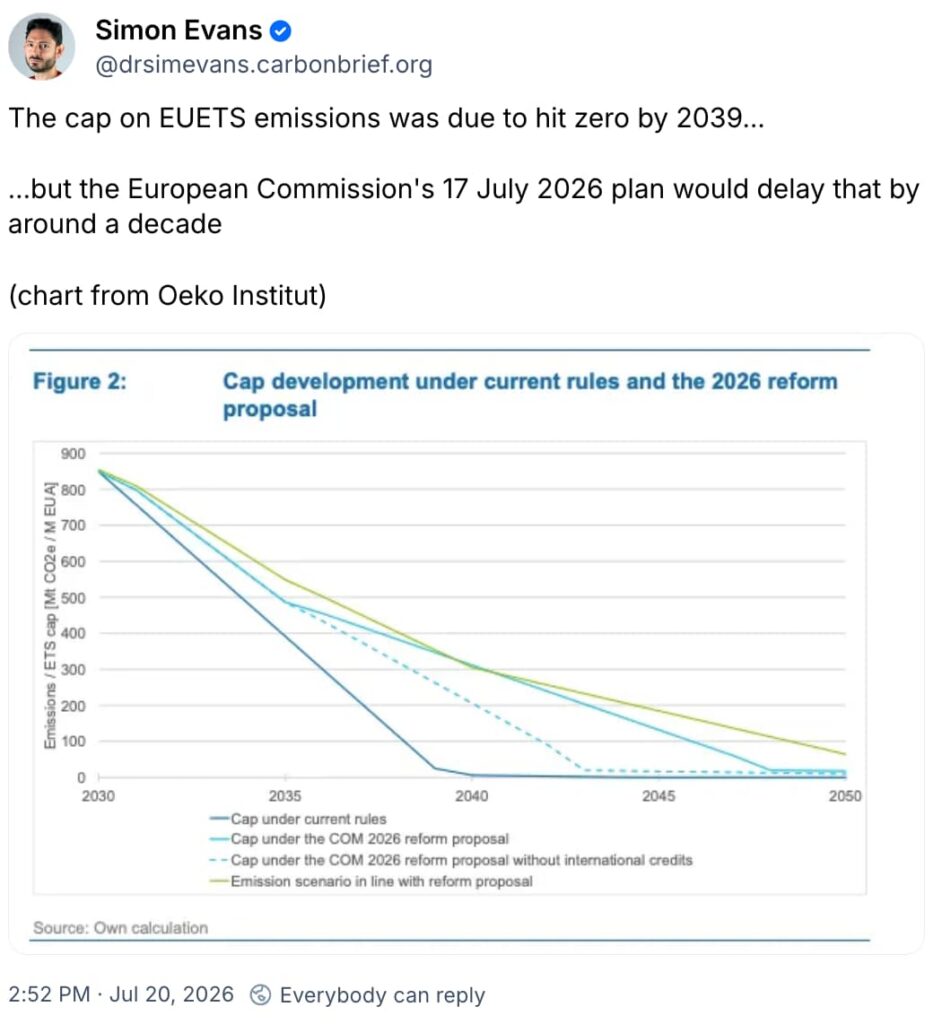
This will make the path to zero emissions within the ETS “more gradual and aligned with domestic climate ambition level”, claims the commission.
But WWF says that the proposal would allow an extra 2bn tonnes of CO2e to be emitted. (See: What could the changes mean for greenhouse gas emissions?)
Aviation
The commission has proposed plans to incorporate more airline emissions into the ETS.
The plan outlines that, from 2029, all flights departing from the European Economic Area (EU, Iceland, Liechtenstein and Norway) and landing in other countries within 5,000km of a point in central Europe should be added to the ETS.
This distance means that the changes would not apply to flights landing in China or the US. (Both the US and China have opposed the expansion of ETS coverage for flights.)
The commission also proposes including emissions from private jets and other “business flights” in the ETS.
It notes that aviation currently accounts for 14% of EU transport emissions. This is expected to skyrocket to around 90% by 2050, given it is more difficult to decarbonise than other modes of transport.
Some aviation emissions have been included in the ETS since 2012. This included emissions from air travel within the EEA and flights departing from Switzerland and the UK.
The airline industry did not respond favourably to reports of plans to expand beyond this scope.
On 8 June, the biggest airlines in Europe urged commission president Ursula von der Leyen not to extend the ETS to cover international flights, saying that it would raise ticket prices.
A study commissioned by Carbon Market Watch found that the ETS encompassing all flights departing from the EEA, not just those within it, would result in a “very small impact on ticket prices and passenger demand”.
Auction money
Under the proposed changes, EU countries would need to funnel half of the money they receive from ETS auctions towards decarbonising sectors covered by the system.
This would amount to more than €100bn in investment for decarbonisation before 2030, says the commission.
Around three-quarters of the money generated by the ETS has been allocated to EU countries since 2013, the proposal notes.
Since 2023, countries have been required to spend all of this money on climate and energy-related activities – at least on paper.
But the proposal says the “transparency and effectiveness” of this mechanism has been “insufficient”.
Currently, only around 5% of the ETS money “directly supports industrial decarbonisation in sectors such as steel, chemicals and fertilisers”, it adds.
Going forward, the proposal says that 50% should be put towards actions aiding clean-energy plans, industrial decarbonisation and improved waste management, as some examples.
A briefing by thinktank Institut Montaigne noted that the money generated within the system for EU countries to help finance the energy transition should be “at the heart” of ETS discussions, amid budget constraints in many EU countries at the moment.
CO2 removals
The commission has proposed integrating permanent carbon removals into the ETS to “give additional flexibility” for certain sectors that struggle to decarbonise. This action was previously agreed within the terms of the EU’s 2040 climate target.
“Permanent” removals refer to direct air capture with carbon storage and similar measures, rather than temporary removals such as planting trees.
The removals would be integrated into the system by increasing the allowance cap by an amount equivalent to the number of removals purchased.
This will set up “additional emission space” for hard-to-abate sectors and also support the “scale-up of the carbon removals industry”, outlines the proposal.
It also proposes that certain companies, such as shipping and aircraft operators, could compensate for their emissions with their own certified carbon removals.
These emissions would not be permitted to “go beyond zero”, adds the proposal.
Sven Harmeling, the head of climate at Climate Action Network (CAN) Europe, says that adding carbon removals “would weaken the ETS impact, undermine the carbon price and create new loopholes for polluters instead of accelerating the transition away from fossil fuels”.
The proposal “fails to ensure that only high-integrity removal technologies would be considered”, he adds in a statement.
However, the director of the Potsdam Institute for Climate Impact Research, Prof Ottmar Edenhofer, describes the move as “an important step”, saying:
“For the first time, it creates a credible and long-term investment framework for carbon-removal technologies in Europe.”
International credits
The commission proposes that firms covered by the ETS could make use of “high-integrity” credits bought on the global carbon market from 2036 onwards.
This relates to the EU’s 2040 climate target, in which up to 5% of the 90% reduction in GHGs can come from global carbon credits.
Amélie Laurent, a policy advisor in carbon accounting at the Bellona Foundation, says in a statement that these credits “should be in a strategic last resort reserve, not an excuse to avoid doing our homework”.
Aurora D’Aprile, the EU policy director at the International Emissions Trading Association, notes in a statement:
“For international credits, early preparation on governance and procurement and greater certainty around a pilot from 2031, will be essential to establish a credible demand signal.”
Other sectors extended
The commission has outlined plans to expand the inclusion of the maritime sector in the ETS.
Maritime accounts for around 4% of the EU’s total emissions. The new proposals for the sector include adding certain small ships of 400-5,000 tonnes to the system.
The proposal also outlines plans to incorporate more waste incineration into the ETS on a gradual basis from 2031.
Since 2024, some waste-burning companies have been required to monitor and report their emissions under the ETS. But they did not have to purchase credits.
Now, the commission proposes introducing the sector on a gradual basis.
Under the proposals, companies would require allowances for 25% of their emissions in 2031, 50% in 2032, 75% in 2033 and 100% from 2034 onwards.
Market stability reserve review
The market stability reserve was added to the ETS in 2019 to help stabilise the flow of allowances.
It acts like an overflow container holding extra allowances. If the number of allowances in the market falls below a certain threshold, more are brought out from the reserve to balance things out.
Equally, if the market is flooded with too many allowances, depressing prices, then some are removed and put into the reserve.
The commission has proposed a reform of the reserve, including changing the upper and lower limits for when allowances are released or removed.
It wants to reduce the rate at which allowances are withdrawn from auctions when they exceed a certain threshold from 24% to 12% from 2028.
This means that the permits would be able to stay in the market for longer.
As shown in the chart below, the price of carbon in the EU increased tenfold over 2017-2021, exceeding €80 (£68) per tonne of CO2.
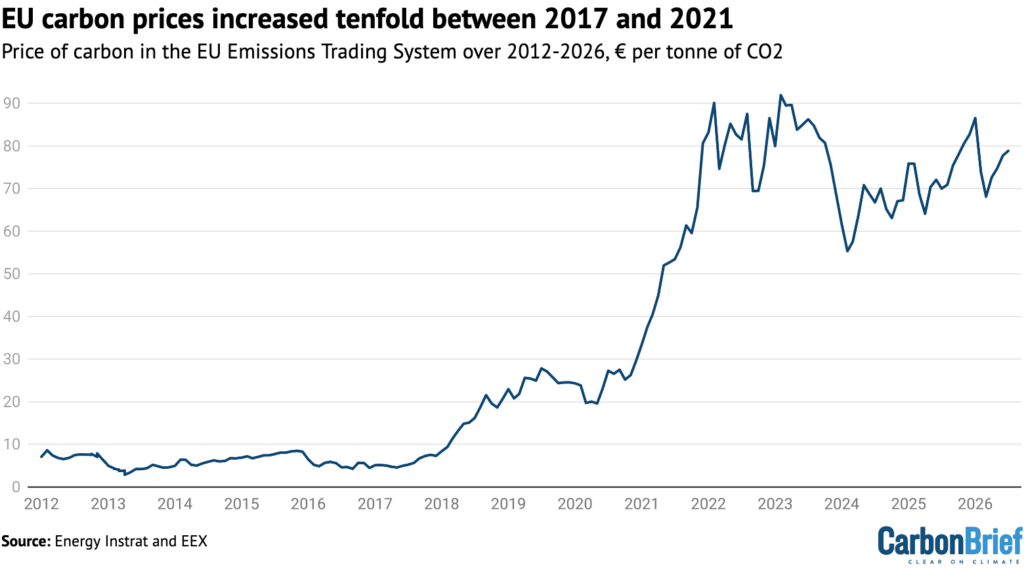
Nevertheless, the commission proposal says the reserve was “effective in mitigating price shocks” on the ETS caused by the Covid-19 pandemic and the surge in energy prices after Russia invaded Ukraine in 2021.
UK-EU ties
The EU and UK have agreed in principle to link their carbon markets, but the commission’s proposal says negotiations are still “under progress”.
It adds that the commission “foresees” future financial contributions from the UK to the EU’s ETS, if a final agreement is reached.
Many companies have called for the systems to be linked. In June, dozens of carbon-capture organisations and industry groups signed a letter calling for greater certainty on EU-UK links to ensure cross-border carbon-capture and storage projects are covered, for example.
Switzerland’s ETS has been linked to the EU since 2020.
What could the changes mean for greenhouse gas emissions?
The European Commission says the ETS plays a “crucial role” in meeting its climate targets “cost-effectively”.
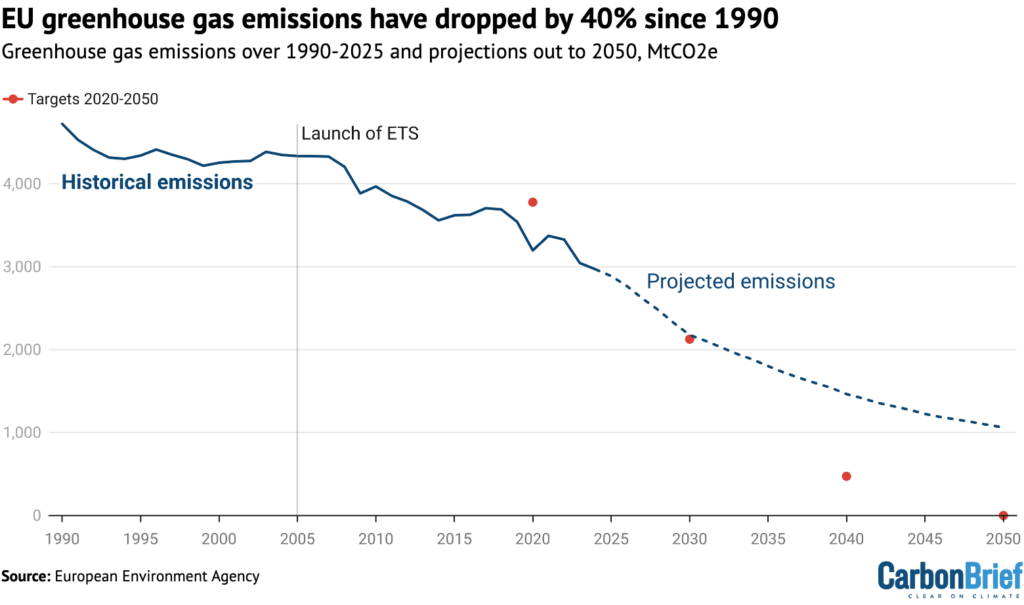
The system contributed to a 41% reduction in EU industrial emissions over 2021-23, a decrease of around 800m tonnes of CO2 per year, according to recent analysis from the London School of Economics.
As highlighted in the chart below, the EU’s overall GHG emissions have dropped by 40% since 1990.
Climate commissioner Hoekstra told a press briefing that the proposal is “fully aligned” with the EU’s target to cut GHGs to 90% below 1990 levels by 2040. He called the plan “completely climate-law proof”.
He also noted that no other EU policy has contributed to reducing emissions on the scale of the ETS, describing it as a “phenomenal asset”.
But campaigners and experts are concerned that the proposed changes could slow decarbonisation and put the EU’s climate goals at risk.
Carbon Market Watch says the plans would “severely weaken” the ETS and “risk undermining the achievement of the EU’s 2040 and 2050 climate targets”.
The proposals “would represent a major setback for EU climate ambition, weakening incentives to cut emissions, extending reliance on fossil fuels and putting the 2040 climate target at risk”, says a statement from WWF.
WWF estimates that 2bn extra tonnes of CO2 would be emitted if the proposals were approved in the EU.
Michael Bloss, a German member of the European parliament (MEP) for the European Greens, says the plans would release around 1.4bn tonnes of extra CO2. He describes the proposal as “climate vandalism”.
Chiara Martinelli, the director of CAN Europe, says:
“Every extra tonne of CO2 allowed under the ETS makes Europe’s climate challenge harder and more expensive. Weakening the ETS now is a gift to polluters that have prioritised shareholder payouts instead of investing in cleaner production.”
How was the proposal received?
The European Commission’s new ETS proposal has been met with a mixed response.
Scholl from Epico says the proposal has “important flexibilities that can help address competitiveness challenges and provide greater certainty for industrial investment”. But she adds in a statement:
“Concerns remain about whether the proposed changes preserve the long-term investment signal of the ETS and sufficiently recognise companies that have already committed to ambitious decarbonisation pathways.”
Edenhofer from the Potsdam Institute for Climate Impact Research adds that the proposals provide “clarity on the contribution that emissions trading is intended to make towards the 2040 climate target”.
Elisa Giannelli, a programme lead at E3G, says in a statement:
“Today’s proposal might please some, but it risks increasing both the long-term cost and the time needed to deliver the EU’s growth strategy.”
Pepe Escrig, a senior researcher, also at E3G, adds that the commission held onto some of the ETS’ “essential foundation”, but “yielded to political pressure to weaken it as a quick fix to broader challenges”.
This has left the plan “pull[ing] in two directions: strengthening support for industrial investment while weakening parts of the framework meant to drive it”, says Escrig.
Andrea Spignoli, the policy manager of sustainable markets at Bellona Europa, says the proposal risks “weakening green investments” and putting a larger decarbonisation burden onto other sectors that are not covered by the ETS.
Greg Van Elsen, a senior industrial policy coordinator at CAN Europe, says in a statement:
“Free pollution permits were never meant to become a permanent subsidy. Extending them until 2038 rewards delay instead of industrial decarbonisation.”
Lobby groups also had mixed reactions to different aspects of the proposal.
The International Air Transport Association says it is “deeply frustrated” with the proposal.
The organisation’s director general, Willie Walsh, claims the consequences will be “harmful”, “sowing acrimony over extraterritoriality, slowing global decarbonisation and sapping European competitiveness”.
WindEurope says the proposal risks “slowing decarbonisation and failing to channel billions in ETS revenues to industrial electrification”.
BusinessEurope’s director general, Markus J Beyrer, says some aspects “raise concerns”. For example, he says the “new conditionalities for free allocations risk increasing bureaucratic complexity and the uncertain role for international carbon credits”.
What is ‘ETS2’?
ETS2 is a separate emissions trading system to the main ETS. It is due to take effect in 2028 and is not affected by the current ETS review or resultant proposals.
It will operate under a similar system as the existing ETS, covering emissions from transport, buildings and smaller industries in other sectors.
One key difference, however, is that ETS2 will not provide any allowances for free. They will all be auctioned and bought by companies.
On 15 July, 10 countries, including Italy and Poland, had urged the commission to also reconsider the ETS2 during this review. They were unsuccessful.
Similar to the original ETS, the commission believes the carbon price under the new ETS2 system will “provide a market incentive for investments in building renovations and low-emissions mobility”.
However, in June, member-state governments and the European parliament agreed on a number of “safeguards” to support price stability.
For example, if allowance costs under the ETS2 exceed €45 per tonne of CO2, they agreed that 40m allowances will be put into the system from a reserve to normalise the supply – double the amount previously agreed.
A European Environment Agency briefing said the ETS2 will “affect fuel prices and mobility costs” and that money will be syphoned into a social climate fund to “support vulnerable households and investments”.
What happens next?
EU countries will now negotiate over the terms of the commission’s proposal before it goes to a vote in the European parliament.
Ireland, which recently took over the six-monthly rotating presidency of the Council of the EU, has stated that it wants the ETS proposals to be signed off by the end of this year.
A previous document from the council, which represents member-state governments, outlined a target to agree a deal by the first quarter of 2027.
Clean Energy Wire says that this would be an “unusually ambitious timetable for one of the bloc’s most technically complex pieces of climate legislation”.
Politico notes that “months of arguing” is likely to occur.


The post Q&A: What the EU’s carbon market review means for climate action appeared first on Carbon Brief.
Q&A: What the EU’s carbon market review means for climate action
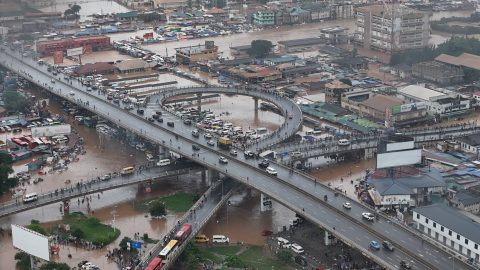
Scientists have found that the deadly floods across parts of West Africa in recent weeks were made more likely and intense by human-driven climate change, while the expansion of cities into flood-prone areas amplified the devastation, raising the thorny problem of how to better protect poorer urban communities.
A report from the World Weather Attribution (WWA) group highlighted how the floods hit some of West Africa’s most densely populated coastal regions, where rapid urbanisation has pushed formal and informal settlements dangerously into floodplains, while converting land into farms has reduced drainage.
Since May, West African countries including Ghana, Togo, Côte d’Ivoire and Nigeria have experienced weeks of torrential rain and deadly flash floods. Homes have been submerged, thousands of people displaced and over 70 people killed.
WWA scientists said climate models showed that human-induced climate change increased the intensity of the rainfall, with what was once a rare amount of rain falling in just three days – a downpour that can now be expected every two to four years.
-
A strong El Niño spells more climate pain for the Philippines
As forecasters warn that the weather phenomenon will bring more extreme weather, its effects are already being felt in a country reeling from a series of disasters -
Southern Africa floods intensified by warming highlight climate injustice, scientists say
Climate change is fuelling extreme rainfall in the region, while insufficient adaptation and aid cuts have left people highly exposed to floods


“The event is not rare already today and therefore the flood risk is certainly not going away but will increase in particular with additional pressures from growing populations and urbanisation,” said Friederike Otto, a professor of climate science at Imperial College London.
Impact made worse by informal settlements
On top of climate change, scientists said urbanisation, inadequate drainage, poor waste management and the expansion of informal settlements into floodplains have left millions more people exposed to flooding.
Informal settlements are neighbourhoods which develop without authorisation from government authorities. More commonly known as slums or shanty towns, they often lack land tenure and services like running water and electricity and tend to be home to poorer communities.
Across West Africa and much of the developing world, as people have moved from rural areas to cities in search of work, these settlements have expanded into wetlands, flood-retention areas and riverbanks. This has further heightened flood risks across West African cities.
Kiswendsida Guigma, technical advisor at the Red Cross Red Crescent Climate Centre, said West Africa’s coastal cities are being “squeezed between repeated flooding and rapid urban growth”, pushing infrastructure beyond its limits and making it harder for communities to recover.
Roussel Teguia, a post-doctoral research fellow at Canada’s Université Laval, said the recent floods have exposed longstanding failures in urban planning across West Africa’s fast-growing coastal cities where much of the region’s economy is concentrated.
Campaigners oppose Dangote’s planned Kenya refinery over climate and ecological risks
Teguia said the floods are deadlier due to factors including rapid urbanisation in low-lying areas, lack of affordable housing alternatives and the long-standing marginalisation of poor communities. He also condemned the destruction of wetlands, mangroves and floodplains for roads and buildings when instead these natural bodies “should be treated as critical public safety infrastructure”.
“These floods should not be understood only as natural disasters,” he said. Residents of informal settlements must stop being treated as the problem, since they are often the first victims of “an urban model that exposes them to risk and then blames them for being exposed”, he added.
Short-sighted approach to relocation
Cote d’Ivoire’s capital Abidjan recorded 59 of the deaths, with about 20 dying in the densely-settled slope neighbourhood of Mossikro. Local media reported that authorities had previously relocated residents from this area due to fears about vulnerability to deadly landslides and flooding, but some people had returned to previously evacuated sites and died when the hillside collapsed due to the rain.
Local authorities have since started demolishing houses in the area, to the anger of many locals who say they were not consulted or warned about the demolitions, which are costing them their properties and livelihoods. “If you destroy this place, where am I supposed to go?” one unnamed resident told Al Jazeera.
The government says many of the structures were built illegally in flood and landslide-risk zones and it plans to move 3,000 people first and 2,000 more later. Municipal official Yue Hilaire told the TV channel the municipality has been trying to persuade them to leave for a long time. “Frankly we are tired,” he said. “The mayor instructed us to evict them because we don’t want to witness another tragedy every year.”
Loss and damage fund delays first project approvals as needs dwarf resources
Guigma said that to avoid people returning, the government should ensure that “where people are relocated they also have relatively good economic opportunities for them to stay”.
Demolishing poor people’s homes without offering real alternatives is not prevention, Teguia argued, calling on governments to provide safe, serviced and affordable land close to jobs and transport, stop the occupation of wetlands and regulate powerful land owners and users.
Relocation programmes often fail because they are designed as land-clearing or security operations rather than social processes, he explained.
Governments must move from reactive crisis management measures to a long-term comprehensive approach to risk, Teguia said. Relocation policies need to be just, fairly compensated, include affected communities and encompass economic and social networks – otherwise they “simply move the vulnerability elsewhere”, he warned.
Finance gap limits flood response
The WWA scientists said deadly floods will continue unless governments do more to reduce people’s exposure and vulnerability, calling for investments in safe and affordable housing, improved drainage and sanitation, stronger enforcement of building regulations, more effective early warning systems and greater involvement of at-risk communities in planning.
Joyce Kimutai, research associate in extreme weather and climate change at Imperial College London, said the study is a clear example of “the need for international cooperation on climate justice”, adding that developed countries have a responsibility to help nations like Togo, Cote d’Ivoire and Ghana to adapt to a worsening problem that, as low emitters of greenhouse gas, they did not cause.
But significant financial support for countries grappling with increasing climate disasters may still be some way off. Earlier this month, the UN’s fledgling Fund for Responding to Loss and Damage (FRLD) postponed approving its first round of projects after requests for support far exceeded the money available.
One of the roughly 180 submissions the fund received was a Nigerian recovery and resilience project to address flood losses and damage in Lagos which is prone to yearly flooding.
Otto of Imperial College London said such situations where the role of climate change is certain “should be the kinds of events where this fund should pay and help, but of course, that would require first money to be in the fund”.
Ghana and Togo have also identified increasingly frequent flooding as a major climate risk in their national adaptation plans, prioritising investments in drainage, resilient infrastructure, flood management, early warning systems and climate-resilient urban planning.
Most “zombie credits” locked out of new UN carbon market after China and India snub
But while these adaptation plans acknowledge that delivering the proposed measures requires more international aid, wealthy nations are likely to have missed their 2025 goal of doubling adaptation finance for developing countries. Funding reached just over $30 billion in 2024, far below the target of $40 billion by 2025.
The WWA findings underscore the urgent need to speed up support for vulnerable communities who have done little to cause climate change, said UN Climate Change Executive Secretary Simon Stiell, adding that “all climate finance commitments must be delivered in full”.
The post Flood deaths in West African cities raise fraught issue of slum evictions appeared first on Climate Home News.
Flood deaths in West African cities raise fraught issue of slum evictions


-
Climate Change11 months ago
Guest post: Why China is still building new coal – and when it might stop
-
Greenhouse Gases11 months ago
Guest post: Why China is still building new coal – and when it might stop
-

 Greenhouse Gases2 years ago
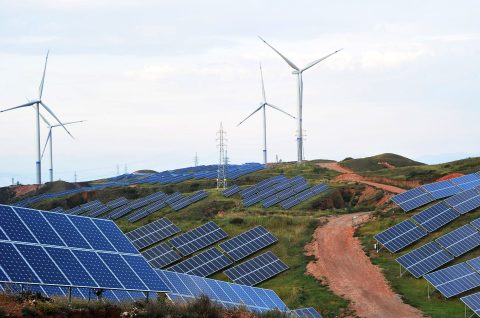
嘉宾来稿:满足中国增长的用电需求 光伏加储能“比新建煤电更实惠”
-

 Climate Change2 years ago
嘉宾来稿:满足中国增长的用电需求 光伏加储能“比新建煤电更实惠”
-
Climate Change2 years ago
Bill Discounting Climate Change in Florida’s Energy Policy Awaits DeSantis’ Approval
-

 Renewable Energy9 months ago
Sending Progressive Philanthropist George Soros to Prison?
-

 Carbon Footprint2 years ago
US SEC’s Climate Disclosure Rules Spur Renewed Interest in Carbon Credits
-
Greenhouse Gases1 year ago
嘉宾来稿:探究火山喷发如何影响气候预测