

CORSIA, managed by the International Civil Aviation Organization (ICAO), requires airlines to monitor and report their emissions, allowing them to purchase emission reduction units, also called carbon credits, if they exceed a set baseline.
The program updates impact both airlines and the carbon market, signalling which credits are eligible and influencing future market purchases.
What Are the New CORSIA Updates?
Recently, CORSIA reviewed and approved six carbon credit standards for its first phase. These include Winrock International’s American Carbon Registry and Architecture for REDD+ Transactions, which were approved without exclusions.
The Climate Action Reserve (CAR), Global Carbon Council (GCC), the Gold Standard, and Verra’s VCS program, were conditionally approved while CDM didn’t qualify for Phase I.
CORSIA allows credits from 2021 onwards with a corresponding adjustment to avoid double counting. This adjustment ensures that credits used for CORSIA don’t overlap with a country’s emission reduction goals under the Paris Agreement.
The mechanism ensures that the allocation of the credits represents real carbon reduction activity and sales, boosting carbon market integrity.
The CORSIA’s Technical Advisory Body (TAB) recommendations from the review influence the market by increasing demand for approved credits. This doesn’t only cover the airlines but also signals other buyers to consider the credits “best-in-class”.
This will affect credits currently available and the future ones, driving up demand in both cases. However, some high-quality credits endorsed by ICROA are not accepted under CORSIA, affecting their eligibility.
Apart from the reassessment, the TAB will also assess any new applications for standards that hadn’t already been approved. The ICAO Council will officially take into account TAB’s recommendations this fall after assessing new credit standard applications.
How Should Airlines Take The Changes?
For airlines preparing for CORSIA’s upcoming phases, it’s important to align their credit strategy with the TAB recommendations for compliance. They need to ensure they make CORSIA-compliant purchases before the true-up deadlines.
For the pilot phase (2021-2023), airlines don’t need to show compliance until January 31, 2025. For phase I (2024-2026), the deadline is January 31, 2028. To meet these deadlines, airlines should plan credit purchases well ahead to avoid any risks.
Due to CORSIA’s multi-year requirements, airlines might consider multi-year purchasing agreements to secure their credits. These agreements should align with both the pilot phase and phase I standards.
While some standards are conditionally approved for phase I, like VCS and Gold Standard, they’re likely to receive full approval.
It’s important to note that credits meeting post-2021 criteria are not yet available. Airlines can fulfill pilot phase purchasing requirements under the existing standards but need to wait for phase I eligible credits. Any long-term deals should consider these factors and specify the qualifying years.
To effectively implement a credit purchasing strategy, clear communication and internal education within airlines are crucial. Airlines should anticipate delays in the availability of Phase I credits, likely not until 2024 at the earliest.
Additionally, CORSIA eligibility rules may increase demand and prices for these credits, so airlines should budget accordingly.
The ICAO estimated the costs from CORSIA offsetting for airline operators as shown in the following chart. This is under the assumption that carbon prices range from a low of $6 – $12 to a high of $20 – $40 per tonne of CO2.

What Are the Effects on Non-Airline Credit Buyers?
Airlines aren’t the only ones affected by CORSIA – the program also impacts those buying carbon credits beyond airlines.
As airlines rush to buy these credits, the limited market will see growing demand, leading to higher prices. Non-airline buyers might also view TAB recommendations as a sign of credit quality, increasing demand for CORSIA-eligible credits and their prices.
For those using CORSIA-approved credits in their carbon strategy, it’s smart to watch these market changes. Adjusting budgets, keeping stakeholders informed, and buying credits well ahead of deadlines can help prepare for these shifts.
While some high-quality credits aren’t eligible under CORSIA, they might meet other standards like the ICVCM’s Core Carbon Principles. These principles are still new but more information will be available on this framework and how the CORSIA credits will be aligned under it.
Balancing CORSIA-eligible credits with quality non-CORSIA ones (like Plan Vivo or Puro.earth credits) can help manage budget and availability issues caused by CORSIA. This mix allows better predictions of availability and less impact from price changes.
Stakeholders who value CORSIA credits might face increased demand and prices. To manage this, they might buy CORSIA credits being assessed by the ICVCM early. This way, they can avoid potential demand impacts caused by meeting the Core Carbon Principles’ criteria.
-
It’s important for credit buyers to discuss how they see CORSIA’s impact on credit quality with stakeholders.
Some might follow CORSIA’s lead strictly, so it’s wise to avoid buying CDM credits to match their preferences. Others might be more flexible, choosing more non-CORSIA credits to reduce risk when buying.
CORSIA’s latest review of carbon credit standards signifies a pivotal moment for airlines and non-airline buyers alike. Credit buyers should adapt their strategies to account for increased demand, pricing shifts, and explore a balanced mix of CORSIA-eligible and other high-quality credits to show commitment to real carbon reduction.
The post 6 Carbon Credit Standards Approved Under CORSIA’s Phase 1 Updates appeared first on Carbon Credits.
Carbon Footprint
Boeing Locks in 40,000 Tons of Soil Carbon Removal with Texas-Based Grassroots Carbon

The aviation industry is under pressure to cut emissions while demand for air travel continues to grow. Against this backdrop, Boeing’s latest agreement with Grassroots Carbon signals a clear shift in how large emitters approach climate action. Instead of relying heavily on traditional offsets, the company is now backing high-quality carbon removal rooted in nature.
This multi-year deal focuses on verified soil carbon removal. It reflects a broader industry trend: moving from compensation to actual carbon removal. More importantly, it connects climate goals with real economic benefits for rural communities.
Boeing’s Shift: From Offsets to Real Carbon Removal
Boeing’s agreement to purchase at least 40,000 metric tons of carbon removal credits marks more than just another sustainability initiative. It shows a deeper transition in its carbon strategy.
Earlier, many companies relied on carbon offsets to balance emissions. However, Boeing has refined its approach. It now follows an “avoid first, remove second” model. This means the company prioritizes cutting emissions directly—through renewable electricity and sustainable aviation fuel—before addressing the remaining footprint.
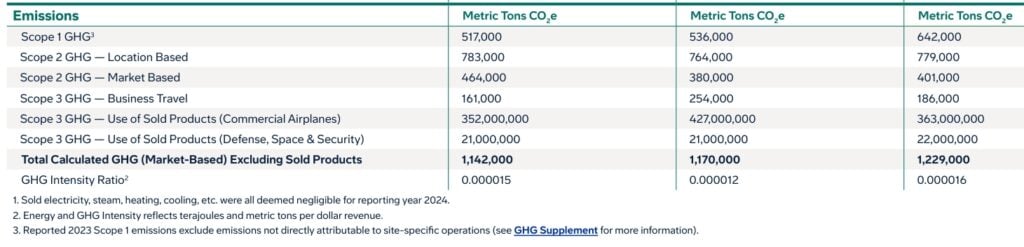
Targeting Scope 3 Emissions
Still, not all emissions can be eliminated. Business travel, classified under Scope 3 emissions, remains difficult to reduce. This is where carbon removal comes in. By investing in verified soil carbon credits, Boeing aims to tackle these residual emissions more credibly.
At the same time, this approach aligns with growing scrutiny in voluntary carbon markets. Buyers are increasingly looking for durable, science-backed solutions. Soil carbon, when properly measured and maintained, can meet these expectations.
Allison Melia, vice president, Global Enterprise Sustainability, Boeing, said:
“We’re proud to work with Grassroots to accelerate carbon-removal technology that will benefit the entire global aviation industry. Enabling the long-term growth of air travel and supporting our airline customers’ emissions reduction targets are key priorities for Boeing.”
Regenerative Ranching: Turning Soil into a Climate Asset
At the core of this agreement lies regenerative ranching—a land management approach that restores ecosystems while capturing carbon.
Unlike conventional grazing, regenerative systems mimic natural herd movements. Ranchers rotate livestock across pastures. This prevents overgrazing and allows vegetation to recover. As a result, plant roots grow deeper and stronger.
This process plays a critical role in carbon sequestration. Through photosynthesis, grasses absorb carbon dioxide from the atmosphere. They then transfer this carbon into the soil through roots and organic matter. Over time, this builds stable soil carbon that can remain stored for decades.
Additionally, grazing itself can enhance this process. When managed properly, it stimulates plant growth and increases carbon storage below ground. Studies suggest these systems can capture between 1 to 5 tons of CO2 per hectare each year.
However, the benefits go beyond carbon. Healthier soils improve water retention, reduce erosion, and support biodiversity. Ranchers also see improved productivity and greater resilience to climate extremes.
This makes regenerative ranching a rare win-win solution. It supports climate goals while strengthening agricultural systems.
Soil Carbon Credits Are Gaining Credibility
Carbon credits often face criticism for lacking transparency or permanence. However, soil carbon credits are evolving quickly.
In this case, credits are generated by tracking changes in soil carbon over time. Projects establish a baseline and then measure improvements driven by regenerative practices. Each credit corresponds to one metric ton of CO2 removed or avoided.
To ensure credibility, projects use a combination of soil sampling, satellite monitoring, and modeling. Independent verification further strengthens trust. Many of these credits meet standards set by leading registries such as Verra and the Climate Action Reserve.
Durability remains a key question. Soil carbon is considered a long-term storage solution, especially when supported by ongoing land management. In many cases, carbon can remain stored for 25 to 100 years or more.
For corporate buyers, this level of integrity is critical. It allows them to make credible climate claims while supporting real-world impact.
How Grassroots Carbon Is Scaling a Natural Climate Solution
The United States holds a unique advantage in this space. Its grasslands cover roughly 655 million acres—nearly 40% of the country’s land area. These landscapes represent one of the largest untapped carbon sinks.
If managed effectively, they could remove up to 1 billion tons of CO2 equivalent annually. That potential makes soil carbon one of the most scalable nature-based solutions available today.
Grassroots Carbon is working to unlock this opportunity. The company partners with ranchers across more than 2.2 million acres in 22 states. It supports them in adopting regenerative practices while ensuring measurable climate outcomes.
Importantly, the company focuses on scientific rigor. It measures soil carbon directly, often up to one meter deep. Then, independent third parties verify the data using recognized standards. This process ensures that each carbon credit represents real and additional carbon removal.
- The company has already delivered 1.9 million tons of verified carbon removals. A large portion of these credits has been retired by corporate buyers, reflecting strong market demand.
This scale matters. It shows that soil carbon is not just a niche solution. Instead, it can operate at a level relevant to global climate goals.
Supporting Rural Economies
Moving on, regenerative ranching supports rural communities by creating new revenue streams. Ranchers can earn income from carbon credits while improving their land. This reduces financial pressure and encourages long-term stewardship.
Moreover, healthier ecosystems provide broader benefits. Improved soil structure enhances water retention, which is critical in drought-prone areas. Restored grasslands also support wildlife habitats, including bird populations.
Grassroots Carbon works with partners such as conservation groups and research institutions to ensure these outcomes. This collaborative approach strengthens both environmental and social impact.

Aviation’s Broader Climate Challenge
The aviation sector faces one of the toughest decarbonization challenges. Unlike power generation or road transport, it cannot be easily electrified. Aircraft require high-energy-density fuels, which limit near-term options.
Sustainable aviation fuel offers a partial solution. However, supply remains limited, and costs are high. As a result, carbon removal will likely play a growing role in the sector’s strategy.
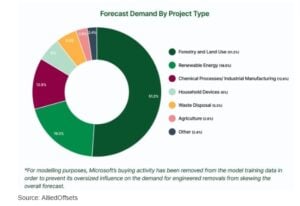
AlliedOffsets estimates that carbon credit buyers will spend around $2.27 billion per year. Aviation and energy are expected to contribute the most.
- The aviation sector alone has a budget of over $800 million per year, which is about one-third of the total.
Boeing, by supporting soil carbon projects, diversifies its approach to emissions reduction. The biggest advantage is that soil carbon removal is both scalable and immediately deployable. Unlike emerging technologies, it does not require decades of development. Instead, it builds on existing agricultural practices.
At the same time, this move sends a signal to the market. Large buyers can drive demand for high-quality carbon removal. This, in turn, encourages more investment and innovation in the space.
However, scaling this solution will require continued investment, strong verification, and supportive policies. It will also depend on maintaining trust in carbon markets. However, as demand for carbon removal grows, partnerships like this could become a cornerstone of global decarbonization efforts.
The post Boeing Locks in 40,000 Tons of Soil Carbon Removal with Texas-Based Grassroots Carbon appeared first on Carbon Credits.

Tesla has reclaimed the global electric vehicle (EV) sales crown, overtaking BYD in early 2026. In the first quarter of 2026, Tesla delivered 358,023 EVs worldwide. This figure edged out BYD’s 310,389 EV deliveries, giving Tesla back the lead in pure battery electric vehicle (BEV) sales and sending stock slightly upward.
Tesla’s sales in this period rose about 6.3% year‑over‑year, showing a rebound from slower parts of 2025. This shift matters because the EV giant lost the annual global BEV sales lead in 2025.
Last year, BYD’s annual pure electric vehicle sales were higher than Tesla’s, largely due to China’s strong EV demand and policy changes.
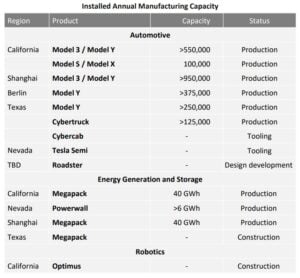
The recent growth in Tesla’s sales shows high demand for its main models. The Model Y and Model 3 made up most of the deliveries in Q1 2026.
Battle of the EV Titans: Tesla vs. BYD
Competition between Tesla and BYD has become one of the defining stories in global EV markets.
BYD expanded rapidly over the past few years. It has a broad lineup of EVs and plug‑in hybrids and benefits from strong domestic sales in China. In 2025, BYD reported high sales growth as it strengthened its footprint outside China.

Tesla, by contrast, focuses on a narrower range of pure EVs but scales production efficiently. It has manufacturing plants in the United States, China, and Europe. These facilities help cut costs and serve major markets more quickly.
The rivalry pushes both companies to improve pricing, technology, and production capacity. Tesla’s price cuts in some markets and BYD’s aggressive growth have kept competition tight.
The EV Boom: Markets on Overdrive
The global EV market keeps growing strongly. According to the International Energy Agency (IEA), electric car sales reached more than 17 million units globally in 2024. EVs made up more than 20% of total new car sales that year — up from earlier levels.
Data from the IEA’s Global EV Outlook 2025 shows that electric light‑duty vehicle sales are expected to reach about 40% of total vehicle sales by 2030 under current policy trends.
The stock of EVs on the road is also growing. The global EV fleet could expand to around 245 million vehicles by 2030 under stated policies.
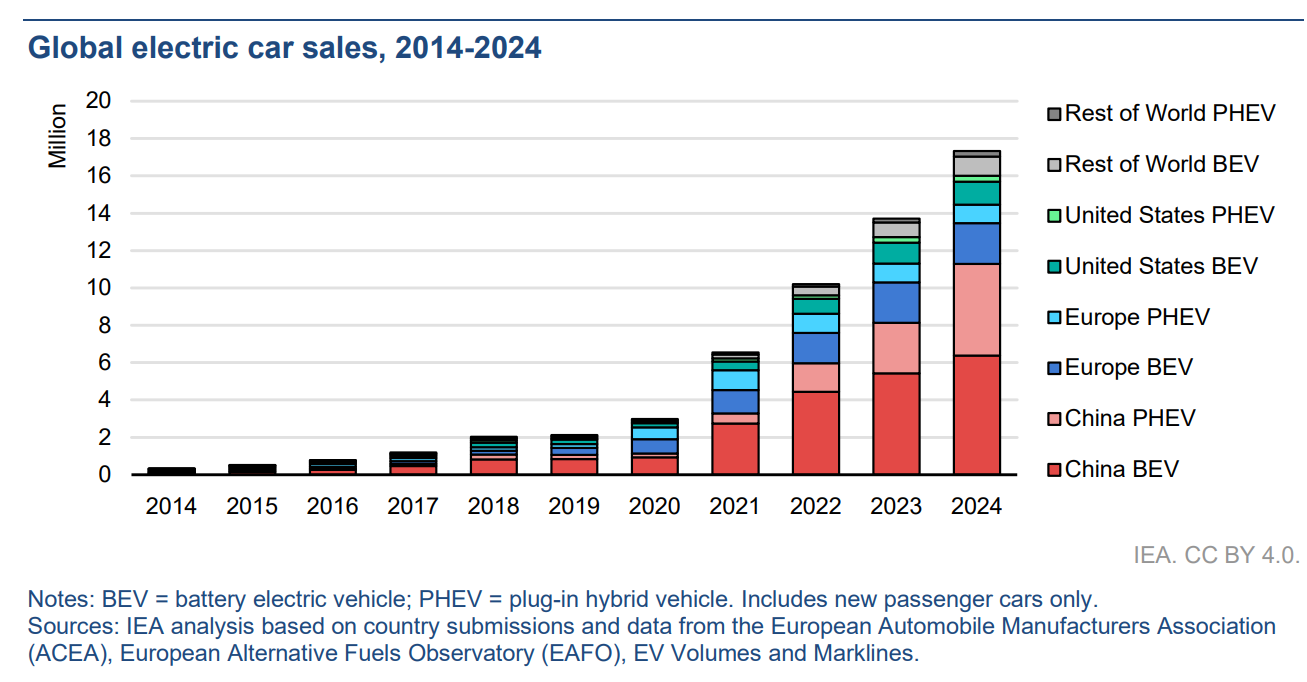
Growth is strongest in China, Europe, and the United States. China remains the largest EV market, accounting for more than half of global EV sales in recent years.
Battery cost declines also fuel adoption. Average lithium‑ion battery prices have fallen significantly over the past decade, making electric vehicles more affordable. Governments around the world are also boosting EV uptake with incentives and stricter emissions standards.
Tesla’s Playbook: Scale, Tech, and Price Moves
Tesla’s return to the top reflects its focus on production scale and cost efficiency. The company has reduced vehicle prices in key markets to stay competitive. These price cuts helped increase demand, though they also put pressure on profit margins.
Elon Musk’s EV company continues to invest in manufacturing technology. Its “gigafactories” use advanced automation and large casting techniques to reduce production costs. Newer facilities in the U.S. and abroad help Tesla maintain output even as demand shifts.
The company is also developing next‑generation vehicles. These include plans for more affordable EV models designed to attract a wider range of buyers.
Tesla is expanding its energy business as well. This includes battery storage systems and solar products that align with the company’s broader clean energy goals.
Software remains a strength for Tesla. Features like over‑the‑air updates and driver assist systems add value for customers and differentiate Tesla’s vehicles from competitors.
Wall Street Watches, TSLA Reacts
Tesla’s stock, traded as TSLA, has shown volatility in response to sales news.
After Tesla’s delivery numbers in Q1 2026 showed the company regaining the BEV sales lead, its shares saw some short‑term gains. However, the stock has remained volatile. Broader concerns about pricing pressure, excess inventory, and competition have kept investor sentiment cautious.

In early 2026, shares pulled back after production exceeded deliveries and analysts noted weaker-than-expected margins. Tesla produced 408,386 vehicles in Q1 2026 but delivered 358,023, leaving some inventory unsold. This gap contributed to stock pressure.
Despite these swings, Tesla remains one of the highest‑valued automakers in the world. Its market capitalization continues to reflect expectations about future EV adoption and the company’s role in clean energy.
Market watchers note that Tesla’s ability to maintain leadership in BEV sales affects its valuation. Strong delivery figures help support confidence in Tesla’s long‑term strategy, even as competition increases.
Beyond sales and competition, Tesla’s EVs also play a key role in the global effort to reduce carbon emissions and fight climate change.
EVs Fighting Climate Change, One Mile at a Time
Electric vehicles help cut carbon emissions from transport. Road transport is a major source of energy‑related emissions. In recent years, EVs made up more than 20% of global car sales, according to the IEA.
EVs reduce oil demand and lower emissions. The global EV fleet could rise to nearly 245 million vehicles by 2030 under stated policy scenarios, significantly displacing traditional gasoline and diesel cars.

As EV adoption grows, the carbon intensity of the electricity grid becomes more important. EVs charged with cleaner power produce larger net emission benefits.
Even with mixed grid emissions, EVs still reduce lifetime greenhouse gas output compared with internal combustion vehicles.
Governments around the world support EV adoption with stricter fuel standards, tax incentives, and expanded charging networks. These policies help ensure electric vehicles contribute to global decarbonization and climate goals.
Outlook: Growth, Competition, and Innovation
The EV market is expected to grow strongly in the coming years. Demand is supported by climate goals, advancing technology, and consumer interest in cleaner mobility.
Tesla’s return to the top in early 2026 shows that it remains a central player in the electric transition. Its focus on pure electric vehicles, global scale, and continuous innovation continues to fuel its position.
However, the gap between Tesla and competitors like BYD is narrowing. BYD’s strong EV growth, especially in China and expanding export markets, shows that competition remains intense.
Future leadership in the EV industry will depend on cost, technology, charging infrastructure, and the ability to scale production efficiently. Companies that balance these factors well will shape the next phase of the global EV market.
For now, Tesla’s rebound highlights both the rapid growth of the sector and the increasing intensity of competition among the world’s leading EV makers.
The post Tesla Reclaims EV Sales Crown from BYD in Q1 2026, Heating Up the EV Race appeared first on Carbon Credits.
Carbon Footprint
Microsoft Signs 626,000-Tonne Carbon Removal Deal with Svante and Indigenous-Led North Star Project in Canada

Microsoft (MSFT stock) has signed a long-term carbon removal agreement that highlights both the scale and direction of the emerging carbon market. The company will purchase 626,000 tonnes of durable carbon dioxide removal (CDR) credits over 15 years from the North Star project in Saskatchewan, Canada.
This project is being developed by Svante Technologies Inc. in partnership with the Meadow Lake Tribal Council (MLTC), through their joint venture North Star Carbon Solutions LP.
The facility will use bioenergy with carbon capture and storage (BECCS) to remove CO₂ from the atmosphere and store it permanently underground. Notably, the project will be co-located at the existing MLTC Bioenergy Centre and powered by waste biomass from a nearby Indigenous-owned sawmill.
This makes it one of the first fully integrated, Indigenous-led BECCS projects in Canada and a landmark deal in Microsoft’s growing carbon removal portfolio.
Indigenous-Led Carbon Project Sets New Benchmark in Canada
The North Star project stands out not just for its technology, but also for its ownership model. It is expected to be Canada’s first major Indigenous-owned, high-quality carbon removal project. The Meadow Lake Tribal Council, which represents several First Nations communities, plays a central role in both ownership and development.
This structure ensures that economic benefits stay within the local community. During construction, the project is expected to create around 50 jobs. Once operational, it will support a smaller but steady workforce while also boosting demand for nearby businesses. As a result, the project delivers both climate and economic value.
Equally important, the facility will rely on an existing industrial ecosystem. The MLTC Bioenergy Centre already generates renewable energy using wood waste.
That waste comes from the NorSask Forest Products sawmill, which is owned by MLTC and supplied through sustainably managed forests. This close integration reduces costs, improves efficiency, and strengthens the project’s environmental credibility.
Phillip Goodman, Director of Carbon Removal Portfolio, Microsoft, said:
“We’re pleased to work with North Star Carbon Solutions and Meadow Lake Tribal Council to help advance high-quality, durable carbon dioxide removal. To meet our climate goals, we need to help scale solutions that deliver durable storage and are backed by rigorous monitoring and verification. This agreement supports an Indigenous-led collaboration that enables the infrastructure needed to bring durable carbon removal online in Canada, thus creating a pathway for additional projects over time.”
How the North Star BECCS System Works
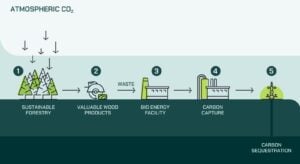
The North Star facility uses BECCS, a technology widely seen as critical for achieving net-zero emissions. It combines renewable energy production with carbon capture to deliver negative emissions.
- In this system, trees first absorb CO₂ from the atmosphere as they grow. When these trees are processed for wood products, leftover biomass is used as fuel to generate energy.
- Normally, this process would release carbon back into the air. However, in this case, the CO₂ is captured before it can escape.
- The captured carbon is then compressed, transported, and injected deep underground into a secure geological formation.
This ensures long-term storage, often lasting hundreds or even thousands of years. Continuous monitoring systems track the stored carbon to ensure safety and permanence.
Here’s a representation of the BECCS process:
A Fully Integrated “Source-to-Sink” Model
From the process explained above, it’s clear that one of the most important features of the North Star project is its fully integrated design. It connects every step of the carbon removal process, from biomass supply to permanent storage.
This end-to-end system improves efficiency and reduces uncertainty. It also strengthens the credibility of the carbon credits produced.
Significantly, Svante will fund the project through its early stages, supporting development until a final investment decision is made. Commercial operations are expected to begin in early 2029.
Reliable Carbon Removal, Verified and Transparent
At full capacity, the facility is expected to capture up to 90,000 tonnes of CO₂ annually. Over the 15-year contract period, this will translate into the delivery of 626,000 tonnes of verified carbon removal credits to Microsoft.
All credits will follow strict monitoring, reporting, and verification (MRV) standards, ensuring transparency and quality.
Microsoft Scales Up Carbon Removal Strategy
This agreement is part of Microsoft’s broader push to scale carbon removal. The company has rapidly increased its purchases over the past few years, signaling a shift from small pilot projects to large, long-term commitments.
In 2023, Microsoft contracted roughly 5 million tonnes of carbon removal. By 2024, that number rose to 22 million metric tons. In 2025, the target surged further to around 45 million tonnes, as announced by the company. This sharp increase shows how quickly the company is building a diversified carbon removal portfolio.

Importantly, Microsoft does not rely on a single technology. Instead, it spreads its investments across multiple pathways, including BECCS, direct air capture, and mineralization. This approach reduces risk while supporting the development of different solutions.
Recent agreements reflect this strategy. These include multi-million-tonne deals with BECCS facilities in the United States and Europe. Together, they position Microsoft as one of the most influential buyers in the global carbon removal market.
Rising Emissions Make Carbon Removal Essential
Despite its climate commitments, Microsoft faces a growing emissions challenge. The company’s total emissions have increased by more than 30% compared to 2020 levels. This rise is largely driven by the rapid expansion of data centers, cloud services, and AI infrastructure.
These operations require vast amounts of energy and materials, making it difficult to cut emissions quickly. As a result, carbon removal has become a key part of Microsoft’s strategy.
However, the company is clear about its priorities. It focuses first on reducing emissions through efficiency and clean energy. Carbon removal is used only for emissions that cannot be eliminated.
This approach supports Microsoft’s ambitious net-zero goals. The company aims to become carbon negative by 2030 and aims to run on 100% renewable electricity and eliminate all historical emissions by 2050.

BECCS Market Gains Momentum
The North Star deal also reflects growing interest in BECCS technology. While still at an early stage, the global BECCS market is expanding rapidly. Analysts expect it to grow at a CAGR of around 19.27% from 2024 to 2030 as governments and companies seek reliable carbon removal solutions.

BECCS is particularly valuable because it can deliver durable removals. Unlike some nature-based solutions, which may face risks like fires or land-use changes, BECCS stores carbon permanently underground. This makes it attractive for companies looking for high-quality credits.
According to the International Energy Agency, BECCS could play a major role in climate mitigation. It may contribute up to 15% of the emissions reductions needed by 2100 to limit global warming to 2°C.
At the same time, challenges remain. Concerns about biomass sourcing, land use, and storage safety continue to shape the debate. Even so, projects like North Star aim to address these issues through sustainable sourcing and rigorous monitoring.
North Star Marks a New Era in Carbon Markets
In conclusion, the Microsoft–North Star agreement highlights how quickly the carbon removal market is evolving. Large buyers are now committing to long-term deals that help bring new projects to life.
At the same time, the project sets a new benchmark for inclusive climate action. Indigenous ownership ensures that local communities benefit directly from the energy transition.
As demand for durable carbon removal continues to grow, more projects like North Star are likely to emerge. These developments will play a critical role in helping companies meet climate targets while building a scalable, high-integrity carbon market.
In that sense, this deal is more than just a contract. It is a clear signal that carbon removal is moving from concept to reality—and becoming a core part of global climate strategy.
The post Microsoft Signs 626,000-Tonne Carbon Removal Deal with Svante and Indigenous-Led North Star Project in Canada appeared first on Carbon Credits.

Boeing Locks in 40,000 Tons of Soil Carbon Removal with Texas-Based Grassroots Carbon
Tesla Reclaims EV Sales Crown from BYD in Q1 2026, Heating Up the EV Race
The Global Energy Supply in a Decade ‘Is Not a World We’re Going to Recognize’
-
Climate Change8 months ago
Guest post: Why China is still building new coal – and when it might stop
-
Greenhouse Gases8 months ago
Guest post: Why China is still building new coal – and when it might stop
-

 Greenhouse Gases2 years ago
嘉宾来稿:满足中国增长的用电需求 光伏加储能“比新建煤电更实惠”
-
Climate Change2 years ago
Bill Discounting Climate Change in Florida’s Energy Policy Awaits DeSantis’ Approval
-

 Climate Change2 years ago
嘉宾来稿:满足中国增长的用电需求 光伏加储能“比新建煤电更实惠”
-
Climate Change Videos2 years ago
The toxic gas flares fuelling Nigeria’s climate change – BBC News
-

 Renewable Energy6 months ago
Sending Progressive Philanthropist George Soros to Prison?
-

 Carbon Footprint2 years ago
US SEC’s Climate Disclosure Rules Spur Renewed Interest in Carbon Credits