

The voluntary carbon market (VCM) enters 2026 with stronger foundations than a year ago. Despite political headwinds in 2025, investment, contracting, and integrity standards advanced.
According to Abatable’s 2026 market report, forward carbon credit contracts rose 58% year-on-year to $5.8 billion in 2025. This surge shows that buyers are locking in future supply rather than relying on spot purchases.
Funding for carbon credit projects reached $15.8 billion in 2025, even after a slowdown in engineered removal investments. Notably, nature-based funding hit a record $9 billion, signaling strong demand for high-integrity supply.
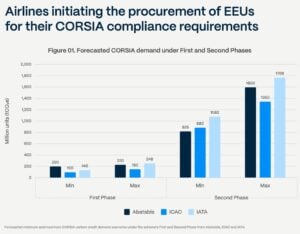
At the same time, compliance markets are reshaping demand patterns. CORSIA, the Carbon Offsetting and Reduction Scheme for International Aviation, is set to create an extra 78 million tonnes of demand by 2026. This is in addition to the 58 million tonnes needed for 2024 emissions.
But the most significant structural shift may come from Japan.
GX-ETS: From Voluntary Signal to Compliance Engine
Japan’s new GX-ETS (Green Transformation Emissions Trading Scheme) becomes mandatory in April 2026. The Asian country emits roughly 1 billion tonnes of CO₂ per year. The GX-ETS will initially cover 500–600 million tonnes annually, more than half of national emissions.
- Between 300 and 400 companies will be regulated under the scheme.
Companies will be allowed to meet up to 10% of their compliance obligations using carbon credits. That creates potential demand of 50–60 million tonnes of credits per year.
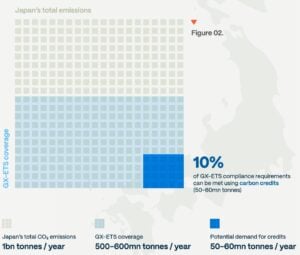
For comparison, total voluntary carbon market retirements across major registries were 163 million tonnes in 2025. Japan alone could represent roughly one-third of that volume in compliance-driven demand.
This is not incremental; it is structural.
Convergence in Practice: J-Credits and JCM
Japan’s design shows how compliance and voluntary systems are merging. Companies can use two credit routes under GX-ETS:
- J-Credits – Japan’s domestic carbon credit scheme
- Joint Crediting Mechanism (JCM) – An Article 6.2 international crediting system with 29 partner countries
J-Credits cover nature-based solutions, renewable energy, and industrial efficiency. Engineered removals such as BECCS (bioenergy with carbon capture and storage) and DAC(direct air capture) are expected to be added in future phases.
The JCM focuses largely on avoidance projects, including renewable energy and efficiency measures. This structure links Japan’s domestic compliance market directly to international carbon trading under the Paris Agreement. It effectively blends compliance demand with voluntary market infrastructure.
Why This Matters for the VCM: From Optional Offsets to Structured Demand
The voluntary market has long relied on corporate net-zero commitments. Yet, that driver is evolving.
The Science Based Targets initiative (SBTi) remains the most influential corporate demand-side framework. Its new Corporate Net Zero Standard V2 draft introduces the concept of Ongoing Emissions Responsibility (OER). Companies may be recognized for addressing ongoing emissions using carbon credits.
This shifts the narrative. Credits are no longer seen only as optional compensation tools. They may become structured components of transition plans.
Meanwhile, integrity has become central.
The Integrity Council for the Voluntary Carbon Market (ICVCM) has approved 40 CCP methodologies across eight programs. CCP-approved methods might create 865 million more credits by 2035. That’s a ninefold rise from current levels.
Even so, CCP-eligible credits are projected to represent only 12.7% of cumulative voluntary supply by 2035. In this context, Japan’s GX-ETS creates guaranteed, regulated demand for credits that meet compliance rules.
This may increase price discipline and quality screening.
Asia Emerges as the Carbon Pricing Growth Hub
Japan is not acting alone. China is expanding its national ETS and moving toward absolute emissions caps. India plans to launch its Carbon Credit Trading Scheme in mid-2026.
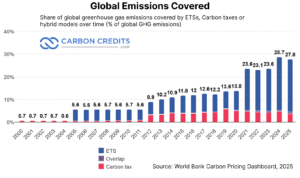
Across Asia, carbon pricing systems now cover hundreds of millions of tonnes of emissions. Globally, carbon pricing instruments cover about 28% of global greenhouse gas emissions, according to the World Bank.
Japan’s GX-ETS will become Asia’s second-largest carbon market.
This regional shift is important. Asia makes up a big part of global emissions and industrial output. When compliance systems in big economies allow some use of carbon credits, they connect voluntary methods to formal rules.
Several other Asian countries already run, or are building, carbon pricing systems.
South Korea operates the Korea Emissions Trading System (K-ETS), launched in 2015. It is one of the largest ETS programs in the region. The International Energy Agency reports that K-ETS includes nearly 80% of Korea’s domestic greenhouse gas emissions. It also targets around 800 of the country’s largest emitters.
Singapore uses a national carbon tax instead of an ETS. The National Environment Agency says Singapore raised its carbon tax to S$25 per tonne in 2024 and 2025, and it will rise to S$45 per tonne in 2026 and 2027. Starting in 2024, Singapore allowed companies to offset up to 5% of taxable emissions. They can use eligible international carbon credits for this.
Indonesia has moved into carbon trading through a formal exchange. The Indonesia Stock Exchange’s carbon platform, IDXCarbon, launched in September 2023, after the country’s financial regulator granted the operator a license. Indonesia’s wider system is expected to evolve into a hybrid model that links trading with a carbon tax-style backstop.
Vietnam has also set a clear roadmap. The International Carbon Action Partnership states that Vietnam updated its carbon market rules in June 2025. It also mandated a pilot ETS starting in August 2025. A fully functioning carbon market is expected by 2029.
These programs show how carbon markets are spreading across Asia through different policy designs. Some countries use cap-and-trade systems. Others use carbon taxes with limited credit use. These models can boost cross-border linkages over time. As Article 6 systems grow, buyers will look for credits that fit both voluntary and compliance needs.
Tightening Supply, Rising Quality Premiums
Supply dynamics are also shifting. Following the 2021 issuance peak, the 2025 supply continued to decline. The net surplus of credits fell to Abatable’s 2026 market report, down from 123 million in 2024.
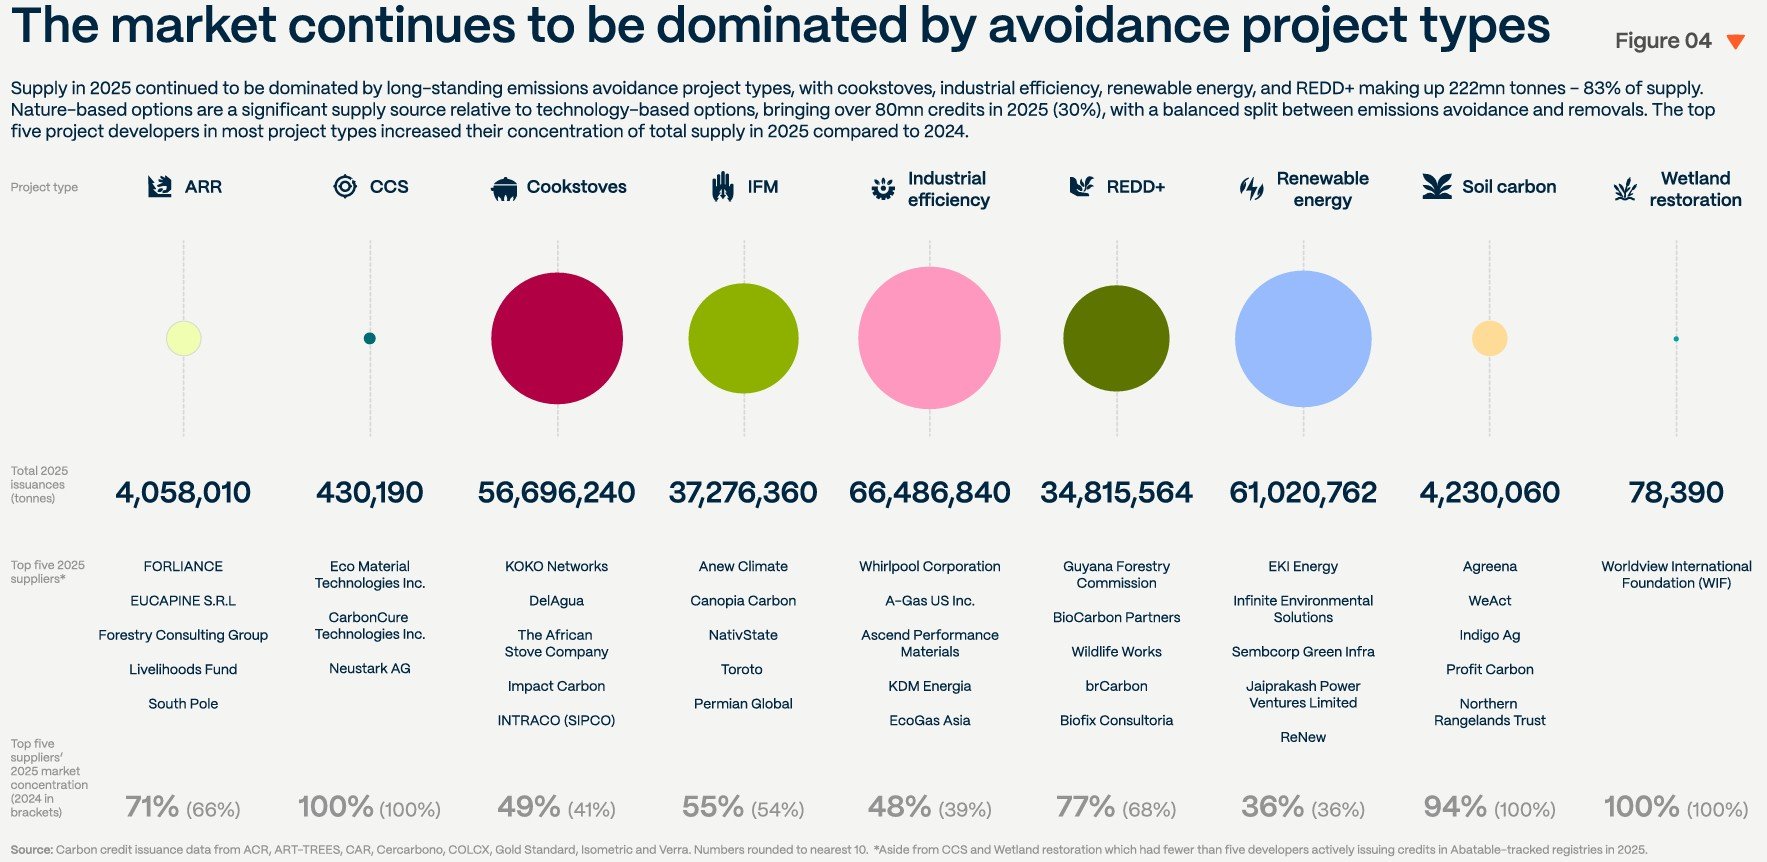
Avoidance projects still dominate supply. Cookstoves, industrial efficiency, renewable energy, and REDD+ accounted for 222 million tonnes, or 83% of supply in 2025.
Notably, forward pricing data show buyers paying premiums for higher-integrity methodologies, especially CCP-approved projects. Meanwhile, engineered removals remain scarce and expensive. Biochar leads in engineered supply offers. Other removal types mainly use forward contracts for trading.
As compliance markets such as GX-ETS and CORSIA expand, demand for eligible units may tighten supply and lift prices. For CORSIA alone, total First Phase demand is projected at 200–220 million tonnes.
Adding potential GX-ETS demand of 50–60 million tonnes per year changes the scale of market expectations.
2026: A Structural Realignment, Compliance and VCM Begin to Merge
The convergence between compliance and voluntary markets is no longer theoretical. Japan’s GX-ETS demonstrates a model where:
- A large national ETS covers over half of emissions
- Companies can use carbon credits for 10% of compliance
- Domestic and international credit systems integrate
- Integrity standards increasingly define eligibility
This integration creates predictable demand. It may also reduce reputational risk for buyers. Credits used in compliance systems face higher scrutiny.
For voluntary buyers, this strengthens signals around quality and durability, while for project developers, it offers more stable forward revenue. For policymakers, it creates flexibility without abandoning emissions caps.
The VCM deployed 55 million tonnes of high-quality credits through Abatable’s platform alone, across more than 200 companies
In 2026, the market looks more institutional. Forward contracting is rising, integrity standards are tightening, and compliance systems are opening to credit use.
Japan’s GX-ETS may prove to be the clearest sign yet that carbon markets are moving toward structured integration. If 2025 was about resilience, 2026 may be about alignment. And Japan is leading that shift.
- READ MORE: The Carbon Credit Market in 2025 is A Turning Point: What Comes Next for 2026 and Beyond?
The post 2026 Could Redefine Voluntary and Compliance Carbon Market Convergence, with Japan Leading the Way appeared first on Carbon Credits.
For most businesses, the emissions that matter most sit outside their own walls. Scope 3 emissions, everything generated across your value chain, from the suppliers who make your inputs to the customers who use your products, typically make up the majority of a company’s total carbon footprint. Under the Corporate Sustainability Reporting Directive (CSRD), those value-chain emissions now have to be measured and disclosed with a rigour that spend-based estimates alone struggle to satisfy. This guide sets out how to improve Scope 3 data accuracy for CSRD: the calculation methods open to you, how to move from estimates to verified supplier data, and how to govern that data so it holds up to audit.
![]()
A carbon credit is a commitment that extends well into the future. The tonne of CO₂ compensated for today from a nature-based carbon project must remain out of the atmosphere for good, which means the forest behind the credit has to remain standing long after the transaction is complete. For any buyer, this raises a defining question: What ensures that the forest endures?
![]()
What replaced the cheap REDD credit on the boardroom slide deck, and why procurement is leading the rewrite.
Three years ago, a corporate slide showing a portfolio of cheap REDD+ credits could carry a board meeting. The number was big, the price was low, and the press release wrote itself. Today, that same slide gets sent back with questions. The questions are uncomfortable, the answers are unclear, and your general counsel is suddenly in the room.
Conventional carbon offsets are not dead. The voluntary carbon market retired 202 million tonnes in 2025, and the Morgan Stanley Institute for Sustainable Investing survey published in January 2026 confirmed that interest from corporate buyers remains substantial. What changed is the credibility threshold. The integrity floor has risen, the disclosure scrutiny has tightened, and the buyer profile has shifted. This article tracks what changed, what sophisticated buyers now ask before signing, and what serious corporates are putting on the board slide instead.
What boards used to buy, and why it stopped working
The 2020 to 2022 model was simple: buy a large tranche of avoidance credits at low single-digit prices, retire them against the company footprint, announce the carbon-neutral claim, and move on. Most of those credits came from REDD+ projects, renewable energy installations in countries where the renewable energy was already economic, or methane projects with thin documentation.
Several things broke that model. Academic research published in 2023, including a widely cited Science paper, found that the majority of REDD+ credits issued under the most common methodologies did not represent additional reductions when tested against rigorous counterfactuals. The Voluntary Carbon Markets Integrity Initiative published its Claims Code of Practice, which sets requirements for what companies can credibly claim from credit use. The European Union finalised its Green Claims Directive, restricting how companies can describe products as climate-neutral. France’s Décret 2022-539 already restricts carbon neutrality advertising. California’s AB 1305 imposes disclosure requirements on any company making net-zero or carbon-neutral claims while doing business in the state.
The collective effect: the cheap credit no longer buys the announcement, and the announcement now carries litigation risk.
The integrity reset: ICVCM, VCMI, and what changed
The Integrity Council for the Voluntary Carbon Market published the Core Carbon Principles in 2023 and began assessing methodologies against them in 2024. The first methodologies received the CCP label later that year. The point of the label is to give corporate buyers a defensible quality screen they can cite in disclosure.
The Voluntary Carbon Markets Integrity Initiative complements this on the demand side. Its Claims Code of Practice defines what a buyer can say (Silver, Gold, or Platinum claims, with associated requirements) based on the quality of credits used and the underlying decarbonisation strategy. Together, CCP and VCMI build a quality stack: CCP on the supply, VCMI on the claim, with the science-based target sitting underneath both.
The reset is not a ban on offsets. It is a ratchet. Credits that meet the new bar continue to clear; credits that do not, do not. The Morgan Stanley survey found that 61% of current buyers like the CCP label concept but that supply of labelled credits remains limited. That supply constraint is now visible in pricing.
What sophisticated buyers ask before they sign
The questions on the procurement scorecard have changed. A 2022 buyer might have asked about price, vintage, and project type. A 2026 buyer asks five different questions before any of those.
- What does the counterfactual look like, and who validated it.
- What is the permanence regime, and what is the buffer pool exposure.
- What is the leakage risk, and how is it mitigated.
- What rating has the project received from the independent ratings agencies (Sylvera, BeZero, Calyx Global), and what was the rationale.
- What is the documentation discipline that survives an audit four years from now when the procurement team that signed the contract has moved on.
If the vendor cannot answer those five questions on a first call, the conversation ends. Conversely, if the vendor can answer them with documented specificity, the conversation often expands beyond a single transaction toward a multi-year engagement.
Where this leaves your near-term commitments
You probably have near-term commitments that pre-date the integrity reset. Public targets to be carbon neutral by 2025 or 2030. Product-level claims that ran in last year’s marketing. Disclosed reduction trajectories that assumed continued access to cheap credits.
You have three workable paths. The first is to re-baseline your strategy, replacing the most exposed credits with higher-quality alternatives and adjusting the public language to match what you can defend. The second is to shift the underlying spend from offsetting outside your value chain to investing inside your value chain, where reductions count against Scope 3 directly and the audit trail is cleaner. The third is to keep the strategy and absorb the risk, which is increasingly the most expensive option once you price in litigation, restatement, and reputational exposure.
Most serious buyers are choosing the second path. It moves the carbon spend from a compliance cost to a procurement and resilience investment, and it removes the central failure point of the legacy model: the disconnect between where the emissions occurred and where the reductions sat. Nature-based supply chain investments, structured under the GHG Protocol Land Sector and Removals Standard and aligned to the SBTi FLAG Guidance, are the asset class that fits this brief. They generate inventory-grade reductions, they produce audit-grade documentation, and they survive the new claim restrictions because the carbon math sits inside the value chain that the disclosure already covers.
If you are reassessing a carbon strategy under the new integrity bar, or rebuilding a board narrative that has to survive a more skeptical audience, the carbon and sustainability experts at Carbon Credit Capital can help. The Dual-Value Model gives you a defensible alternative to legacy offset purchases, with the documentation and operational integration that survives the procurement scorecard and the audit. Schedule a consultation.


-
Climate Change11 months ago
Guest post: Why China is still building new coal – and when it might stop
-
Greenhouse Gases11 months ago
Guest post: Why China is still building new coal – and when it might stop
-

 Greenhouse Gases2 years ago
嘉宾来稿:满足中国增长的用电需求 光伏加储能“比新建煤电更实惠”
-

 Climate Change2 years ago
嘉宾来稿:满足中国增长的用电需求 光伏加储能“比新建煤电更实惠”
-
Climate Change2 years ago
Bill Discounting Climate Change in Florida’s Energy Policy Awaits DeSantis’ Approval
-

 Renewable Energy9 months ago
Sending Progressive Philanthropist George Soros to Prison?
-

 Carbon Footprint2 years ago
US SEC’s Climate Disclosure Rules Spur Renewed Interest in Carbon Credits
-
Greenhouse Gases1 year ago
嘉宾来稿:探究火山喷发如何影响气候预测