


The U.S. biofuel industry stepped into 2026 with strong policy backing and rising demand. However, global events quickly changed the tone. A sharp escalation in the US–Israel–Iran conflict in late February sent shockwaves through energy markets. Oil prices jumped, supply chains tightened, and uncertainty spread across fuel markets.
At the same time, the U.S. Environmental Protection Agency (EPA) introduced its most ambitious biofuel policy yet under the Renewable Fuel Standard (RFS). This created a powerful but complicated mix—long-term policy certainty collided with short-term geopolitical chaos.
As a result, the U.S. biofuel sector now faces a defining moment. Growth looks strong on paper, but rising costs and market volatility are testing how sustainable that growth really is.
EPA Administrator Lee Zeldin said:
“President Trump promised a Golden Age of American agriculture. Once again, his administration is delivering. Overall, ‘Set 2’ creates a larger, more stable, and more reliable domestic market for U.S. crops, strengthening farm income and rural economies.
For 20 years, this program has diversified our nation’s energy supply and advanced American energy independence. EPA is proud to deliver on this mission and to do so at historic levels.”
EPA’s RFS ‘Set 2’ Rule Changes the Game
Amid this volatility, U.S. policy took a decisive turn. On March 26, 2026, the EPA finalized the Renewable Fuel Standard (RFS) “Set 2” rule, setting new blending targets for 2026 and 2027.
- The new requirements are the highest in the program’s history. The EPA set total renewable volume obligations at 26.81 billion RINs for 2026 and 27.02 billion RINs for 2027.
These targets reflect a major increase compared to previous years and signal a strong push toward domestic biofuel production.
- The policy focuses heavily on expanding the use of biomass-based diesel, including biodiesel and renewable diesel. This includes a 70 percent reallocation of small refinery exemptions granted for 2023–2025
- At the same time, ethanol blending levels remain stable at 15 billion gallons annually, providing consistency for corn producers.
Additionally, the rule puts back 70% of the biofuel volumes that small refineries didn’t have to blend from 2023 to 2025. This effectively increases the burden on refiners while ensuring that biofuel demand remains strong.
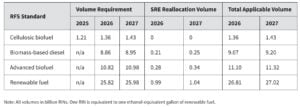
Policy Pivot Favors U.S. Biofuel Producers
Beyond volume targets, the EPA introduced structural changes. The agency removed renewable electricity from the RFS program, narrowing its focus to liquid and gaseous fuels. It also introduced measures to limit the role of foreign feedstocks in the future.
Starting in 2028, imported biofuels will receive a lower compliance value compared to domestic products. In addition, incentives such as the 45Z tax credit are designed to favor U.S.-based production.
The broader goal is clear. The policy aims to strengthen energy independence, support farmers, and reduce reliance on foreign oil. Estimates suggest that these measures could cut oil imports by hundreds of thousands of barrels per day over the next two years.
At the same time, the EPA expects significant economic benefits. The rule could generate billions of dollars for rural economies and create thousands of new jobs across agriculture and manufacturing sectors.
The U.S. Energy Information Administration (EIA) recently published updated data on the country’s biofuel production capacity, shown below.
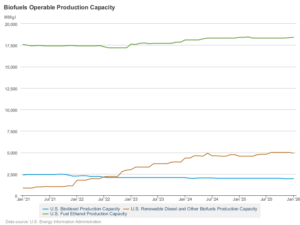
Demand Surges but Supply Faces Pressure
While policy is driving demand higher, supply conditions remain tight. The U.S. biofuel market is projected to exceed $41 billion in 2026, supported by transportation demand and decarbonization goals.
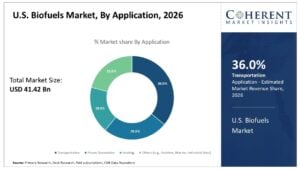
Ethanol continues to dominate the market, especially through E10 fuel blends. However, advanced biofuels such as renewable diesel and SAF are growing faster due to stronger policy incentives and rising interest in low-carbon fuels.
Despite this growth, feedstock availability is becoming a major concern. Domestic sources such as soybean oil, used cooking oil, and tallow are under pressure. Prices have risen sharply due to limited supply and increased competition from both the fuel and food industries.
At the same time, import restrictions have reduced access to cheaper global feedstocks. Tariffs and lower compliance values for foreign inputs are shifting the market toward domestic sourcing. While this supports local producers, it also reduces flexibility during supply shortages.
New processing capacity is helping to ease some of the pressure. Agribusiness companies are expanding oilseed crushing operations, and renewable diesel plants are increasing output. However, these efforts may take time to fully balance supply and demand.
War-Driven Oil Shock Makes Biofuels More Valuable
The U.S. biofuel market is gaining momentum as rising oil prices and global conflict reshape energy choices. The ongoing U.S.-Israel-Iran war has disrupted key oil infrastructure and shipping lanes near the Strait of Hormuz, sending crude prices sharply higher.
As conventional fuels become more expensive, alternatives like ethanol, renewable diesel, and sustainable aviation fuel (SAF) are increasingly attractive, driving demand across the sector. This surge has pushed feedstock costs to multi-year highs, with soybean oil, used cooking oil, and animal fats climbing steadily.
At the same time, renewable fuel credits, or RINs, have reached levels not seen in years, boosting margins for biofuel producers but raising compliance costs for refiners. Reports from Argus Media show that U.S. renewable diesel feedstocks hit their highest prices in over two years this month, highlighting the market’s sensitivity to war-driven disruptions.
While industry groups argue that strong domestic production stabilizes supply and reduces reliance on imported oil, refiners warn that these rising costs could eventually reach consumers, especially in regions with less competition. The combination of strong demand, tight supply, and geopolitical risk is redefining U.S. biofuel market dynamics.
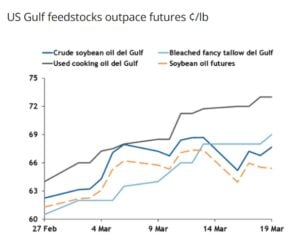
Opportunities for Farmers, Challenges for Refiners
The current landscape is creating both opportunities and challenges.
Biofuel producers and farmers are seeing strong benefits. Higher demand for crops like corn and soybeans is supporting agricultural incomes. Investment in renewable fuel projects is also increasing, driven by policy certainty and market growth.
However, refiners and fuel distributors are facing tighter margins. The cost of compliance, combined with volatile feedstock prices, is making operations more difficult. Smaller players may struggle to compete in this environment.
Consumers could also feel the impact through higher fuel prices, especially if cost pressures continue. To manage these risks, many companies are turning to hedging strategies. Storage, long-term contracts, and flexible sourcing are becoming essential tools in navigating market uncertainty.
Supporting this announcement, U.S. Secretary of Agriculture Brooke L. Rollins, said:
“Today’s announcement is truly historic for our nation’s farmers and energy producers. These numbers represent the highest levels of biofuels ever required to be blended into our fuel supply. With President Trump and Administrator Zeldin’s leadership, these historically high volumes are expected to create a $3 to $4 billion dollar increase in net farm income. The Renewable Fuel Standard Set 2 Rule will create a $31 billion dollar value for American corn and soybean oil for biofuel production in 2026, which is $2 billion more than in 2025. Our farmers are stepping up to grow American energy dominance.”
Strong Growth, But Uncertain Path
Looking ahead, the U.S. biofuel market is expected to grow steadily, with projections showing annual growth of up to 10% through the next decade. Strong EPA mandates and supportive policies will continue to drive demand.
However, the path forward is far from stable.
The mismatch between long-term policy goals and short-term geopolitical disruptions will remain a key challenge. Events like the ongoing Middle East conflict can quickly shift market dynamics, creating sudden price swings and supply risks.
The rest of 2026 will depend on several key factors, including potential EPA waivers, movements in RIN markets, and developments in global energy supply. In the end, the success of U.S. biofuels will depend on balance. Policy support provides a strong foundation, but flexibility will be critical in managing real-world challenges.
Despite the industry growing fast, the question remains—can it handle the pressure of both policy ambition and global uncertainty at the same time?
The post U.S. Biofuel Market 2026: Can EPA Policies Offset War-Driven Volatility? appeared first on Carbon Credits.

What auditors actually test, where projects actually fail, and the contract clauses that protect you before signature.
The meeting happens about fourteen months after the contract was signed. Your assurance provider has reached the nature-based investment line in your Scope 3 file, and the partner across the table has exactly two questions. How do you know the reductions happened? And how do you know they would not have happened anyway?
The first question is MRV: measurement, reporting, and verification. The second is additionality. Between them, they decide whether your nature-based investment counts, in your inventory, in your disclosure, and in front of your board. Everything else in the project documentation is supporting material for these two answers.
This article walks through what each question actually tests, where projects most commonly fail, what digital MRV has changed (and what it has not), and the contract clauses that protect you. The goal is to give you the diligence framework before you sign, because after the credit issues is the wrong time to discover the answers were weak.
What MRV actually verifies
MRV is the machinery that turns a field intervention into a defensible number. Measurement covers the data: biomass surveys, soil sampling, remote sensing, activity records from participating farms. Reporting covers the translation of that data into claimed reductions under a recognised methodology. Verification covers the independent check: an accredited third party tests the reporting against the methodology and the evidence.
The methodologies live in registries. Verra’s Verified Carbon Standard and the Gold Standard are the two largest for nature-based projects, and each publishes the methodology documents, monitoring requirements, and verification protocols that a project must follow. The ICVCM Assessment Framework now sits above the registries, assessing whole methodologies against the Core Carbon Principles and granting the CCP label to those that pass.
For a buyer, the practical questions are concrete. What is the monitoring frequency, and is it specified in the project design document or left vague? Who is the verifier, how were they selected, and how often do they rotate? What raw data do you, the buyer, get access to, and in what format? A project that answers these in writing is a different procurement than one that answers them in a sales call.
What additionality actually proves
Additionality asks whether the intervention caused the reduction, or whether the reduction would have happened anyway. The test is a counterfactual: what would this landscape, this farm, this forest have done without the project’s money?
Three forms matter in practice. Financial additionality asks whether the project needed the carbon revenue to proceed. Regulatory additionality asks whether the activity was already required by law. Common-practice additionality asks whether the activity is already standard in the region, in which case paying for it buys you nothing the world was not getting for free.
The reason additionality dominates audit conversations is recent history. Research published in 2023, including the Science paper examined at length in our piece on conventional offsets and boardroom credibility, found that a large share of REDD+ credits failed the counterfactual test because baselines were inflated. The market response was a wave of methodology revisions at Verra and the arrival of independent ratings agencies whose entire business is re-testing additionality claims. The Carbon Credit Quality Initiative publishes transparent scoring of methodologies on exactly this dimension, and it is free to consult before you sign anything.
Where projects most commonly fail the test
Five failure modes account for most of the wreckage.
- Inflated baselines. The counterfactual assumes more deforestation, more degradation, or lower yields than the evidence supports. The claimed reduction is the gap between reality and the baseline, so an inflated baseline manufactures reductions from nothing.
- Unaccounted leakage. The project protects one forest and the logging moves to the next valley. The methodology is supposed to net this out; weak projects estimate it optimistically.
- Thin permanence protection. Nature-based carbon can reverse: fire, pest, drought, or a change of landowner. Buffer pools and insurance mechanisms exist for this, but their adequacy varies enormously between projects.
- Attribution and double counting. In supply chain settings, the same reduction can be claimed by the supplier, the buyer, and a credit purchaser unless contracts prevent it. Our Insetting vs Offsetting piece covers the inventory rules; the point here is that the auditor will ask who else is counting this tonne.
- Stale monitoring. Data collected at validation and never refreshed. The IPCC AR6 Working Group III land-sector chapter documents how quickly carbon stocks respond to disturbance; a three-year-old measurement is a historical artifact, not a current claim.
What digital MRV changes, and what it does not
Digital MRV is the genuine improvement in the field. Satellite remote sensing, including the free archives at NASA Earthdata, allows biomass and land-cover change to be monitored continuously rather than at multi-year verification intervals. Soil carbon models calibrated with physical sampling reduce the cost of agricultural measurement. The practical effect is more frequent data at lower cost, which compresses the window in which a problem can hide.
What digital MRV does not change is judgment. Baselines are still human decisions about counterfactuals. Additionality is still an argument, not a measurement. Research groups such as the Oxford Smith School have been clear on this point: better sensors improve the M in MRV, but the integrity questions live in the assumptions, and assumptions need governance, not gadgets.
For a buyer, the test is simple. Ask the provider what is measured by instrument, what is estimated by model, and what is assumed by methodology. A provider who can answer that question crisply understands their own evidence chain. A provider who cannot is selling you their confidence rather than their data.
What to require in your contract
The diligence above converts into five contract clauses.
- Monitoring cadence and buyer data access, specified by dataset and frequency.
- Verifier independence, named accreditation, and rotation terms.
- Baseline revision triggers, so the counterfactual updates when the methodology or the evidence changes.
- Reversal liability and buffer adequacy, with the mechanism named and sized.
- Documentation handover in audit-ready form, so the evidence file your assurance provider needs already exists.
None of these clauses is exotic. All of them are absent from weak contracts, and their absence is the most reliable early signal that the MRV and additionality answers will be weak too.
If you are evaluating a nature-based investment and want the MRV and additionality stress-tested before signature rather than after, the carbon and sustainability experts at Carbon Credit Capital can run that review against any project on your shortlist, and design nature-based supply chain investments where the evidence chain is built audit-first. Schedule a consultation.
Sources and further reading
- ICVCM: Core Carbon Principles Assessment Framework
- Verra: Verified Carbon Standard
- Gold Standard for the Global Goals
- Carbon Credit Quality Initiative: Methodology quality scores
- University of Oxford Smith School: Sustainable finance research
- IPCC AR6 Working Group III, Chapter 7: AFOLU
- NASA Earthdata satellite remote sensing archive
EU Directive: Empowering Consumers for the Green Transition (ECGT)
The EU Directive, Empowering Consumers for the Green Transition (ECGT), takes effect on September 27, 2026.(1) The goal of ECGT is to protect consumers by ensuring that environmental claims are fair, understandable, and reliable. This regulation does create a new compliance requirement for businesses, but it also provides sustainability and marketing teams with important guidance that helps create consistency in sustainability communications.
Key takeaways
- ECGT takes effect September 27, 2026, and prohibits claims that a product or service has a neutral, reduced, or positive environmental impact based on offsetting alone.
- Named example phrases the regulation prohibits include climate neutral, CO2 neutral certified, carbon positive, climate net zero, climate compensated, reduced climate impact, and limited CO2 footprint.
- ECGT does not want to deter investment in carbon credits. It wants companies to communicate the real benefits of the projects they support instead.
- SBTi’s guidance recommends framing carbon credits as taking responsibility for ongoing emissions, not as making a product or company neutral.
- Voluntary carbon projects deliver real climate progress: reducing super-pollutants, protecting and restoring ecosystems, and supporting communities.
Regarding carbon credits specifically, voluntary carbon projects deliver important climate progress and environmental benefits that provide many talking points for companies. They reduce climate super-pollutants by removing industrial emissions like methane, N2O, HFCs and others. They protect and restore valuable ecosystems and carbon sinks like forests, mangroves and grasslands. They help communities by reducing local pollution, creating employment opportunities, improving access to healthcare, and more.
The Science Based Targets Initiative (SBTi), a global leader in business climate action, concludes that alongside aggressive decarbonization, we should also use high quality carbon credits to take responsibility for our ongoing emissions. SBTi recognizes that carbon credits are important “to help limit temperature overshoot, mitigate transition risks, and support climate solutions.”(2)
ECGT language on carbon offsetting says that they do not want to deter investment in carbon credits. They just want companies to focus on communicating the benefits of the projects they support and avoid claims beyond the scope of carbon credits, which is good for everyone, companies and consumers alike.
The regulation reinforces that carbon credits do not change the sustainability of your products, so carbon credit buyers should not suggest that their products are more sustainable because of carbon credits. Instead, companies need to promote their climate contributions as a way to compensate or take responsibility for their carbon emissions by supporting projects that do great things like reducing global carbon emissions, reducing pollution, preventing deforestation, restoring forests, and more.
ECGT language related to carbon offsetting
The regulation is particularly focused on prohibiting claims, based on offsetting greenhouse gas emissions, that a product or service has a neutral, reduced, or positive impact on the environment in terms of greenhouse gas emissions. These claims are prohibited in all circumstances because they mislead consumers into believing the claim relates to the product itself, or to how it was made and supplied, or into thinking that using the product carries no environmental impact at all.
Named examples of prohibited claims include:
- climate neutral
- CO2 neutral certified
- carbon positive
- climate net zero
- climate compensated
- reduced climate impact
- limited CO2 footprint
These claims are only allowed when they rest on a product’s actual lifecycle impact, not on offsetting emissions outside that product’s value chain, since the two are not equivalent. This prohibition does not stop companies from advertising their investments in environmental initiatives, including carbon credit projects, as long as they present that information in a way that is not misleading and that meets the other requirements of Union law.(1)
SBTi also provides guidance on climate contribution language in its Corporate Net Zero Standard Version 2.0 Draft for Second Public Consultation, November 2025. While the SBTi language is fairly technical, it has a good framework for crafting a climate contribution message.
SBTi Language for Carbon Credits(3)
- Take responsibility for ongoing emissions by delivering mitigation impact contributions
- Carbon credits certify the mitigation outcomes of projects that reduce, avoid, or remove carbon emissions
- Activities that reduce emissions from emission sources not located within the company’s value chain
- Activities that conserve, protect, and enhance natural carbon sinks
- Activities that capture and store carbon in storage pools
SBTi’s draft standard also walks through sample claim language for this kind of contribution. In general, the samples move from a simple percentage statement, to naming a specific verified tonnage tied to that percentage, to a fuller statement that breaks the tonnage into reductions versus removals. Across all three, the framing stays consistent: a company took responsibility for a defined share of its ongoing emissions over a set period, by funding a specific, verified amount of mitigation, achieved through emission reductions or removals.(3)
FAQ: ECGT and Carbon Credit Claims
When does the ECGT directive take effect?
The rules apply across the EU from September 27, 2026, after member states transposed the directive into national law by March 27, 2026.
Does ECGT ban carbon offsetting?
No. It bans specific marketing claims that a product or service is environmentally neutral, reduced impact, or positive based on offsetting. Advertising investment in carbon credit projects themselves is still allowed if it is not misleading.
What phrases does ECGT specifically prohibit?
Named examples include climate neutral, CO2 neutral certified, carbon positive, climate net zero, climate compensated, reduced climate impact, and limited CO2 footprint, when those claims are based on offsetting rather than a product’s actual lifecycle impact.
How should a company describe its carbon credit purchases instead?
SBTi’s guidance recommends stating the specific verified tonnage of emissions reductions or removals funded and describing that as taking responsibility for a defined share of ongoing emissions, rather than claiming the company or product is neutral.
Does this rule apply to company level sustainability claims too?
ECGT is focused on claims about specific products and services in consumer marketing. Broader company level sustainability communication is a separate matter still governed by other existing rules.
While ECGT does add a new compliance burden for businesses, it helps create consistency in sustainability messaging that is important to building confidence in voluntary carbon projects and scaling the industry to help us achieve progress on global carbon emissions.
Disclaimer: Terrapass does not provide legal or regulatory advice. Any interpretation of regulation must be approved by your legal representative.
References:
(1) https://eur-lex.europa.eu/eli/dir/2024/825/oj
(2) https://files.sciencebasedtargets.org/production/files/Corporate-Net-Zero-Standard-version-2.pdf
(3) https://files.sciencebasedtargets.org/production/files/CNZS-V2-Second-Consultation-Draft.pdf
The post The EU’s New Green Claims Rules and Carbon Credits appeared first on Terrapass.

Most businesses that decide to act on their net-zero targets reach the same point of friction. Buying carbon credits has meant tracking down brokers, sitting through sales calls, and requesting a quote just to learn a price, sometimes with limited proof of what you are buying.




-

 Greenhouse Gases2 years ago
嘉宾来稿:满足中国增长的用电需求 光伏加储能“比新建煤电更实惠”
-
Climate Change1 year ago
Guest post: Why China is still building new coal – and when it might stop
-
Greenhouse Gases1 year ago
Guest post: Why China is still building new coal – and when it might stop
-

 Climate Change2 years ago
嘉宾来稿:满足中国增长的用电需求 光伏加储能“比新建煤电更实惠”
-

 Renewable Energy11 months ago
Sending Progressive Philanthropist George Soros to Prison?
-
Climate Change2 years ago
Bill Discounting Climate Change in Florida’s Energy Policy Awaits DeSantis’ Approval
-
Greenhouse Gases1 year ago
嘉宾来稿:探究火山喷发如何影响气候预测
-

 Carbon Footprint2 years ago
US SEC’s Climate Disclosure Rules Spur Renewed Interest in Carbon Credits