

Nickel has moved from being a niche industrial metal to a critical pillar of the global energy transition, along with copper, lithium, and uranium.
Once primarily used in stainless steel, nickel is now critical for high-energy-density batteries, electric vehicles (EVs), grid storage, aerospace alloys, and emerging hydrogen infrastructure.
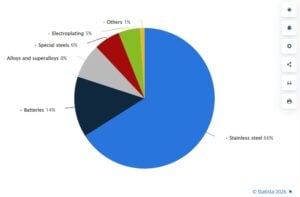
Essentially, it’s now another mineral on that list, albeit one that seems to have largely flown under most investors’ radars thus far. However, it’s understandable why that’s been the case – after all, the primary use for mined nickel has long been industrial, with over three-quarters of global nickel demand being for things like alloy production or electroplating.
Distribution of primary nickel consumption worldwide in 2024, by industry
Nickel Basics: Types, Grades, and Industrial Uses
Nickel is a silvery-white transition metal with high corrosion resistance, ductility, and thermal stability. Its unique properties make it indispensable in alloys and electrochemical applications.
Nickel is generally classified into two main categories:
- Class 1 nickel: High-purity nickel metal, powders, briquettes, and salts such as nickel sulfate. These are essential for battery cathodes, advanced alloys, and aerospace applications.
- Class 2 nickel: Ferronickel and nickel pig iron (NPI), primarily used in stainless steel production.
Historically, stainless steel accounted for roughly two-thirds of nickel consumption, providing a stable demand base. However, batteries have emerged as the fastest-growing segment, particularly for nickel-rich cathode chemistries such as NMC (nickel-manganese-cobalt) and NCA (nickel-cobalt-aluminum).
Aerospace, defense, and superalloys also rely heavily on nickel for high-temperature and corrosion-resistant applications.
This dual-market nature—spanning bulk industrial use and high-tech energy transition applications—makes nickel one of the most structurally complex metals in the critical minerals ecosystem.
Nickel Processing Technologies: The Backbone of the EV and Steel Boom
Not all nickel is equal, and processing technology determines where it ends up. Nickel processing is the set of industrial methods used to extract nickel from its ores and turn it into usable forms for various industries, including stainless steel, batteries, and alloys. Essentially, it’s how raw nickel in rocks becomes the high-purity metal or chemical compounds needed for manufacturing.
Nickel is mined mainly from two types of ores:
- Sulfide ores – Found deep underground, easier to process, high purity.
- Laterite ores – Found near the surface, lower nickel content, more challenging to process.
The Case Of Battery Grade Nickel
In order to be used in an electric vehicle, nickel must first be refined to extremely high purities, creating what’s known as “battery grade” nickel. Following this, it then needs to be dissolved in sulphuric acid to create nickel sulphate, which can then be used to produce battery cathodes.
Nickel’s high energy density, which allows it to hold more charge for less weight, makes high-nickel battery chemistries more desirable in EV batteries. While the first iterations of the lithium-ion battery used equal proportions of nickel, manganese, and cobalt, modern ones use as much nickel as manganese and cobalt combined.
And as technology continues to progress, it’s expected that the ratio will rise to as much as 80% nickel, or even more.
Now here’s a simple breakdown of the processing technologies:
Pyrometallurgy Still Dominates Stainless Steel
High-temperature smelting remains the most common route for nickel extraction. Rotary kiln–electric furnace (RKEF) and flash smelting convert sulfide and laterite ores into ferronickel or nickel pig iron (NPI). These products suit stainless steel, but they consume large amounts of energy and emit significant CO₂.
Notably, NPI and ferronickel continue to anchor global supply.
Hydrometallurgy Powers Battery-Grade Nickel
Hydrometallurgical routes, especially high-pressure acid leaching (HPAL), are becoming critical for EV batteries. HPAL converts laterite ores into mixed hydroxide precipitate (MHP) and then into nickel sulfate for cathodes.
Refining and Recycling Gain Momentum
Electrorefining and solvent extraction deliver high-purity Class 1 nickel. Refined products made up around 60% of the nickel market in 2024. Recycling is also rising as a low-carbon supply source.
In short, nickel processing is splitting into two markets: low-cost NPI for steel and high-purity nickel for batteries. This divide is reshaping supply chains, investment flows, and decarbonization strategies across the metals industry.
The Volatile Nickel Price Cycle
Unlike lithium, the nickel market is much more complex. The metal sits at the crossroads of geopolitics, industrial demand, and changing battery technology. Over the past five years, nickel prices have been highly volatile.
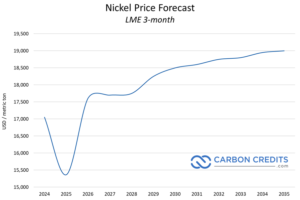
For example, during the 2022 LME squeeze, prices spiked above $100,000 per tonne. Then they dropped sharply to around $13,900 per tonne in early 2025.
- Since then, they have started to recover, reaching about $17,200 per tonne by February 2026.
This volatility shows how sensitive nickel is to supply, demand, and global events. As EV demand grows, the nickel market will continue to face swings.
This volatility reflects a structural mismatch between supply expansion and shifting demand patterns. Massive Indonesian production growth has flooded the market, while battery chemistry trends toward lithium iron phosphate (LFP) have reduced nickel intensity in mass-market EVs. At the same time, premium EVs and aerospace applications continue to rely heavily on Class 1 nickel, creating a bifurcated market structure.
For investors, policymakers, and corporates, nickel represents a critical test case for the energy transition economy. Understanding its supply chain, macro drivers, and long-term price scenarios is essential for navigating the next decade of critical minerals markets.
Global Nickel Supply: Indonesia’s Dominance and Market Impact
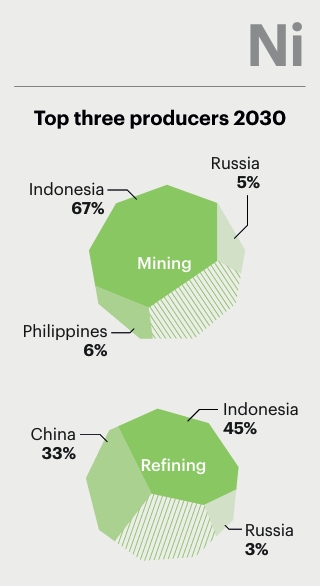
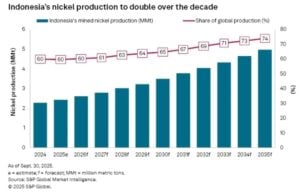
Indonesia has reshaped the global nickel market more than any other country. In 2024, its nickel in mine production was 2.2 million tonnes (mt), an increase of 158% over the previous five years. Its rise was fueled by a combination of raw-ore export bans, massive Chinese-backed investments in downstream processing, and the rapid deployment of high-pressure acid leach (HPAL) facilities for battery-grade nickel.
By consolidating both mining and smelting, Indonesia has established a vertically integrated nickel ecosystem capable of supplying both stainless steel and battery markets at low cost.
Policy Controls and Quota Management
Despite its dominance, Indonesia’s nickel supply faces tightening government controls in 2026. The government sharply reduced the nickel ore production quota (RKAB) to 250–260 million wet metric tonnes (wmt), down from 379 million wmt in 2025 and 298 million wmt initially approved for 2025—a cut of roughly 34%.
The move aims to align ore output with domestic smelter capacity, curb oversupply, and support prices. Following the announcement, LME nickel prices surged past $18,000/t before stabilizing near $17,200/t in February 2026.
Delays in RKAB approvals have already halted operations at mines such as PT Vale Indonesia, signaling enforcement risks for the policy. Meanwhile, demand growth is tempered by slower stainless steel uptake and the structural shift toward LFP batteries, which has helped sustain a global surplus forecast of 261–288 kt in 2026 despite production cuts.
Indonesia’s strategic approach—resource nationalism, controlled expansion, and downstream integration—has fundamentally altered global nickel pricing. Low production costs and government-backed industrial policy allow Indonesian producers to remain profitable even during periods of weak prices.
- However, S&P Global noted that, “Indonesia is still projected to more than double its production over the next decade to an estimated 4.97 MMt by 2035.”
China’s Role in the Nickel Supply Chain
China continues to dominate the processing of nickel intermediates and battery materials. Chinese firms have financed and built much of Indonesia’s upstream infrastructure, including HPAL plants and mixed hydroxide precipitate (MHP) facilities.
It is also the single largest consumer of nickel, driven by domestic stainless steel production and battery manufacturing. Policy shifts, stimulus measures, and industrial planning decisions in China have an outsized impact on global nickel markets, influencing both price and supply chain dynamics.
Other Global Producers
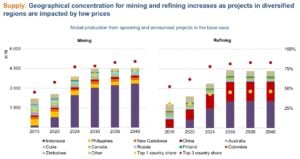
Beyond Indonesia and China, major nickel-producing countries include Russia, the Philippines, Canada, Australia, and New Caledonia. However, many high-cost producers have struggled to compete with Indonesia’s integrated, low-cost production model. For example, BHP suspended operations at its Nickel West facility in Western Australia amid persistent low prices, highlighting the competitive pressures faced by high-cost producers.
This dynamic has accelerated consolidation in the global nickel industry, with strategic repositioning focused on securing downstream processing and high-grade nickel for energy transition applications.
Nickel Demand Dynamics: Stainless Steel vs. Batteries
Stainless Steel: The Legacy Anchor
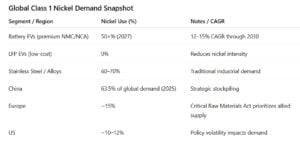
Stainless steel remains the primary driver of nickel demand, accounting for roughly two-thirds of consumption. Demand is closely tied to construction, infrastructure, and manufacturing activity. China, the world’s largest stainless steel producer, remains a key macro driver for nickel demand globally.
Class 1 Nickel: Powering the EV Boom
Nickel demand for batteries has grown fast over the past decade. Class 1 nickel, with purity above 99.8%, is key for high-energy NMC and NCA batteries. These batteries power premium EVs, giving longer driving ranges and lighter, more efficient vehicles. Advanced cathodes now contain 60–80% nickel, with some designs targeting 90%+ nickel content.
By 2030, nickel-heavy batteries could reach 1,320 MWh globally, covering about 80% of all EV lithium-ion batteries. Battery demand is expected to use over 50% of Class 1 nickel by 2027, growing at 12–15% per year. The average EV battery now contains 28–30 kg of nickel.
But there are risks:
-
LFP batteries, which contain no nickel, are growing in lower-cost EVs, especially in China. Nickel intensity per vehicle has fallen nearly one-third since 2020.
-
Policy differences affect supply: China held 63.5% of global nickel demand in 2025, Europe prioritizes allied supply, and US policies are less stable.
The Lights Are Green for Nickel
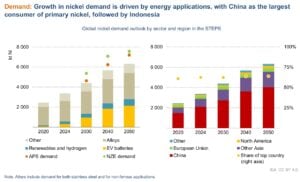
Forecasts from the International Energy Agency (IEA) project nickel demand more than doubling by 2035 under current pledges, potentially tripling in net-zero scenarios driven by EVs and storage.
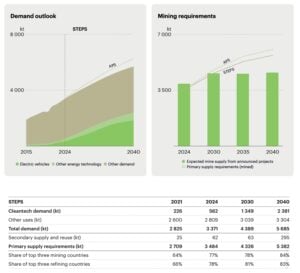
IEA also projects that nickel use in EV batteries, renewables, and stainless steel is projected to push nickel demand above 5.5 Mt by 2035. As Indonesia tightens output and China dominates downstream processing, Western economies face rising exposure to supply disruptions and geopolitical leverage. Even conservative outlooks show 8-9x EV battery demand growth by 2050, despite late-decade plateaus from chemistry shifts.
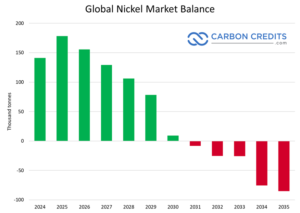
Long-Term Supply Outlook: From Oversupply to Potential Deficit
As per INSG last year, supply vastly outpaced demand, hitting 209-212 kt global surplus. Recently, S&P Global projected a 156,000-tonne surplus in 2026. However, the same analysis also says that today’s surplus will not last forever.
The report projects that global nickel stocks will peak around 2028. After that, inventories will begin to fall as demand improves and supply growth slows. By the early 2030s, the market balance will flip.
By 2031, S&P Global expects the primary nickel balance to turn negative. EV battery demand will grow as electrification expands. Stainless steel consumption will recover alongside global manufacturing. Significantly, Indonesian supply growth will slow as easy expansions may run out, and regulatory risks can increase.
Once inventories drop below comfortable weeks-of-consumption levels, prices respond quickly. S&P Global points to nickel prices rising toward $25,000 per tonne or higher, especially for Class 1 material.
Policy and Geopolitics: Resource Nationalism and Market Fragmentation
Indonesia exemplifies modern resource nationalism. The government’s export bans, production quotas, and mine suspensions aim to capture downstream value and stabilize prices.
Western governments are responding with critical minerals strategies, including subsidies, domestic mining support, and restrictions on Chinese supply chains. This could fragment the global nickel market into competing blocs, heightening geopolitical risk for downstream industries.
Most importantly, the Trump administration sees developing U.S. nickel supply chains as key to reducing dependence on foreign sources and boosting the domestic industry. Efforts include promoting new mining projects, speeding up permits for critical mineral operations, and exploring tariffs or other trade measures to support local production. One major example is a copper-nickel project in Minnesota, led by a joint venture between Glencore and Teck Resources.
Macro Drivers: Energy Transition, Industrial Demand, and Monetary Policy
Nickel is highly sensitive to macroeconomic and policy conditions. Industrial demand tracks global manufacturing cycles, while battery demand depends on EV adoption rates, subsidies, and consumer behavior.
Interest rates, inflation, and currency fluctuations affect nickel through speculative flows and production financing costs. Meanwhile, energy transition policies, carbon pricing, and ESG mandates are reshaping supply chains, pushing automakers and battery manufacturers to secure long-term nickel supply agreements.
Nickel’s Role in Carbon Markets and Net-Zero Strategies
Nickel’s importance extends beyond industrial use. Battery supply chains are central to decarbonization, embedding nickel demand in national net-zero strategies. Companies increasingly link nickel sourcing to ESG frameworks, carbon disclosure requirements, and sustainability-linked financing.
At the same time, nickel production drives greenhouse gas (GHG) emissions. According to a disclosure from the International Finance Corporation (World Bank Group), under a scenario accounting for declining ore grades and cleaner grids, emissions could rise 90% from 2020 to 2050. Additionally, a lack of decarbonization could push emissions to 164%.
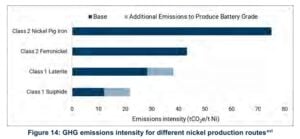
Most emissions come from processing rather than mining. Pyrometallurgical routes for Class 2 nickel (used in stainless steel) are coal-intensive, while Class 1 battery-grade nickel has lower emissions. Shifting to EV-focused, Class 1 production can help limit emissions growth.
Thus, cleaner processing, low-carbon production, and recycling could give automakers and battery makers a competitive edge, while decarbonized electricity is key to controlling nickel emissions as production rises.
Top 3 Nickel Producers Signal Tight Supply Heading into 2026
The global nickel market entered 2026 with cautious signals from its largest producers. Industry analysts revealed that mining output stayed broadly flat, disruptions persisted, and companies focused more on battery-grade processing than expanding supply. This reinforced expectations of a structurally tight nickel market.
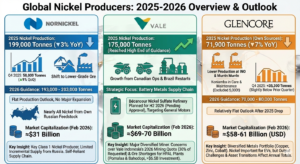
Nornickel
Norilsk Nickel, or Nornickel, reported stable but slightly lower production in 2025. The company produced 199,000 tonnes of nickel, down 3% year-on-year, mainly due to a shift toward lower-grade disseminated ore. Production recovered in the fourth quarter, rising 9% quarter-on-quarter to 58,000 tonnes after scheduled maintenance in Q3. Nearly all nickel came from the company’s own Russian feedstock, highlighting its self-reliant supply chain.
For 2026, Nornickel guided nickel output between 193,000 and 203,000 tonnes, signaling flat production with no major expansion plans. Nornickel’s market capitalization stood at about $31 billion as of February 2026, underscoring its role as a major global supplier despite geopolitical constraints.
The lack of growth from one of the world’s key Class 1 nickel producers suggests limited incremental supply from Russia.
Vale
Brazil’s Vale continued to position itself as a strategic player in the battery metals supply chain. The company plans a nickel sulfate refinery in Bécancour, Québec, with deliveries to General Motors targeted for the second half of 2026, pending regulatory approvals. This move highlighted Vale’s push toward high-purity battery materials rather than bulk nickel mining.
Vale’s market capitalization was around $69–70 billion in early 2026, making it one of the largest diversified miners with significant nickel exposure. It produced 175,000 tonnes of nickel in 2025, reaching the high end of its guidance. Growth came from Canadian operations in Sudbury and Long Harbour and restarts in Brazil.
Looking ahead, Vale Indonesia warned its 2026 mining quota won’t meet demand for new nickel smelters. The approved quota is only about 30% of what the company requested, raising concerns that upcoming processing plants could face ore shortages.
Vale and partners are building three HPAL plants for EV battery nickel. The Pomalaa plant, starting in August 2026, will need 21 million tonnes of limonite ore per year, while Bahodopi will require 10.4 million tonnes annually. These projects represent over $6.5 billion in investment and highlight the growing pressure on Indonesia’s nickel supply.
Glencore
Glencore’s 2025 Full‑Year Production Report showed nickel output from its own sources at 71,900 tonnes, down about 7% from 82,300 tonnes in 2024. This decline was driven by lower production at both Integrated Nickel Operations (INO) and the Murrin Murrin operations. The reported figure excludes 5,000 tonnes from the Koniambo project, which is in care and maintenance.
In the fourth quarter of 2025, nickel production (including third‑party feed) was around 35,300 tonnes, slightly below the prior quarter. Glencore also gave 2026 nickel guidance of 70,000–80,000 tonnes, reflecting a relatively flat outlook after the 2025 drop.
Its nickel business is part of a broader diversified metals portfolio, with the company also producing copper, zinc, cobalt, coal, and other commodities. Nickel remains important to its strategy, especially given rising EV battery demand, but output challenges and asset transitions affected annual totals.
As of February 2026, Glencore’s market capitalization is widely reported to be around $58–61 billion (USD) based on its London Stock Exchange listing and share price.
This positions Glencore as a major diversified mining and commodity trading company, though smaller in market value than some of its peers like Rio Tinto or BHP. The company’s valuation reflects its breadth across metals, energy, and marketing operations, and its prospects are often shaped by commodity price swings and operational performance.
Risks and Opportunities for Investors and Policymakers
The top nickel producers showed limited growth in mining output while accelerating investments in battery-grade processing. Ore quality challenges, regulatory delays, and operational disruptions continued to constrain supply. At the same time, electric vehicle demand and energy transition needs kept rising.
The lack of aggressive supply expansion from major producers suggests the nickel market could remain structurally tight through the late 2020s, especially for high-purity Class 1 nickel required in batteries.
This is why nickel stocks present a unique combination of risks and opportunities. Supply concentration, policy interventions, and technological disruption create price volatility. Conversely, long-term demand from electrification, aviation, and hydrogen infrastructure provides structural upside.
Investors must navigate cyclical price swings, while policymakers balance industrial policy with market stability. Strategic supply agreements, diversification, and technology adoption will be crucial for managing risk.
Conclusion: Nickel’s Strategic Decade Ahead
Nickel is entering a decisive decade. The metal is so vital for the global energy transition, but faces structural uncertainty from supply expansion and evolving battery technology.
The next ten years will determine whether nickel becomes a stable metal of clean energy supply chains or a cautionary case study in commodity oversupply and industrial policy missteps. For institutions, understanding nickel’s macro dynamics, supply chains, and policy risks is essential. The metal’s trajectory will shape not only battery markets but also the geopolitics of the global energy transition.
Live Nickel Spot Price
The post The Ultimate Guide to Nickel: Supply, Demand, and Nickel Prices for 2026 and Beyond appeared first on Carbon Credits.
What replaced the cheap REDD credit on the boardroom slide deck, and why procurement is leading the rewrite.
Three years ago, a corporate slide showing a portfolio of cheap REDD+ credits could carry a board meeting. The number was big, the price was low, and the press release wrote itself. Today, that same slide gets sent back with questions. The questions are uncomfortable, the answers are unclear, and your general counsel is suddenly in the room.
Conventional carbon offsets are not dead. The voluntary carbon market retired 202 million tonnes in 2025, and the Morgan Stanley Institute for Sustainable Investing survey published in January 2026 confirmed that interest from corporate buyers remains substantial. What changed is the credibility threshold. The integrity floor has risen, the disclosure scrutiny has tightened, and the buyer profile has shifted. This article tracks what changed, what sophisticated buyers now ask before signing, and what serious corporates are putting on the board slide instead.
What boards used to buy, and why it stopped working
The 2020 to 2022 model was simple: buy a large tranche of avoidance credits at low single-digit prices, retire them against the company footprint, announce the carbon-neutral claim, and move on. Most of those credits came from REDD+ projects, renewable energy installations in countries where the renewable energy was already economic, or methane projects with thin documentation.
Several things broke that model. Academic research published in 2023, including a widely cited Science paper, found that the majority of REDD+ credits issued under the most common methodologies did not represent additional reductions when tested against rigorous counterfactuals. The Voluntary Carbon Markets Integrity Initiative published its Claims Code of Practice, which sets requirements for what companies can credibly claim from credit use. The European Union finalised its Green Claims Directive, restricting how companies can describe products as climate-neutral. France’s Décret 2022-539 already restricts carbon neutrality advertising. California’s AB 1305 imposes disclosure requirements on any company making net-zero or carbon-neutral claims while doing business in the state.
The collective effect: the cheap credit no longer buys the announcement, and the announcement now carries litigation risk.
The integrity reset: ICVCM, VCMI, and what changed
The Integrity Council for the Voluntary Carbon Market published the Core Carbon Principles in 2023 and began assessing methodologies against them in 2024. The first methodologies received the CCP label later that year. The point of the label is to give corporate buyers a defensible quality screen they can cite in disclosure.
The Voluntary Carbon Markets Integrity Initiative complements this on the demand side. Its Claims Code of Practice defines what a buyer can say (Silver, Gold, or Platinum claims, with associated requirements) based on the quality of credits used and the underlying decarbonisation strategy. Together, CCP and VCMI build a quality stack: CCP on the supply, VCMI on the claim, with the science-based target sitting underneath both.
The reset is not a ban on offsets. It is a ratchet. Credits that meet the new bar continue to clear; credits that do not, do not. The Morgan Stanley survey found that 61% of current buyers like the CCP label concept but that supply of labelled credits remains limited. That supply constraint is now visible in pricing.
What sophisticated buyers ask before they sign
The questions on the procurement scorecard have changed. A 2022 buyer might have asked about price, vintage, and project type. A 2026 buyer asks five different questions before any of those.
- What does the counterfactual look like, and who validated it.
- What is the permanence regime, and what is the buffer pool exposure.
- What is the leakage risk, and how is it mitigated.
- What rating has the project received from the independent ratings agencies (Sylvera, BeZero, Calyx Global), and what was the rationale.
- What is the documentation discipline that survives an audit four years from now when the procurement team that signed the contract has moved on.
If the vendor cannot answer those five questions on a first call, the conversation ends. Conversely, if the vendor can answer them with documented specificity, the conversation often expands beyond a single transaction toward a multi-year engagement.
Where this leaves your near-term commitments
You probably have near-term commitments that pre-date the integrity reset. Public targets to be carbon neutral by 2025 or 2030. Product-level claims that ran in last year’s marketing. Disclosed reduction trajectories that assumed continued access to cheap credits.
You have three workable paths. The first is to re-baseline your strategy, replacing the most exposed credits with higher-quality alternatives and adjusting the public language to match what you can defend. The second is to shift the underlying spend from offsetting outside your value chain to investing inside your value chain, where reductions count against Scope 3 directly and the audit trail is cleaner. The third is to keep the strategy and absorb the risk, which is increasingly the most expensive option once you price in litigation, restatement, and reputational exposure.
Most serious buyers are choosing the second path. It moves the carbon spend from a compliance cost to a procurement and resilience investment, and it removes the central failure point of the legacy model: the disconnect between where the emissions occurred and where the reductions sat. Nature-based supply chain investments, structured under the GHG Protocol Land Sector and Removals Standard and aligned to the SBTi FLAG Guidance, are the asset class that fits this brief. They generate inventory-grade reductions, they produce audit-grade documentation, and they survive the new claim restrictions because the carbon math sits inside the value chain that the disclosure already covers.
If you are reassessing a carbon strategy under the new integrity bar, or rebuilding a board narrative that has to survive a more skeptical audience, the carbon and sustainability experts at Carbon Credit Capital can help. The Dual-Value Model gives you a defensible alternative to legacy offset purchases, with the documentation and operational integration that survives the procurement scorecard and the audit. Schedule a consultation.
The World’s Biggest Game Is Coming
Every four years, the world stops to watch football. Billions of fans tune in, millions travel, and for a few glorious weeks the sport unites people across language, culture, and geography in ways almost nothing else can.
The 2026 FIFA World Cup is set to be the most ambitious tournament in the history of the sport. For the first time ever, 48 national teams will compete across 16 host cities in three countries: the United States, Canada, and Mexico. From Atlanta to Toronto, from Guadalajara to New York, the tournament will span an entire continent and draw an estimated five to six million visitors.
That scale is extraordinary. It is also an invitation.
When an event this large takes shape, its environmental footprint grows alongside it. More teams mean more matches. More host cities mean more travel. More fans mean more flights, more hotel stays, more food, and more waste. But scale also means influence, and that is exactly where the opportunity lies.
The 2026 World Cup arrives at a moment when awareness of climate responsibility is higher than it has ever been. Fans, sponsors, cities, and governing bodies are increasingly asking: how do we celebrate something we love while taking better care of the planet we share? The good news is that the answer is not about sacrifice. It is about small, intentional choices made by millions of people acting together.
This article breaks down the environmental footprint of the tournament, explains what FIFA and host cities are doing to reduce it, and offers practical ways for every fan to participate in something bigger than the beautiful game itself.
What Is the Environmental Impact of the 2026 FIFA World Cup?
Quick Answer: The 2026 FIFA World Cup will generate greenhouse gas emissions through international and domestic air travel, ground transportation, hotel stays, stadium operations, food and beverage consumption, and event logistics. Fan travel, especially long-haul flights, typically represents the largest share of a major sporting event’s total carbon footprint.
A tournament the size of the World Cup generates emissions across nearly every category of human activity. Understanding where those emissions come from is the first step toward reducing them.
The primary sources of World Cup emissions include:
- International flights: Fans traveling from Europe, Asia, South America, Africa, and beyond generate significant aviation emissions. Long-haul flights are among the most carbon-intensive activities an individual can undertake.
- Domestic flights: With 16 host cities spread across three countries, fans attending multiple matches will likely fly between venues within North America.
- Ground transportation: Rental cars, taxis, rideshares, and buses connecting airports to stadiums and hotels all add to the overall footprint.
- Hotel stays: Millions of nights of lodging consume electricity, water, and heating and cooling energy at scale.
- Stadium operations: Lighting, cooling, sound systems, and food service at each venue require significant energy.
- Food and beverage: Catering at scale, with meat-heavy menus and single-use packaging, contributes both direct emissions and substantial waste.
- Event logistics: Equipment transport, broadcasting infrastructure, and official travel all factor in.
No single estimate exists yet for the 2026 tournament’s total footprint, but context from past events is instructive. FIFA’s own sustainability reports acknowledge that major tournaments generate hundreds of thousands to millions of metric tons of CO2-equivalent emissions when fan travel is included. The 2022 FIFA World Cup in Qatar drew considerable scrutiny for its construction-related emissions and for the long-haul flights required to reach a single Middle Eastern host nation.
The 2026 tournament’s multi-country, multi-city format presents different challenges and, importantly, different opportunities.
Why Sports Matter in the Fight Against Climate Change
Quick Answer: Global sporting events like the World Cup reach billions of people and have a unique power to inspire behavior change at scale. That makes them one of the most important platforms for communicating and normalizing climate-conscious choices.
Sport occupies a rare space in public life. It commands attention from people who may not read policy papers, follow environmental news, or consider themselves particularly engaged with climate issues. A single World Cup final draws a television audience measured in the hundreds of millions. That kind of reach is genuinely extraordinary.
The United Nations Sports for Climate Action Framework, launched in 2018, recognizes this explicitly. The framework calls on sports organizations to use their platforms to raise awareness, reduce their own emissions, and inspire broader action among fans and communities. As of 2024, more than 300 sports organizations have signed on, including national football associations and major leagues across multiple disciplines.
When sports organizations commit to climate action, they do not just reduce their own footprint. They send a signal to fans, sponsors, broadcasters, and host cities that sustainability is a shared priority. When a stadium installs solar panels, it normalizes renewable energy. When a league actively promotes public transit, it makes that choice feel obvious rather than inconvenient. When a tournament takes accountability for its unavoidable emissions, it shows that responsibility is possible even at enormous scale.
The 2026 World Cup has the potential to reach more people with that message than almost any other platform on earth.

Why Transportation Is the Largest Source of Emissions
Quick Answer: Transportation, especially aviation, typically accounts for the majority of a major sporting event’s total carbon footprint. It involves millions of individuals making high-emission journeys that are genuinely difficult to avoid or replace with lower-carbon alternatives today.
When sustainability researchers analyze the footprint of a mega sporting event, one category consistently dominates: how people get there.
Aviation is among the most carbon-intensive modes of travel per mile. A single round-trip transatlantic flight, say from London to New York, generates roughly 1 to 1.5 metric tons of CO2-equivalent per passenger depending on the aircraft, seat class, and routing. For a fan flying from Buenos Aires or Tokyo, that figure climbs considerably higher.
The 2026 World Cup will draw fans from every continent. Many will travel internationally. Some will attend matches in multiple cities and need additional domestic flights between venues. Ground transportation adds further emissions once fans arrive at each destination.
Hotels come in as the second major source. With millions of visitors needing accommodation across dozens of cities over several weeks, the aggregate energy consumption of lodging is substantial.
This concentration of travel-related emissions is why transportation is the category most often targeted by sustainability strategies at major events. It is also the area where individual fan choices can have the most meaningful real-world impact.
Existing Stadiums Help Reduce Environmental Impact
Quick Answer: Most 2026 World Cup venues are existing stadiums, which significantly reduces the construction-related emissions that have contributed to the environmental footprint of past tournaments.
One of the most meaningful and often underappreciated sustainability advantages of the 2026 World Cup is the decision to use venues that are largely already built.
Stadium construction is enormously carbon-intensive. Concrete, steel, and the energy required to assemble them at scale contribute millions of metric tons of emissions before a single match is played. Using existing infrastructure eliminates that category of impact from the outset.
Many 2026 host venues, including AT&T Stadium in Arlington, MetLife Stadium in New Jersey, Levi’s Stadium in Santa Clara, and SoFi Stadium in Los Angeles, are large, established facilities with existing transportation connections, utilities, and operational infrastructure. Similar existing stadiums anchor the schedule in Canada and Mexico.
Host cities are also using the tournament as an opportunity to invest in improvements that will benefit communities long after the final whistle:
- Public transit expansions: Several host cities are upgrading rail and bus infrastructure to handle increased tournament traffic. Those improvements will remain useful to residents for decades.
- Renewable energy integration: Some venues are increasing their use of solar, wind, and other clean energy sources in preparation for the event.
- Waste diversion programs: Enhanced composting, recycling, and single-use plastic reduction efforts are being built into venue operations.
- Water conservation: Stadiums in drier climates are adopting more efficient irrigation and water management systems.
None of this erases the footprint of the event entirely. But it does mean the 2026 World Cup is starting from a more sustainable foundation than tournaments that required massive new construction.

FIFA’s Sustainability Strategy
Quick Answer: FIFA has developed a Sustainability and Human Rights Strategy that includes environmental commitments around emissions reduction, responsible sourcing, and legacy planning for host communities. Independent oversight and third-party verification remain important to ensuring those commitments translate into real outcomes.
FIFA’s approach to sustainability has evolved meaningfully over the past decade. The organization’s current Sustainability and Human Rights Strategy covers several interconnected areas.
On the environmental side, FIFA has committed to reducing greenhouse gas emissions across its operations, promoting sustainable venue management, and encouraging host nations to integrate sustainability into their planning. The strategy also addresses responsible procurement, supply chain transparency, and waste reduction.
Legacy planning sits at the center of the framework. FIFA works with host cities and nations to ensure that infrastructure investments, community programs, and environmental improvements outlast the tournament itself. The goal is that hosting the World Cup leaves communities measurably better off, with improved transit, upgraded facilities, and stronger environmental standards.
It is worth noting that large international sports organizations operate under significant public scrutiny, and sustainability commitments are most meaningful when supported by independent verification and transparent reporting. Fans and stakeholders are right to ask for accountability alongside ambition.
For the full details of FIFA’s approach, readers can consult the official FIFA Sustainability and Human Rights Strategy and the associated FIFA World Cup 26 sustainability documentation.
How Fans Can Reduce Their Carbon Footprint
Quick Answer: Fans attending or following the 2026 World Cup can reduce their environmental impact by choosing lower-carbon transportation, staying in sustainable accommodations, reducing waste at venues, and offsetting unavoidable emissions through verified carbon offset programs.
The most powerful lever in World Cup sustainability is not a stadium design or a transit system. It is the combined weight of millions of individual choices made by fans who care.
Here is a practical guide to making yours count:
Getting There
- Choose direct flights when possible. Takeoffs and landings are the most fuel-intensive parts of any flight, so fewer of them means less fuel burned.
- Consider train travel for shorter distances between host cities, particularly in the U.S. Northeast corridor or within Mexico.
- Use public transit from the airport to your hotel and to the stadium. Most host cities have rail and bus connections to venues, and several are expanding those networks specifically for the tournament.
- If you need to rent a car, opt for an electric or hybrid vehicle.
- Share rides with other fans when driving is unavoidable.
At the Hotel
- Book accommodations that have earned recognized green certifications. Look for LEED, Green Key, or similar credentials as a starting point.
- Reuse towels and linens, take shorter showers, and turn off lights and air conditioning when you leave the room.
- Choose hotels within walking or transit distance of the stadium rather than driving in from farther away.
At the Match
- Bring a reusable water bottle. Many venues will have refill stations available.
- Choose plant-based food options when they are available. Food production is a meaningful contributor to greenhouse gas emissions, and the menu choices of millions of fans add up.
- Use the designated recycling and composting bins at the venue.
- Skip single-use plastics wherever an alternative is offered.
Supporting Local Communities
- Eat at locally owned restaurants rather than large international chains. This keeps economic benefits inside the host community and typically means shorter, less emissions-heavy food supply chains.
- Buy souvenirs from local artisans and makers.
- Be a thoughtful guest in every host city you visit.
Offsetting What You Cannot Eliminate
- Calculate your travel emissions using the Terrapass Carbon Footprint Calculator and balance the portion of your footprint you could not reduce by purchasing carbon credits that support verified climate projects.
What Are Carbon Credits?
Quick Answer: Climate projects are basically carbon reduction factories. They generate one carbon credit every time they reduce or remove one metric ton of CO2-equivalent (CO2e) greenhouse gas emissions from the atmosphere. Individuals and organizations can compensate for their own emissions by purchasing an equivalent amount of carbon credits that fund projects for reducing CO2e.
Carbon offsetting works by balancing the emissions generated in one place with emissions reduced by climate projects somewhere else. When you purchase a carbon credit, you are funding projects that restore and protect nature, accelerate decarbonization, and remove carbon from the atmosphere.
Common types of carbon projects include:
- Forestry and land conservation: Protecting and restoring forests that would otherwise be logged prevents the release of the carbon stored in trees and soil.
- Renewable energy: Projects that build wind, solar, or small hydro capacity in regions that would otherwise rely on coal or other fossil fuels.
- Methane capture: Methane is known as a climate super-pollutant. Capturing methane from landfills, orphaned oil wells, or agricultural operations prevents a particularly potent greenhouse gas from reaching the atmosphere.
- Regenerative agriculture: Farming practices that sequester carbon in soil while improving overall ecosystem health.
Not all carbon credits are created equal, and that distinction matters. High-integrity carbon credits are generated by projects that operate on carbon credit registries like the American Carbon Registry, Climate Action Reserve, Verra, and the Gold Standard which have been approved by the Integrity Council for Voluntary Carbon Markets (ICVCM) for rigorous governance, tracking, transparency, and no double-counting. All carbon credits from these projects go through independent third-party verification to ensure that the emissions reductions claimed by a project are real, measurable, additional (meaning they would not have happened without the carbon credit funding), and permanent.
Carbon offsetting works best as a complement to emission reductions, not a substitute for them. The goal is always to reduce first, then offset what cannot be avoided. You can learn more in the Terrapass Guide to Carbon Credits.
Why Carbon Offsetting Make Sense for World Cup Travel
Quick Answer: Many of the emissions generated by World Cup travel, particularly long-haul international flights, cannot currently be eliminated with available technology. Carbon offsetting give fans a practical way to take responsibility for those unavoidable emissions while supporting verified climate projects around the world.
Aviation remains one of the most difficult sectors to decarbonize. Sustainable aviation fuel exists and is growing, but it currently accounts for a small fraction of global fuel supply and comes at a significant price premium. Electric long-haul aircraft are still years away from commercial viability. For most fans, flying to the World Cup means generating emissions that cannot yet be avoided through any other realistic means.
This is precisely the situation carbon offsetting is designed to address.
By calculating the emissions from your flights, hotel stays, and ground transportation, you can take meaningful financial responsibility for that footprint today, while the world works toward the technologies and systems that will eventually make low-carbon travel universally accessible.
Terrapass makes this process straightforward. The company has been helping individuals and businesses calculate and offset their carbon footprints for more than 20 years, funding verified projects in forestry, renewable energy, methane capture, and other categories. For fans planning to attend the 2026 World Cup, the Terrapass Flight Carbon Calculator provides a clear estimate of travel emissions and purchasing personal carbon offsets takes only a few minutes.
This is not about guilt or restriction. It is about celebrating the sport you love while acknowledging that our choices have consequences, and then actually doing something about it.

The Lasting Legacy of Sustainable Sporting Events
Quick Answer: When sporting events invest in sustainability, the benefits extend well beyond the tournament itself. Infrastructure improvements, cleaner energy systems, stronger transit networks, and community investments all create lasting value for host cities and the people who live in them.
The 2026 World Cup will end. The infrastructure, habits, and standards it helps establish will not.
Host cities that expand their public transit systems for the tournament will keep those systems running after the last match. Stadiums that invest in renewable energy and efficient operations will benefit from lower costs and reduced emissions for years. Communities that build composting and waste diversion programs during the event have the framework to sustain them long afterward.
This is what legacy planning means in practical sustainability terms. The most successful sporting events do not just minimize harm. They leave behind something genuinely valuable.
The tournament also has the potential to accelerate the normalization of sustainable behavior among millions of fans. When people experience public transit that actually works, venues that make recycling easy, and hotels that back up their environmental commitments with real action, those experiences reshape expectations. Fans carry those expectations home with them and apply them to their daily lives.
Climate action at scale is not driven only by policy. It is driven by cultural change, by enough people deciding that this is simply how things are done now. A World Cup can contribute to that shift in ways that are hard to quantify but easy to recognize when you see them.
Sustainable Travel Checklist
Use this as your personal guide for the 2026 World Cup:
Before You Go
- Calculate your travel emissions using the Terrapass Carbon Footprint Calculator
- Purchase verified carbon offsets for your flights and other travel
- Book accommodations with recognized green certifications
- Research public transit options at each host city you plan to visit
- Pack a reusable water bottle, travel mug, and shopping bag
Getting There
- Choose direct flights to reduce fuel burn from multiple takeoffs and landings
- Consider train travel for shorter routes between host cities
- Use public transit from the airport rather than renting a car
- If renting, select an electric or hybrid vehicle
During the Tournament
- Use public transit or walk to the stadium
- Fill your reusable bottle at stadium refill stations
- Sort waste into the correct recycling and composting bins
- Explore plant-based food options at the venue
- Eat at locally owned restaurants
- Buy local souvenirs to support host community economies
- Respect local environmental regulations and natural spaces
When You Get Home
- Share your experience and the sustainable choices you made with friends and family
- Keep the habits you built during the tournament going
- Consider a home energy audit or a renewable energy subscription
Did You Know? Sustainability Facts Worth Sharing
Fact 1: The United Nations Sports for Climate Action Framework has more than 300 signatories from the global sports community, including leagues, clubs, national associations, and event organizers all committed to reducing sports-related emissions.
Fact 2: Reusing existing stadiums avoids the construction-related carbon emissions that have been one of the most criticized aspects of past World Cups and Olympic Games. Building a new stadium can generate hundreds of thousands of metric tons of CO2-equivalent before a single match is played.
Fact 3: A single round-trip transatlantic flight can generate roughly as much CO2-equivalent per passenger as several months of average home energy use, which is why aviation is such an important focus for anyone thinking seriously about their personal carbon footprint.
Fact 4: Verified carbon projects often generate benefits beyond emissions reductions, including biodiversity protection, community employment, cleaner water, and improved public health in project communities.
Fact 5: The 2026 FIFA World Cup will be the first ever to feature 48 teams, meaning the number of matches and participating nations will be larger than at any previous tournament in the sport’s history.
Fact 6: Plant-based food options generate significantly lower greenhouse gas emissions per serving than beef or lamb on average, making menu choices at stadiums a surprisingly meaningful sustainability decision when multiplied across millions of meals.
Fact 7: Renewable Energy Certificates (RECs) allow individuals and businesses to match their electricity consumption with verified renewable energy generation, making it possible to support clean energy even when your local grid still relies on fossil fuels.

Every Goal Counts On and Off the Field
The 2026 FIFA World Cup is going to be extraordinary. Forty-eight teams. Sixteen cities. Three countries. The greatest players in the world are competing for the most coveted prize in sport. Billions of people watching.
It is also a moment.
Moments like this are rare. Occasions when the whole world is paying attention at the same time, when shared experience opens the door to shared action. The players on the pitch will give everything for 90 minutes. Fans in the stands and at home can give something too.
Not perfection. Not sacrifice. Just intention.
Choosing a direct flight. Riding the subway to the stadium. Filling a reusable bottle. Eating a plant-based meal. Staying somewhere that has earned its green credentials. Offsetting the emissions from your journey before you even board the plane.
None of these things are dramatic on its own. Together, across millions of fans in 2026, they add up to something significant.
Terrapass has spent more than 20 years making it easy for people to take genuine responsibility for their carbon footprint. Whether you are attending matches in person, hosting viewing parties, or following the tournament from afar, there are meaningful ways to reduce your impact and offset what you cannot yet eliminate.
Calculate your World Cup travel footprint and offset your emissions at Terrapass.com.
The world is watching. Let’s make this one count.
Frequently Asked Questions
What is the environmental impact of the FIFA World Cup?
The FIFA World Cup generates greenhouse gas emissions across several categories: international and domestic air travel, ground transportation, hotel stays, stadium operations, food service, and event logistics. Fan travel, particularly long-haul flights, typically represents the largest share of total emissions for a sporting event at this scale. The 2026 tournament spans three countries and 16 host cities, making transportation planning especially important for fans who want to minimize their footprint. While exact projections for 2026 are not yet finalized, past tournaments have generated hundreds of thousands of metric tons of CO2-equivalent.
Why does air travel create so many emissions?
Aircraft burn large quantities of jet fuel during flights, releasing CO2 and other climate-warming compounds. Unlike ground vehicles, which can be electrified relatively quickly, long-haul aircraft have very few low-carbon alternatives available on a commercial scale today. Sustainable aviation fuel exists but currently makes up a small fraction of global supply. A single round-trip transatlantic flight can generate roughly 1 to 1.5 metric tons of CO2-equivalent per passenger, comparable to several months of home energy use. Flying in a higher class or on older, less fuel-efficient aircraft increases emissions further.
Are existing stadiums better for the environment?
Generally speaking, yes. Constructing a new stadium requires enormous quantities of concrete, steel, and other materials, all of which carry substantial embedded carbon emissions. Using existing venues avoids those construction-related emissions entirely. The 2026 World Cup benefits significantly from this approach, as most venues, including major NFL and MLS stadiums across the U.S., are already built and operational. This does not eliminate the event’s footprint, but it removes one of the most carbon-intensive categories that has drawn criticism at past tournaments and Olympic Games.
How can I travel more sustainably to the World Cup?
Sustainable travel starts before you leave home. Choose direct flights when possible, since takeoffs and landings are the most fuel-intensive phases of any flight. Use public transit from airports to hotels and stadiums rather than renting a car. If a car is necessary, choose an electric or hybrid option. Book accommodations with recognized environmental certifications. Pack reusable bags, bottles, and utensils. And calculate your unavoidable travel emissions with the Terrapass Flight Carbon Calculator so you can offset them through a verified program before you depart.
What are carbon credits?
Carbon credits are verified units representing the reduction or removal of one metric ton of CO2-equivalent greenhouse gas emissions. When you purchase carbon credits, you fund projects that prevent greenhouse gases from entering the atmosphere, such as protecting forests, building renewable energy capacity, or capturing methane from landfills. High-integrity carbon credits are independently verified under recognized standards organizations, ensuring the emissions reductions claimed are real, measurable, additional, and permanent. Carbon credits work best when used to compensate for emissions that cannot currently be eliminated, not as a substitute for actually reducing your footprint.
Should I offset my flight?
If you are flying to attend the 2026 World Cup, offsetting your flight emissions is one of the most practical and immediate steps available to you. Aviation is among the most carbon-intensive activities most individuals engage in, and the technology to eliminate those emissions on a commercial scale does not yet exist. By calculating your flight’s emissions and purchasing verified carbon credits, you take direct financial responsibility for that footprint and fund climate projects that make a measurable difference. It is not a perfect solution, but meaningful steps taken by millions of people are how real progress gets made. Use the Terrapass Flight Carbon Calculator to get started.
How can fans reduce their carbon footprint at the World Cup?
Fans can reduce their carbon footprint through choices made at every stage of the trip: flying direct, using public transit, staying in sustainable hotels, bringing reusable water bottles, choosing plant-based food options at the venue, sorting waste properly, supporting local businesses, and offsetting unavoidable travel emissions before departure. No single action eliminates a fan’s footprint entirely, but the combined effect of millions of fans making better choices produces a meaningful reduction across the tournament as a whole. The single most impactful individual action is almost always reducing transportation emissions, particularly from flying. Explore personal carbon offset options at Terrapass to cover what you cannot eliminate.
What is sustainable tourism?
Sustainable tourism means travel that minimizes negative environmental and social impacts while contributing positively to host communities. In practice, it means choosing lower-carbon transportation, supporting locally owned businesses, respecting natural environments and local cultures, reducing waste, conserving water and energy, and taking responsibility for unavoidable emissions through verified offset programs. For World Cup fans, it means being a thoughtful guest in each host city, recognizing that the places and communities welcoming the tournament deserve real respect, and that travel itself can be conducted in ways that leave a lighter footprint.
What is FIFA doing to reduce environmental impacts at the 2026 World Cup?
FIFA’s Sustainability and Human Rights Strategy includes environmental commitments around emissions reduction, responsible procurement, sustainable venue management, waste diversion, and legacy planning. For the 2026 tournament, FIFA is working with host associations in the U.S., Canada, and Mexico to incorporate sustainability requirements into venue operations, transportation planning, and community investment. The decision to use largely existing stadiums is itself a significant sustainability choice. Independent stakeholders and advocacy organizations continue to monitor FIFA’s progress against its stated commitments, and transparent reporting will be essential to evaluating the actual outcomes. More details are available at FIFA’s official sustainability pages.
Can sporting events be sustainable?
Mega sporting events cannot be carbon neutral in any simple sense. They involve too much travel, too much energy, and too much logistical complexity. But they can be substantially more sustainable than a business-as-usual approach, and they can generate lasting positive legacies in host communities. The goal is not perfection but meaningful reduction, honest accounting, and genuine investment in the infrastructure and behaviors that make lower-carbon futures possible. The 2026 World Cup has real opportunities in all three categories. Whether those opportunities are fully realized depends on the choices made by FIFA, host cities, sponsors, and the fans themselves.
How can businesses support climate action around the World Cup?
Businesses can use the 2026 World Cup as an occasion to assess and reduce their own operational carbon footprints, offset emissions from employee travel and corporate hospitality, engage customers and partners in sustainability initiatives, and support climate projects through verified carbon programs. Sponsoring or hosting sustainable events, choosing suppliers with credible environmental commitments, and publishing transparent emissions data are all meaningful steps. For companies with significant travel or event-related footprints, working with an established carbon management partner to measure, reduce, and offset those emissions is a practical place to start. Terrapass offers business carbon offset programs and Renewable Energy Certificates to help organizations take concrete action.
Links Reference
Terrapass Internal Links (live throughout article)
- Carbon Footprint Calculator
- Flight Carbon Calculator
- Personal Carbon Offsets
- Business Carbon Offsets
- Renewable Energy Certificates
- Carbon Credit Guide
External Sources
- FIFA World Cup 26 Sustainability Documentation
- FIFA Sustainability
- UN Sports for Climate Action Framework
- United Nations Environment Programme
- IPCC
- American Carbon Registry
- Climate Action Reserve
- Verra / Verified Carbon Standard
- Gold Standard
The post 2026 FIFA World Cup Carbon Footprint: A Sustainability Guide appeared first on Terrapass.
A few months ago I went to a climate change forum at the Center for Brooklyn History. The panel I attended, “Confronting Climate Change: Understanding Deniers,” featured the prominent climate activist, Bill McKibben.

Bill McKibben. Courtesy https://billmckibben.com/.
I was curious to hear McKibben’s take on climate change deniers. I don’t regard the true deniers as a big problem – they’re only 11-15% of our country, according to most polls. Rather, I wondered if McKibben would label as “climate deniers” people who agree that climate change is a significant problem but disagree with his framing and his proposed solutions. I have worked for decades on energy and climate matters as an energy lawyer. Now, more than ever, I believe that to address climate change we need to build a big tent.
In the Q&A I tested where McKibben is on this by asking if he would label as a climate denier someone who subscribes to the main tenets of climate change science yet holds that natural gas has a role to play as a bridge fuel. (Our exchange starts at 1:12:45 of the video.)
This could have been a chance for McKibben to make clear that such a view isn’t climate denialism, even if he feels it’s misguided. But he punted, saying “I don’t care whether they’re deniers or not.” For good measure, he threw in his long-standing refrain that swapping coal for natural gas makes climate change worse, despite coal’s far higher carbon content per unit of energy.

674-MW methane-powered generating station, Salem, MA.
As you can hear in the recording, McKibben’s claim that gas is worse than coal draws on the work of Cornell scientist Robert Howarth. Yet McKibben didn’t mention that Howarth’s work is controversial and disputed by many scientists. The crux of the dispute is whether methane’s impact on warming should be measured with a 20-year or 100-year time frame.
Methane is a relatively short-lived greenhouse gas, with a lifetime of around 10 years, versus the 100-year life applicable to carbon dioxide. But each ton of methane is far more potent while in the atmosphere, trapping roughly 100 times as much heat as a ton of CO2. These cross-cutting facts about atmospheric methane — shorter life but greater potency than CO2 — have resulted in two opposing camps: one insisting on a 20-year timeframe for greenhouse gas accounting, the other adhering to the established 100-year frame. This matters because with a 20-year timeframe, generating electricity with natural gas (which, chemically speaking, is essentially all methane) is more damaging to climate than coal-fired electricity.
McKibben blew past this dispute. To hear him at the Center for Brooklyn History, one would have no inkling that there’s an active disagreement over which timeframe to use, that there are staunch climate activists who favor the 100-year time frame, and that the Intergovernmental Panel on Climate Change (IPCC) generally uses the 100-year timeframe.
McKibben’s latest (2025) book. Published by W.W. Norton & Company.
McKibben also insisted that a discussion about natural gas’s potential role in mitigating climate change as a replacement for coal is irrelevant because solar “is now our cheapest resource.” McKibben’s claim, of course, suffuses “Here Comes the Sun,” his 2025 book that extols solar power as the cheapest solution for all of our energy needs. But this too is questionable, because it’s based on cost comparisons between solar farms and natural gas power plants (or nuclear power plants) that fail to consider that electricity supply and delivery is a complex system of wires and plants rather than individual power plants. Based on his remarks, McKibben is choosing to ignore studies such as the comprehensive 2025 report from the Clean Air Task Force that concluded that plant-level cost comparison “is a good metric to track historical technology cost evolution [but] is not an appropriate tool to use in the context of long-term planning and policymaking for deep decarbonization.” And the task force is not alone in finding that when electricity is treated as a system, solar loses its place as the cheapest low-carbon resource.
The dogmatism McKibben displayed at the Brooklyn meeting was unfortunate. We’re in a time when efforts to combat climate change are in retreat. A unified front is required to turn the tide. Instead of doubling down on absolutist positions, activists like McKibben who seem convinced that the solution to climate change is all-renewables, end of discussion, should be seeking common ground with others who want climate action but believe that nuclear power and natural gas must also play a role.

NYC Climate March, Sept 17, 2023. Photo: C. Komanoff.
Climate change activists need to build a bigger tent, rather than call anyone who disagrees with their positions a climate change denier. It is striking that McKibben stuck to his guns after saying in the same talk that the most important goal for everyone right now is to help climate change realists win more House and Senate seats in this year’s midterms. As some have noted, an absolutist position on natural gas appears less likely to achieve that win and politicians are following that advice.
Will McKibben evolve? He has demonstrated that he knows how to build a national climate movement centered around issues like divestment. Given the current political situation, he should focus on building an even bigger tent by welcoming all of the 85% who believe that we need to address climate change but do not agree with his ideological positions.
Rich Miller is an energy lawyer who has worked for a variety of stakeholders and now gives walking tours in lower Manhattan on the history of electricity.


-
Climate Change11 months ago
Guest post: Why China is still building new coal – and when it might stop
-
Greenhouse Gases11 months ago
Guest post: Why China is still building new coal – and when it might stop
-

 Greenhouse Gases2 years ago
嘉宾来稿:满足中国增长的用电需求 光伏加储能“比新建煤电更实惠”
-

 Climate Change2 years ago
嘉宾来稿:满足中国增长的用电需求 光伏加储能“比新建煤电更实惠”
-
Climate Change2 years ago
Bill Discounting Climate Change in Florida’s Energy Policy Awaits DeSantis’ Approval
-

 Renewable Energy9 months ago
Sending Progressive Philanthropist George Soros to Prison?
-

 Carbon Footprint2 years ago
US SEC’s Climate Disclosure Rules Spur Renewed Interest in Carbon Credits
-
Greenhouse Gases1 year ago
嘉宾来稿:探究火山喷发如何影响气候预测