

Battery energy storage has entered a new era. Costs have fallen to historic lows, and deployments are accelerating across major markets. According to BloombergNEF’s (BNEF) Levelized Cost of Electricity 2026 report, the economics of grid storage shifted dramatically in 2025 — even as other clean energy technologies became more expensive.
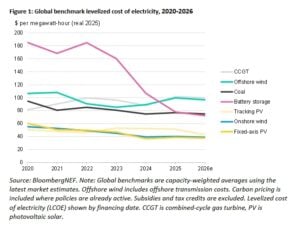
- The global benchmark cost for a four-hour battery storage project dropped 27% year-on-year to $78 per megawatt-hour (MWh) in 2025.
That marks the lowest level since BNEF began tracking the data in 2009. As a result, batteries are now reshaping how power systems balance renewable energy and meet rising electricity demand.
At the same time, solar and wind projects faced cost pressures. Supply chain constraints, weaker resource quality in some regions, and policy reforms in mainland China pushed up benchmark costs. However, despite these short-term headwinds, BNEF expects long-term clean energy costs to continue declining through 2035.
Battery Storage Breaks Records While Solar and Wind Stall
In 2025, battery storage clearly stood out. The $78/MWh benchmark for a four-hour system reflected a steep and rapid decline. Lower battery pack prices, stronger competition among manufacturers, and better system design all helped drive the drop.
By contrast, solar and wind moved in the opposite direction. The global benchmark cost for a fixed-axis solar farm rose 6%, reaching $39/MWh. Onshore wind increased to $40/MWh. Offshore wind climbed sharply to $100/MWh due to tight supply chains and financing challenges.
Thermal power also became more expensive. The levelized cost of electricity (LCOE) for new combined cycle gas turbine (CCGT) plants jumped 16% to $102/MWh — the highest level recorded. Equipment price increases and strong demand for gas turbines, partly fueled by data center expansion, kept costs elevated. Coal plants also faced higher capital expenses.
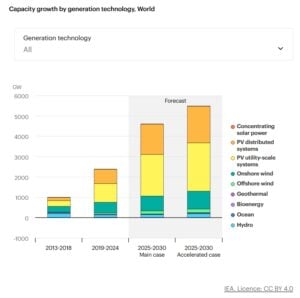
Yet even with solar and wind costs rising in 2025, BNEF projects that innovation and scale will push prices down again over the next decade. By 2035, the firm expects:
- Solar LCOE to fall 30%
- Battery storage to decline 25%
- Onshore wind to drop 23%
- Offshore wind to decrease 20%
These projections suggest the current cost increases are temporary rather than structural.
China’s Cost Advantage
Wind energy told a more mixed story.
Mainland China retained a cost advantage. However, projects built in lower wind-speed regions pushed up the global benchmark. Onshore wind projects outside mainland China saw a 4% cost decline, but the global average rose 2% due to Chinese market dynamics.
Offshore wind faced deeper challenges. Supply chain bottlenecks increased turbine and installation costs across major markets. In the United Kingdom, recently financed offshore wind projects now cost 69% more than they did five years ago. BNEF expects offshore wind costs to remain elevated until at least 2030.
Still, in the United States, wind power regained its position as the cheapest source of new electricity generation in 2025. Rising gas turbine costs pushed wind ahead of gas for the first time since 2023.
EV Overcapacity Slashes Battery Prices
One major factor behind the storage cost collapse is manufacturing overcapacity in the electric vehicle (EV) sector.
China’s lithium-ion battery production capacity surpassed 2 terawatt-hours in 2024. That was about 60% higher than total battery demand. As a result, manufacturers competed aggressively on price, which benefited grid-scale storage buyers.
Battery pack prices for EVs fell 8% in 2025 to a record low of $108 per kilowatt-hour, according to BNEF’s December survey. Lower pack prices directly reduced the cost of large storage projects. Meanwhile, system-level improvements — including better integration and optimized engineering — improved performance and reduced overall project expenses.
According to Amar Vasdev, senior energy economics associate at BNEF and lead author of the report, manufacturing overcapacity and better system designs are transforming the economics of large energy storage projects. In six markets, the LCOE of a four-hour battery system has already dropped below $100/MWh.
That threshold is critical. At those levels, battery storage becomes highly competitive with fossil fuel peaking plants.
- RELATED: China’s One Month Lithium Battery Energy Storage Installations Beat America’s One Whole Year
Lower Battery Costs Drive Renewables Plus Storage Boom Worldwide
Lower battery costs are accelerating hybrid renewable development. In 2025 alone, developers added 87 gigawatts of co-located solar and storage projects worldwide. These combined systems delivered electricity at an average cost of $57/MWh.
This model solves one of solar’s biggest challenges — intermittency. Batteries allow solar farms to store excess daytime generation and dispatch it later when demand peaks. As storage becomes cheaper, solar-plus-storage projects become more financially attractive and reliable.
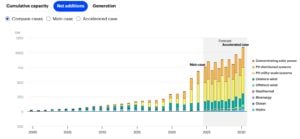
BNEF expects annual global energy storage additions to reach 220 GW by 2035, growing at a compound annual rate of nearly 15%. If that projection holds, batteries will become central to grid balancing worldwide.
The U.S. Storage Boom Accelerates
The United States is emerging as a key growth engine for battery deployment.
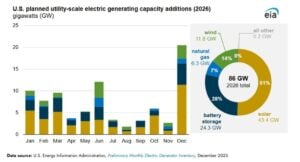
According to the February 2026 Electric Power Monthly report from the U.S. Energy Information Administration (EIA), 86 GW of new utility-scale capacity is expected to come online in 2026. Of that total, 26.3 GW will come from battery storage.
That represents the largest single-year capacity expansion in more than two decades. Solar and battery storage together account for nearly 79% of planned additions.
Texas has become a hotspot for battery development. As of July 2025, the state had 12.2 GW of storage capacity operating. Developers rushed projects online ahead of summer peak demand, including nearly 1 GWh brought online by esVolta across three projects.
California continues to lead nationally, with more than 12 GW of operational storage capacity. Projects such as the Rexford solar-plus-storage facility in Tulare County strengthened the state’s position as a grid storage pioneer.
Meanwhile, New England expanded its footprint with large-scale additions to the ISO New England grid. These projects demonstrate that battery storage is no longer confined to a few early-adopter markets.
Australia’s Breakout Year
Australia also delivered a major milestone in 2025. The country commissioned 4.9 GWh of utility-scale battery storage during the year — more than the combined total installed between 2017 and 2024.
In the fourth quarter alone, over 1,000 MW of new capacity came online. Large projects, including the 500 MW Liddell battery system in New South Wales, highlighted the rapid pace of expansion.
Australia’s experience shows how quickly storage can scale once policy support, market design, and financing align.
Data Centers Drive the “Race for Electrons”
A powerful new demand driver is reshaping electricity markets: data centers.
The rapid expansion of AI and cloud computing has triggered strong demand for reliable power. Gas turbine orders surged as operators sought firm capacity. This demand doubled U.S. turbine capital costs in just two years.
However, higher gas costs are improving the competitiveness of renewables and storage. In regions like California and parts of Texas, co-located solar and four-hour battery systems can already meet a significant share of data center demand at lower cost than new gas plants.
Grid interconnection queues and gas turbine supply constraints are also slowing fossil fuel projects. In contrast, solar and storage systems can often deploy more quickly.
As Vasdev explained, the world is in a “race for electrons” to meet rising demand from electrification and data centers. In many markets, renewables are not only cheaper for new builds — they are now undercutting the operating costs of existing fossil fuel plants.
Solar beats new coal and gas across most Asia-Pacific markets. Wind is the lowest-cost new generation source in the U.S. and Canada. Solar consistently outcompetes fossil fuels in Southern Europe, while wind dominates in Northern Europe.
From Niche Technology to Grid Backbone
Battery storage has moved beyond its early-stage niche. It is now central to power system planning.
As storage costs fall, batteries strengthen renewable energy revenues, stabilize grids, and reduce reliance on fossil-fuel peaking plants. Instead of building new gas capacity for short-duration peaks, operators can increasingly rely on storage-led balancing.
BNEF’s annual LCOE report analyzed more than 800 recently financed projects across over 50 markets and 28 technologies. Its expanded coverage of the Middle East and Africa highlights how storage economics are improving globally, not just in mature markets.
The broader message is clear. While 2025 delivered mixed signals for clean power costs, battery storage emerged as the clear winner. Manufacturing overcapacity, technological learning, and intense competition have driven prices to record lows.
Looking ahead, continued cost declines could accelerate the global shift toward renewable-dominated grids supported by flexible storage. In that transition, batteries are no longer optional. They are becoming the backbone of a reliable, low-carbon electricity system.
The post Renewables Plus Storage Surge as Battery Costs Drop Record Low, BNEF Reports appeared first on Carbon Credits.

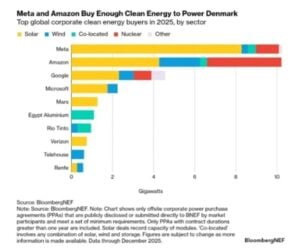
The U.S. is witnessing a surge in utility-scale solar development, driven by growing corporate demand for clean energy. Major tech companies like Meta and Google are securing long-term deals in Texas, combining renewable energy growth with economic and grid benefits.
This trend highlights how corporate commitments are shaping the future of the clean energy transition. Let’s find out.
Zelestra and Meta’s $600 Million Solar Deal
Madrid-based renewable energy firm Zelestra secured a massive $600 million green financing facility, signaling strong investor confidence in utility-scale solar. The funding, backed by Société Générale and HSBC, will support two large solar projects in Texas—Echols Grove (252 MW) and Cedar Range (187 MW).
These projects are not standalone efforts. Instead, they are part of a broader clean energy partnership with Meta, one of the world’s largest corporate renewable energy buyers. Together, they form a portion of a seven-project portfolio totaling 1.2 GW under long-term power purchase agreements (PPAs).
Sybil Milo Cioffi, Zelestra’s U.S. CFO, said:
“This financing marks a significant milestone in the delivery of our largest U.S. solar projects to date. It reflects strong confidence from Societe Generale and HSBC in our strategy and execution capabilities and reinforces our ability to attract first-class capital to support our growth platform in the U.S. market.”
Zelestra is strengthening its presence in the U.S. energy market with innovative solutions for hyperscalers and corporate clients. It is developing around 15 GW of renewable projects across key markets. In February 2026, BloombergNEF ranked Zelestra among the top 10 PPA sellers to U.S. corporations.
Solar Powering Meta’s Climate Strategy
Meta continues to aggressively expand its clean energy footprint. The company has made renewable energy procurement a core part of its climate roadmap—and the numbers clearly reflect that shift.
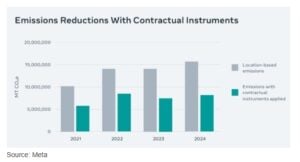
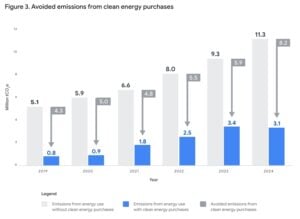
In 2024, Meta reported emissions of 8.2 million metric tonnes of CO₂e after accounting for clean energy contracts. In comparison, its location-based emissions stood at 15.6 million tonnes. This marked a sharp 48% reduction, largely driven by renewable energy purchases.
Moreover, the company has consistently maintained momentum:
- Since 2020, it has matched 100% of its electricity consumption with renewable energy.
- Over the past decade, it has secured more than 15 GW of clean energy globally.
- Overall, renewable energy procurement has helped cut 23.8 million MT CO₂e emissions since 2021.
As a result, Meta cut operational emissions by around 6 million tonnes in 2024 alone. At the same time, it tackled value chain emissions using Energy Attribute Certificates (EACs), reducing Scope 3 emissions by another 1.4 million tonnes.
Most of these deals were concentrated in the U.S., highlighting the country’s growing importance in corporate decarbonization strategies.
Importantly, this collaboration goes beyond just energy supply. It also aims to deliver broader economic benefits, including:
- Local job creation during construction
- Long-term tax revenue for the region
- Continued investment in local infrastructure
David Lillefloren, CEO at Sunraycer, said:
“These agreements with Google represent a significant milestone for Sunraycer and underscore the strength of our development platform. We are proud to support Google’s clean energy objectives while delivering high-quality renewable infrastructure in Texas.”
Additionally, the deal was facilitated through LevelTen Energy’s LEAP process, which simplifies and speeds up PPA execution. This highlights how innovative platforms are now playing a key role in scaling renewable deployment.
“Google’s data centers are long-term investments in the communities we call home,” said Will Conkling, Director of Energy and Power, Google. “This collaboration with Sunraycer will fuel local economic growth while helping to build a more robust and affordable energy future for Texas.”
Google, like Meta, has built a strong clean energy portfolio over time. Since 2010, it has signed over 170 agreements totaling more than 22 GW of capacity worldwide. Its long-term ambition is even more ambitious—achieving 100% carbon-free energy, every hour of every day, by 2030.
Why Texas Is Becoming the Center of Energy Transformation
All these developments point to one clear trend—Texas is rapidly becoming a global hub for clean energy and data center growth.
On one hand, the state offers strong solar resources, vast land availability, and a deregulated power market. On the other hand, it is witnessing a surge in electricity demand, especially from data centers and AI-driven workloads.
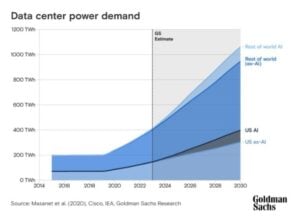
According to projections from the EIA, U.S. electricity demand could rise by 20% or more by 2030. Data centers are expected to play a major role in this growth. In fact, energy consumption from data centers increased by over 20% between 2020 and 2025.
As a result, energy infrastructure in Texas is facing growing pressure. Rising industrial activity, extreme weather events, and rapid digital expansion are all contributing to grid stress. Yet, at the same time, this demand is driving unprecedented investment in renewable energy.
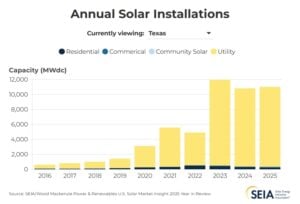
The EIA expects Texas to lead solar expansion in the coming years, accounting for nearly 40% of new solar capacity in the U.S. California will follow closely, and together, the two states will drive almost half of total additions.
Even though the sector has faced temporary slowdowns, the long-term outlook for U.S. solar remains highly positive.
In 2025, the U.S. added 53 GW of new electricity capacity—the highest annual addition since 2002. Notably, wind and utility-scale solar together generated 17% of the country’s electricity, a massive jump from less than 1% two decades ago.
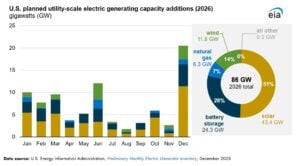
Looking ahead, growth is expected to accelerate again. Developers are planning to add around 86 GW of new capacity in 2026, which could set a new record. Solar alone is projected to account for more than half of this expansion.
Breaking it down further:
- Solar is expected to contribute 51% of new capacity
- Battery storage will make up 28%
- Wind will account for 14%
Utility-scale solar capacity additions could reach 43.4 GW in 2026, marking a 60% increase compared to 2025 levels.
Analysis: Corporate Demand Is Reshaping Energy Markets
Overall, the developments from Zelestra, Meta, Google, and Sunraycer highlight a broader transformation underway in global energy markets.
First, corporate buyers are no longer passive participants. Instead, they are actively shaping energy infrastructure through long-term PPAs. These agreements provide stable revenue for developers while ensuring a clean power supply for companies.
Second, financing is becoming more accessible. Large-scale funding deals, like Zelestra’s $600 million facility, show that banks are increasingly willing to back renewable projects with strong contractual support.
Third, regions like Texas are emerging as strategic energy hubs. The combination of rising electricity demand and favorable renewable conditions is attracting both developers and corporate buyers.
However, challenges remain. Grid reliability, permitting delays, and policy uncertainty could still impact the pace of deployment. Even so, the overall trajectory remains clear.
Clean energy demand is rising fast. Big Tech is leading the charge. And solar power is set to play a central role in meeting future electricity needs.
- READ MORE: Meta, Amazon, Google, and Microsoft Dominate Clean Energy Deals as Global Buying Slips in 2025
The post Texas Solar Market Heats Up with Meta and Google Investments appeared first on Carbon Credits.

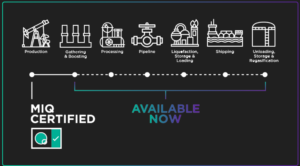
A major transaction in the methane market is drawing attention across the energy sector. Xpansiv and MiQ announced the settlement of 3.5 million methane certificates on the Xpansiv CBL exchange. This is one of the largest trades of its kind to date.
The deal involved a European energy buyer and a large integrated energy producer. It covered 3.5 million MMBtu of U.S.-produced natural gas, with emissions verified under the MiQ standard.
The transaction shows that methane certification is moving from pilot programs to real market activity. It also highlights the growing demand for transparent emissions data in global gas supply chains.
What Are Methane Certificates: Tracking Invisible Emissions
Methane certificates track the emissions intensity of natural gas. They provide independently verified data on how much methane is released during production and transport.
Xpansiv CEO John Melby stated:
“We are excited to support the energy sector’s transition to certified natural gas by providing secure and scalable market infrastructure to transact and settle these innovative instruments. This transaction sets a new benchmark for the integration of verified environmental performance in the global energy markets, enhancing precision, rigor, and integrity in responsible natural gas sourcing.”
Methane is a powerful greenhouse gas. According to the International Energy Agency, methane has a much higher warming impact, 80x more than carbon dioxide over the short term. So, reducing methane leaks is one of the fastest ways to cut global warming.
MiQ certificates assign grades based on emissions performance. These grades help buyers choose lower-emission gas. The system creates a financial incentive for producers to reduce methane leaks.
Certification also supports compliance. The European Union Methane Regulation requires companies to measure and report methane emissions using strict standards.
As rules tighten, verified data becomes more valuable. This is driving demand for certified gas and related environmental products.
From Pilot to Market Reality
This transaction is not just large. It also shows how methane markets are evolving.
- First, it demonstrates that market infrastructure is maturing. The trade was settled through Xpansiv’s CBL exchange, which allows secure and transparent transactions without complex bilateral agreements.
- Second, it reflects growing cross-border demand. European buyers are increasingly seeking certified gas to meet regulatory and corporate climate goals.
- Third, it sets a benchmark for scale. Earlier, methane certificate trading was limited. This deal shows that multi-million unit transactions are now possible.
Industry leaders see this as a step toward integrating emissions data into everyday energy trading. It brings methane performance closer to becoming a standard market factor, like price or volume.
Rising Demand from Data Centers and Energy Use
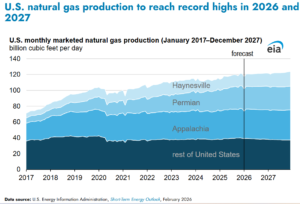
One key driver of methane certificate demand is rising energy consumption. The U.S. Energy Information Administration projects that U.S. natural gas use could increase by up to 7.3% between 2025 and 2027. It is also expected to hit a record-high 122.3 Bcf/d in 2027.
A major reason is data center growth. Artificial intelligence and cloud computing require large amounts of electricity. Many data centers rely on natural gas for reliable power.
Tech companies are now looking at emissions across their energy supply chains. This includes methane emissions from gas production. Methane certificates offer a way to track and manage these emissions.
This trend links digital growth with environmental accountability. As data demand rises, so does the need for cleaner energy sourcing.
A Rapidly Expanding Market and Emerging Trends
Methane certification is part of a broader expansion in environmental markets. Platforms like Xpansiv support trading in:
- Carbon credits
- Renewable energy certificates
- Methane performance certificates
These markets are growing quickly. On Xpansiv’s CBL exchange, trading volumes in environmental commodities have reached millions of tons annually, with strong growth in recent years.
MiQ has grown rapidly since its launch and is now a major player in methane certification. Today, MiQ certifies about 25% of U.S. natural gas production and more than 5% of global gas supply.
The MiQ registry now holds billions of issued certificates, creating a large pool of tradable emissions performance data. This scale shows that methane performance is moving beyond pilot stages and into mainstream markets.
Georges Tijbosch, CEO, MiQ, said:
“Our program gives buyers the trusted, independently verified emissions data they need to make smart choices—raising the bar for openness and accountability in the natural gas industry.”
Demand for methane certificates will grow as global regulations tighten. The IEA’s Global Methane Tracker 2025 shows that methane pledges cover about 80% of global fossil fuel production. However, only a small part has enforceable rules. This points to a rising need for verified emissions data.
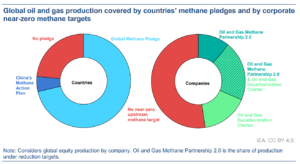
In the EU, strict laws require ongoing monitoring, reporting, and quick leak repairs. Frameworks like OGMP 2.0 already cover around 42% of global oil and gas production. This pushes companies toward certification based on measurements.
Globally, methane causes about 30% of temperature rise since the Industrial Revolution, reinforcing regulatory urgency. As compliance moves from estimates to verified data, certified methane tracking systems are crucial for market access and trade.
At the same time, many firms are setting stricter climate targets that include methane performance. Investors are also pushing for better emissions data across energy supply chains.
Some industry forecasts suggest that markets for methane performance data and certificates could grow by more than 60% annually in the next several years. Together, these trends are likely to support continued growth in the methane certificate market.
Infrastructure is also improving. Exchanges like CBL help provide price signals and liquidity. Partnerships with firms like S&P Global aim to improve market transparency and data quality.
What This Means for the Energy Transition
The 3.5 million certificate trade highlights a broader shift in energy markets. Emissions data is becoming part of how energy is bought and sold.
Natural gas remains a key fuel in the global energy mix. But buyers are increasingly focused on how it is produced. Lower-emission gas may gain a competitive advantage.
Methane certification offers a practical tool. It allows companies to:
- Track emissions,
- Improve performance,
- Meet regulatory requirements, and
- Support climate targets.
This aligns with wider efforts to reduce greenhouse gas emissions while maintaining energy supply. In the coming years, methane certification could become a standard part of natural gas trading. It may also link more closely with carbon markets and broader climate finance systems.
With this development, the direction is clear. Environmental performance is becoming a measurable and tradable part of energy markets. Deals like this signal that the shift is already underway.
- READ MORE: Shell’s Initiative to Cut Methane in Rice Farming in the Philippines and Create Carbon Credits
The post A Record 3.5M Methane Credits Trade at Xpansiv CBL Signals New Era for Gas Markets appeared first on Carbon Credits.
Carbon tends to sit at the forefront of climate considerations, but there’s another important, interconnected piece of the sustainability puzzle that often gets overlooked: water.
Globally, 4 billion people face severe water scarcity for at least one month out of every year, according to the United Nations University Institute for Water, Environment and Health (UNU-INWEH).
Like with global warming, human activities have had a major impact on water systems. Not only are we often using too much water, but issues like land use change and rising temperatures also stress freshwater ecosystems and the water cycle.
If we ignore these issues, more water systems will be permanently damaged. That likely means more people will live with insufficient access to clean water, agricultural production will become more difficult and expensive, and many businesses will face economic risks, like supply chain delays and shortages.
Fortunately, there are ways to reduce water risks and even improve water systems.
One option is to purchase water credits. Similar to how carbon credits emerged as a solution for offsetting hard-to-avoid greenhouse gas emissions, water credits provide a market-based solution for conserving and restoring water systems.
Here, we’ll take a deeper dive into:
- What are Water Credits?
- How do Water Credit Projects Work?
- Water Credit Project Types and Examples
- Benefits of Water Credits
- Why Individuals and Businesses Should Buy Water Credits
What Are Water Credits?
If you’re familiar with carbon credits, you already get the gist of water credits.
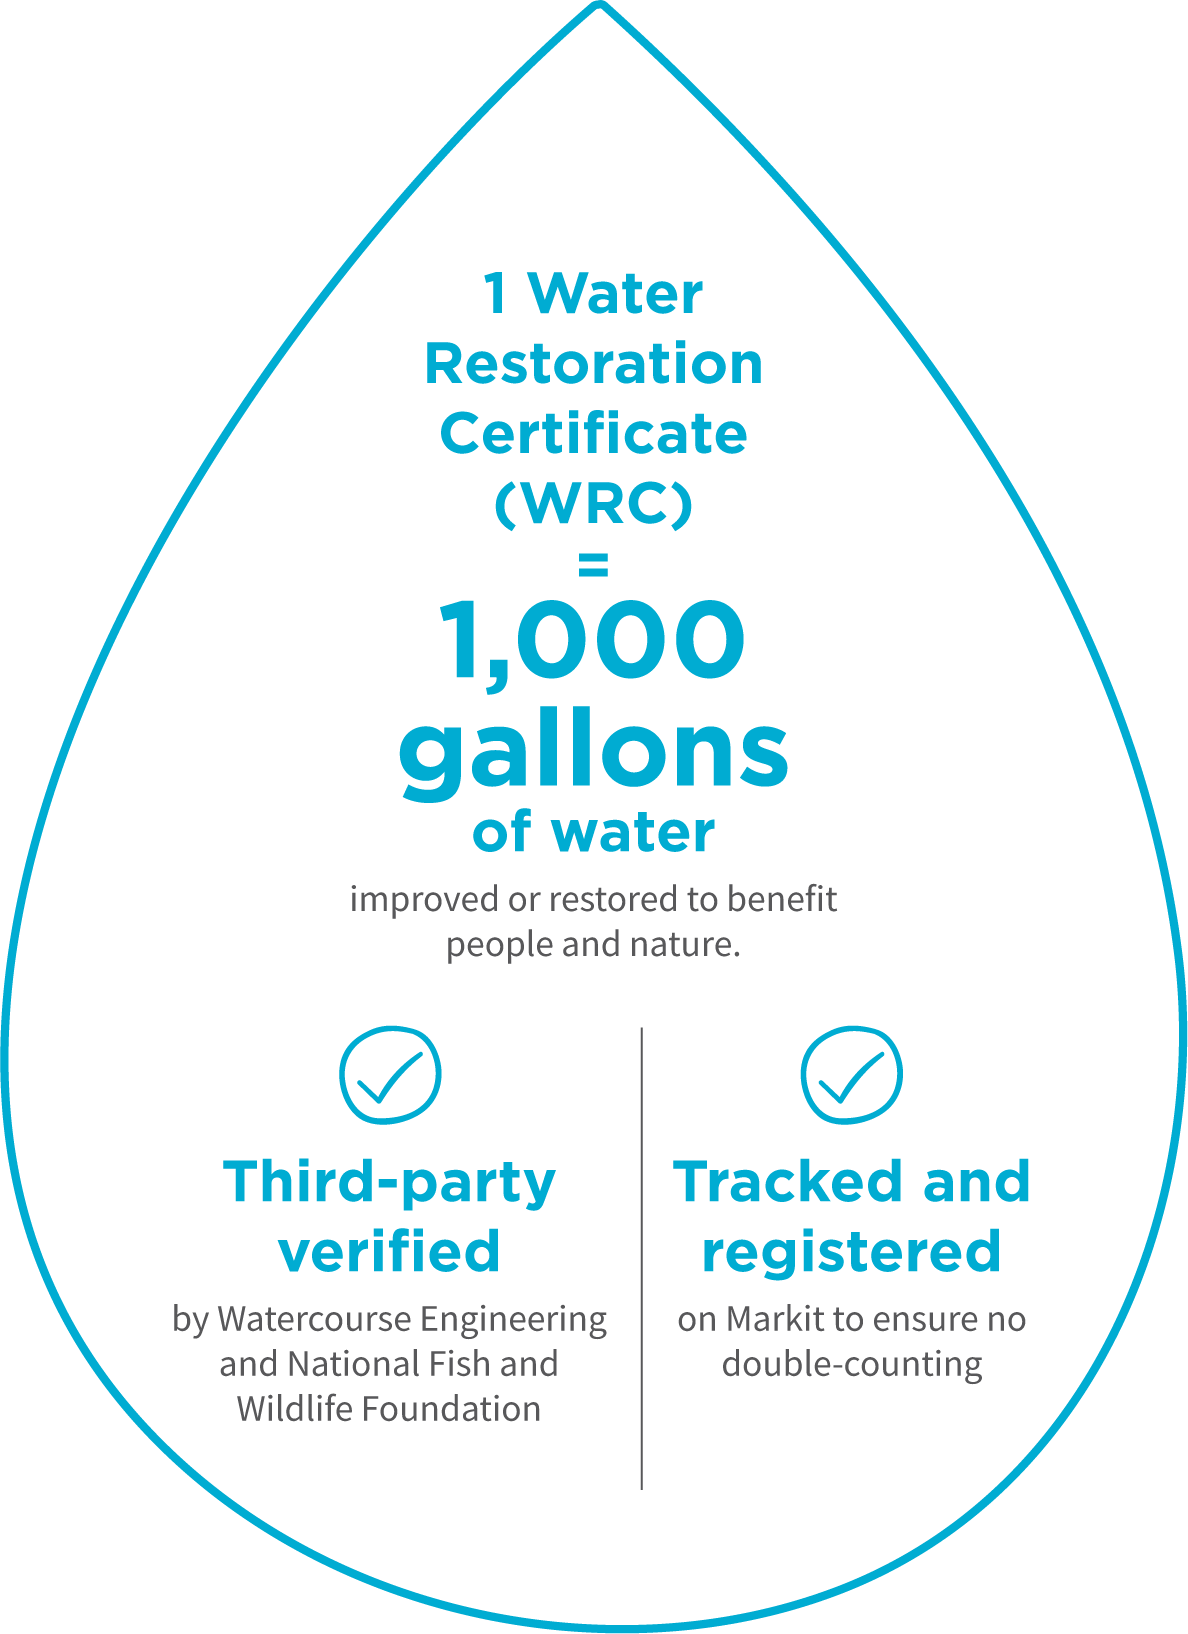
Similar to how one carbon credit represents one metric ton of carbon dioxide equivalent avoided or removed from the atmosphere, one water credit represents 1,000 gallons of natural freshwater flow that has been improved or restored.
Water credit projects involve protecting, restoring, or conserving water flows to ultimately help natural systems like rivers, wetlands, and aquifers, along with the communities that rely on them.
Source: Bonneville Environmental Foundation
For example, leading project developer Bonneville Environmental Foundation (BEF) issues Water Restoration Certificates® that are third-party verified, namely by Watercourse Engineering or the National Fish and Wildlife Foundation. All BEF WRC® projects are also tracked and registered on S&P Global’s Markit registry to avoid double-counting.
Other water credit programs exist, but BEF WRCs® are arguably the most established market-based solution for addressing your water footprint.
Terrapass offers BEF WRC® certificates that support projects like the Middle Deschutes River Flow Restoration project in Oregon, which in turn helps support a healthy ecosystem for local wildlife and communities.
Buy BEF WRCs® through Terrapass today.
How Do Water Credit Projects Work?
Water credit projects work similarly to carbon credit projects in terms of directing financing toward initiatives that support the restoration of natural freshwater flows and ecosystems.
Water restoration project developers like BEF work with farmers, conservation groups, and local irrigation districts to identify these opportunities and manage the projects. Water restoration projects also meet additionality requirements, meaning that without the funding from water credits, the projects would not be possible.
For example, funding might go towards the cost and effort of securing legal agreements that help restore river flows. This is necessary to help overcome challenges like “use it or lose it” water rights policies in the Western U.S. By maintaining a water source for ecological purposes, water rights holders can maintain their water rights while addressing old and inefficient requirements like the obligation to use all of their allotted water.
Note that since water issues are largely regional, best practice is to purchase credits from water restoration projects that help relieve water stress in the same basins where you’re using water. However, water credit projects are mostly concentrated in the Western U.S. where water stress is more severe, so matching projects to your location isn’t always possible. If that’s the case, buying a mixed portfolio of water credits can still compensate for your impact, it just might not directly address water issues in the areas you operate.
Water Credit Timing
Each water credit directly translates to 1,000 gallons of natural freshwater improved or restored over an 18-month cycle.
Note that while these projects might provide long-lasting water benefits, along with other associated environmental and social benefits, best practice is for buyers to only count water credits against their water footprint for the year in which these certificates are purchased.
To address your water footprint for multiple years, buyers can purchase water credits for each year they want to balance their water impact, similar to how you would purchase carbon credits corresponding to each year’s emissions.
Also note that water credits have vintages, which refer to the primary year when the water restoration took place. Like with carbon credits, best practice for water credits is to buy ones with recent vintages — generally within the last five years, but ideally within the past three. However, you don’t have to match vintages with the year of your own water consumption, as you’re still funding water improvements that help balance your own footprint.
Water Credit Project Types and Examples
BEF WRC® projects fall into one of three main categories:
- Restoring Flows: These projects often involve legal transactions like water rights transfers and partnerships with local groups to help keep water flowing in rivers and streams, rather than overly diverted, like for inefficient agricultural practices.
Example — Jordan River Flow Restoration: This project uses Environmental Water Transactions (EWTs) to help secure more water flowing from the Jordan River into the Great Salt Lake in Utah, which helps address the critical shrinking of this lake.
- Restoring Natural Systems: While similar to restoring flows, this project category focuses more on physical interventions to help restore freshwater systems like rivers and wetlands to their natural state, thereby increasing freshwater and potentially providing co-benefits like cleaner water.
Example — Pine Tree Brook Dam Removal: This project removes dams in the Pine Tree Brook in the Boston area to support the movement of local trout and improve water quality. For example, one of the dams on this brook was previously put in place to create a local ice rink, but that was no longer needed due to the 1950s construction of a nearby ice rink facility that does not rely on this water source. So, removing it helped return the brook to more of its natural order.
- Improving Efficiency: Some water credit projects focus more on conservation and efficient water use, which can thereby help retain or restore water in natural systems.
Example — Mason Lane Headgate: In Arizona, the Mason Lane Ditch diverts a tributary of the Verde River to irrigate agricultural land. This project funds the replacement of an inefficient headgate system with a modern, automated one to enable more precise control of the diverted water.
Benefits of Water Credits
In addition to directly supporting freshwater restoration, water credits provide a wide range of co-benefits, such as supporting:
- Groundwater conservation: Projects that minimize groundwater usage not only can improve water volume but also provide benefits like stabilization of river beds. That helps to avoid problems like sinking land and enables water systems to maintain natural filtration capabilities.
- Biodiversity: Water restoration projects often support biodiversity, like providing a healthier habitat for local fish and bird populations. That can provide associated environmental and economic benefits, like supporting pollinators and keeping local fisheries well-stocked.
One example of biodiversity co-benefits can be seen in the Merced County Seasonal Wetland Habitat project, which aims to provide an annual spring habitat for migratory birds in central California.
You can support projects like these by buying BEF WRCs® through Terrapass today.
- Recreation: Maintaining freshwater ecosystems helps provide communities with recreational opportunities, such as fishing, boating, and hiking. That can correlate with economic opportunities for these areas, while also supporting the health of local populations.
- Agricultural economies: The funding from water credits can directly support farmers and ranchers, providing an important income stream that can help mitigate issues like crop shortages. Long term, water credits can also support a more stable water supply that sustains these agricultural businesses season after season, even amidst increasing floods and droughts caused by climate change.
- Community empowerment: Water credits often involve working with tribal groups and other local communities. The economic, ecological, and recreational benefits can help protect these communities’ cultures and rights.
- Lower emissions: While water credits are separate from carbon credits, there can be interconnected benefits. For example, more efficient irrigation systems can use less water and energy. More reliable water supplies can also reduce the need for high-emitting fertilizers.
Why Individuals and Businesses Should Buy Water Credits
Water risk sometimes gets overshadowed by carbon emissions risk, but it’s important for both individuals and businesses to consider their water footprints. Buying water credits enables you to account for the impact of your water usage while supporting a broad range of environmental, economic, and social benefits.
In particular, consider the following:
For Individuals
You likely use far more water than you assume, particularly when accounting for indirect usage, like the water that went into making the jeans you bought. One survey from American Water found that most Americans think they use less than 100 gallons of water per day, when really total usage adds up to over 2,000 gallons daily, based on data from Water Footprint Network.
While it’s important to be mindful of your water usage, we’re all inevitably going to use water throughout our daily lives. So, purchasing water credits helps you take responsibility for the impact of this water usage while funding projects that have a wide range of co-benefits you may value.
For Businesses
Just as many companies acknowledge climate risk and commit to addressing greenhouse gas emissions, water scarcity and overuse can have direct economic effects on businesses, along with creating risks like reputational damage. By 2050, 31% of global GDP is projected to be exposed to high water stress, according to the World Resources Institute.
So, buying water credits can address your company’s direct water footprint and contribute to solving water scarcity and quality issues that can harm your operations going forward. Meanwhile, businesses can potentially increase goodwill with customers, employees, and the local communities where they operate by supporting water credit projects that have meaningful co-benefits.
Buying water credits can also align with other standards and certifications that many businesses value. Some examples include:
- WRI’s Volumetric Water Benefit (VWB) Accounting 2.0: Water credit projects can potentially align with this VWB accounting standard, and Bonneville Environmental Foundation was one of WRI’s partners involved in creating it. Still, consider looking into the details of this accounting standard and project specifics to determine alignment.
- UN Sustainable Development Goals (SDGs): Depending on the specific project, there can be benefits that align with multiple SDGs. For example, a project might align with SDG 6: Clean Water and Sanitation, while also supporting local economic development that aligns with SDG 11: Sustainable Cities and Communities.
- LEED Certification: Water credits can be matched to a building’s annual water usage and counted toward this green building certification.
- 1% for the Planet: BEF is an environmental partner of 1% for the Planet, so buying BEF WRCs® can qualify a company for membership.
- B Corp: Buying water credits can also count toward earning B Corp certification.
Ready to Support Water Restoration?
Terrapass makes it easy for you to balance your water footprint while supporting sustainable ecosystems and community development.
You can directly purchase BEF WRCs® through Terrapass today or reach out to speak with one of our sustainability experts who can help you build a custom portfolio of carbon credits and water credits that align with your sustainability goals.
Talk to a Sustainability Expert
The post The 2026 Complete Guide to Water Credits (WRCs) appeared first on Terrapass.


-
Greenhouse Gases8 months ago
Guest post: Why China is still building new coal – and when it might stop
-
Climate Change8 months ago
Guest post: Why China is still building new coal – and when it might stop
-

 Greenhouse Gases2 years ago
嘉宾来稿:满足中国增长的用电需求 光伏加储能“比新建煤电更实惠”
-
Climate Change2 years ago
Bill Discounting Climate Change in Florida’s Energy Policy Awaits DeSantis’ Approval
-

 Climate Change2 years ago
嘉宾来稿:满足中国增长的用电需求 光伏加储能“比新建煤电更实惠”
-
Climate Change Videos2 years ago
The toxic gas flares fuelling Nigeria’s climate change – BBC News
-

 Carbon Footprint2 years ago
US SEC’s Climate Disclosure Rules Spur Renewed Interest in Carbon Credits
-

 Renewable Energy5 months ago
Sending Progressive Philanthropist George Soros to Prison?