

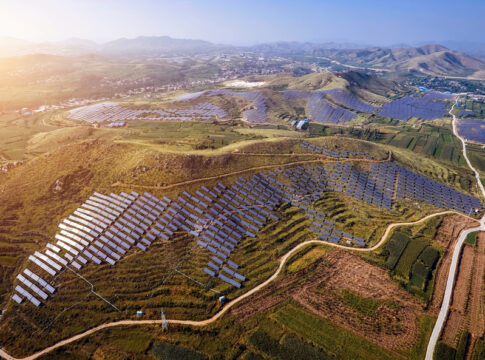
Global investment in renewable energy hit record levels in 2024–25, driven by solar, wind, and power grid upgrades. At the same time, China broke new ground with a vast solar farm the size of Chicago. Together, these developments offer a powerful sign of how the world is reshaping its energy system—though unevenly.
Global Green Energy Investment Hits New Highs
In 2024, global investment in renewable power and fuels hit a record $622.5 billion. This happened even with high interest rates and supply disruptions. Utility-scale solar accounted for 63% of the total, followed by wind at 35%, with most of the growth coming from cost drops and policy support.
This trend continued in early 2025. In the first half of the year, companies put $386 billion into new renewable projects. This is a 10% rise from last year.
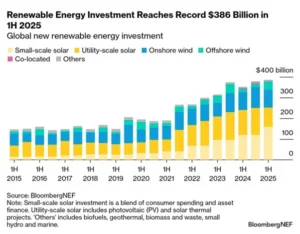
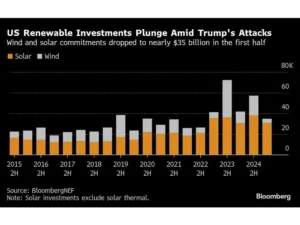
However, investment in U.S. wind and solar fell by 13% compared to the same time in 2024. The decline followed political shifts that created uncertainty for developers, especially in wind energy.
Meanwhile, solar capacity surged. In 2024, the world added 582 GW of new renewable capacity—a 20% year-on-year increase—bringing total global capacity to 4,443 GW. Most of this came from solar (452 GW) and wind (114 GW), with China alone adding 61% of new solar and nearly 70% of new wind capacity.
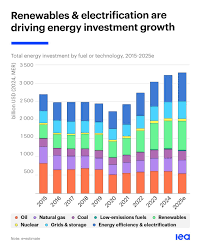
According to the International Energy Agency, global energy investment is set to reach $3.3 trillion in 2025, with $2.2 trillion going toward renewable technologies. That’s more than double what’s being spent on fossil fuels ($1.1 trillion).
America Slows, Europe Steps Into the Spotlight
While clean energy momentum grew worldwide, the U.S. green investment trend weakened. In early 2025, U.S. renewable investment fell 36% (about $20 billion), as policymakers rolled back support for wind and solar and halted new projects. These include major offshore wind farms near New England, citing vague national security concerns. The U.S. dropped out of the top five global wind markets for the first time since 2016.
In contrast, the European Union saw wind investment surge to $40 billion, up 63% year-on-year, making it a magnet for green capital amid U.S. policy uncertainty. Other regions—such as the ‘sunbelt’ countries (India, Mexico, Brazil, South Africa)—also posted growing pipelines of clean energy projects, though many remain underfunded.
A Chicago-Sized Farm Lights Up the Grid
China has taken its commitment to renewables one step further with the launch of a massive solar power facility on the Tibetan Plateau. It covers around 610 square kilometers—roughly the size of Chicago.
This project taps into vast desert sunshine. It forms part of China’s strategy to aggressively expand renewables. In the first half of 2025, China added 212 GW of solar and 51 GW of wind capacity. At the same time, carbon emissions fell by about 1%. This shows that growth and emissions decline can happen together.
China finished a 3.5 GW solar farm in Xinjiang’s desert. It will produce 6.09 billion kWh each year, enough to power 3 million homes. This project will also help avoid nearly 6.07 million tons of CO₂ annually. This single plant costs about $2.13 billion.
These projects highlight China’s push for 1,200 GW of solar and wind capacity by 2030. This goal is part of its plan to get 80% of power from non-fossil sources by 2060.
Why It Matters: Climate, Security, Speed
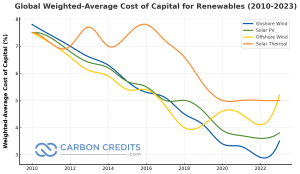
The cost of renewable energy has dropped sharply. Utility solar is now 84% cheaper than in 2009. Wind energy is also down 56%. This makes both cheaper than new coal or gas in almost every market. These price drops mean clean energy is now a viable, market-driven choice—not just a subsidized one.
BloombergNEF reports that in 2024, $1.93 trillion went to mature clean technologies. This includes solar, storage, EVs, and grid upgrades. In contrast, only $155 billion was invested in emerging solutions like green hydrogen and CCS.
Yet, investment must rise to about $1.3 trillion annually by 2030 to stay on track with Paris goals—current levels meet only about 37% of that need.
Investment Gap and Equity
Despite growth, developing regions lag behind. Sub-Saharan Africa, for example, hosts 20% of the global population but receives less than 2% of clean energy investment. To address climate and energy equity, public finance and international cooperation must scale investment flows to underserved regions.
Global capital flows and megaprojects like China’s new solar farm show how renewable energy is shifting from vision to reality. Yet, disparities still exist. The speed of change relies on national policies, investor confidence, and smart infrastructure investments.
What’s Next: Can Investment Keep Pace with Climate Targets?
With all these developments in renewables, what could be the next trends to watch? Here are some interesting things to look out for:
- Can U.S. policy stabilize? The U.S. retreat from wind has shaken investor confidence. If federal support returns—via tax credits or streamlined permitting—it could help reverse the slide.
- Will emerging markets rise fast enough? Sunbelt countries and the Global South have strong solar potential, but they need financing tools like green bonds, development loans, and risk-sharing platforms to close the funding gap.
- How fast will China scale up? China is setting global records in solar and wind. Its ability to build out grid capacity and transmission will determine whether power can flow from remote solar farms to dense urban uses.
- Can investment match climate targets? Global clean energy must nearly triple by 2030. That means sustained growth in private and public capital, cost reductions, and regulatory support across regions.
The first half of 2025 has underscored both the promise and the complexity of the global clean energy transition. With US$386 billion invested in renewables worldwide, momentum remains strong, even as regional differences emerge.
The U.S. slowdown highlights how changes in policy and market uncertainty can hinder growth. In contrast, countries in Europe, Asia, and the Middle East are speeding up their deployment efforts.
With energy demand rising, ongoing investment will be critical for ensuring that renewables can deliver on their promise of powering economies while cutting emissions.
- READ MORE: Clean Energy Beats Fossil Fuel in Historic $3.3T Global Energy Investment in 2025, IEA Report
The post Renewable Energy Reaches Record High as China Operates World’s Biggest Solar Farm appeared first on Carbon Credits.

EU carbon credit claims changed on 27 September 2026, the day the Directive (EU) 2024/825 began to apply across the European Union. The change is narrow. It changes how a company can talk about the credits it buys. A product can no longer be called neutral on the strength of compensation alone; however, every specific, evidenced statement about what a company measured, reduced, and funded stays fully available.

The post Promoting Improved Cooking Practices in Nigeria appeared first on Terrapass.



-
Climate Change1 year ago
Guest post: Why China is still building new coal – and when it might stop
-

 Greenhouse Gases2 years ago
嘉宾来稿:满足中国增长的用电需求 光伏加储能“比新建煤电更实惠”
-
Greenhouse Gases1 year ago
Guest post: Why China is still building new coal – and when it might stop
-

 Climate Change2 years ago
嘉宾来稿:满足中国增长的用电需求 光伏加储能“比新建煤电更实惠”
-

 Renewable Energy12 months ago
Sending Progressive Philanthropist George Soros to Prison?
-
Climate Change2 years ago
Bill Discounting Climate Change in Florida’s Energy Policy Awaits DeSantis’ Approval
-
Greenhouse Gases1 year ago
嘉宾来稿:探究火山喷发如何影响气候预测
-

 Climate Change2 years ago
Analysis: China’s CO2 falls 1% in Q2 2024 in first quarterly drop since Covid-19