Connect with us

Published

on

From canola farmers in Canada to car owners in India, biofuels have become the subject of everyday debate across the world.

Liquid biofuels feature heavily in the climate plans of many countries, as governments prioritise domestic energy security amid geopolitical challenges, while looking to meet their climate targets and bolster farm incomes.

Despite a rapid shift towards electrified transportation, biofuels continue to play a leading role in efforts to reduce road-transport emissions, as they work well with many existing car engines.

At the same time, biofuels are expected to play an important role in decarbonising sectors where emissions are particularly challenging to mitigate, such as shipping, trucking and aviation.

Heated debates continue around using food sources as fuel in the face of record hunger levels, given competing demands for land and crops.

Despite these arguments, biofuels are seeing heightened demand bolstered by a strong policy push, particularly in developing countries.

They are expected to feature heavily on the COP30 agenda this year as a key feature of the host Brazil’s “bioeconomy”.

Below, Carbon Brief unpacks what biofuels are, their key benefits and criticisms, plus how they are being used to meet climate targets.

What are biofuels? 

Bioenergy refers to all energy derived from biomass, a term used to describe non-fossil material from biological sources. Biofuels, in turn, are liquid fuels that are produced from biomass.

These sources are wide-ranging, but commonly include food crops, vegetable oils, animal fats, algae and municipal or agricultural waste, along with synthetic derivatives from these products.

Glossary

Biomass

Non-fossil material of biological origin

Biofuel

Fuels produced directly or indirectly from biomass

Feedstock

Types of biomass used as sources for biofuels, such as crops, grasses, agricultural and forestry residues, wastes and microbial biomass

Bioenergy

All energy derived from biofuels

Bioethanol

A biofuel used as a petrol substitute, produced from the fermentation of biomass from plants like corn, sugarcane and wheat

Biodiesel

A biofuel used as a diesel substitute, derived from vegetable oils or animal fats through a process called transesterification

The different types of biomass are referred to as “feedstocks”. They are converted to fuel through one or more processes, such as fermentation or treating them with high temperatures or hydrogen.

Biofuels are frequently blended with petroleum products in an effort to reduce emissions and reliance on fossil-fuel imports.

Experiments to test whether vegetable oils could run in combustion engines began in the early 1900s. In a 1912 paper, Rudolf Diesel – the inventor of the diesel engine – presciently noted that these oils “make it certain that motorpower can still be produced from the heat of the sun…even when all our natural stores of solid and liquid fuels are exhausted”.

An extract from Rudolf Diesel’s 1912 paper, published in the Proceedings of the Institution of Mechanical Engineers, outlining the importance biofuels could assume in the future. Credit: Proceedings of the Institution of Mechanical Engineers (1912)

Biofuels are divided into four “generations”, based on the technologies and feedstocks used to synthesise them.

Type of biofuel Source
First-generation Food crops (eg, sugarcane, corn, wheat, rice)
Second-generation Non-edible crops and materials (eg, straw, grasses, used vegetable oil, forest residues, waste)
Third-generation Aquatic materials (eg, algae)
Fourth-generation Genetically modified algae, bacteria and yeast, as well as electrofuels, synthetic fuels and e-fuels

First-generation biofuels

The first – and earliest – generation of biofuels comes from edible crops, such as corn, sugarcane, soya bean and oil palm. Large-scale commercial production of these fuels began in the 1970s in Brazil and the US from sugarcane and corn, respectively.

A monoculture corn crop being harvested in Michigan, US. Credit: Jim West / Alamy Stock Photo

Bioethanol, for instance, is drawn from the fermentation of sugars in corn, sugarcane and rice. Biodiesel is derived from vegetable oils – such as palm, canola or soya bean oil – or animal fats, through a process called transesterification, which makes them less viscous and more suitable as fuels.

Most ethanol is produced using a “dry-mill” process, where grain kernels are ground, slurried, fermented and purified. Source: Renewable Fuels Association (2025). Graphic: Carbon Brief

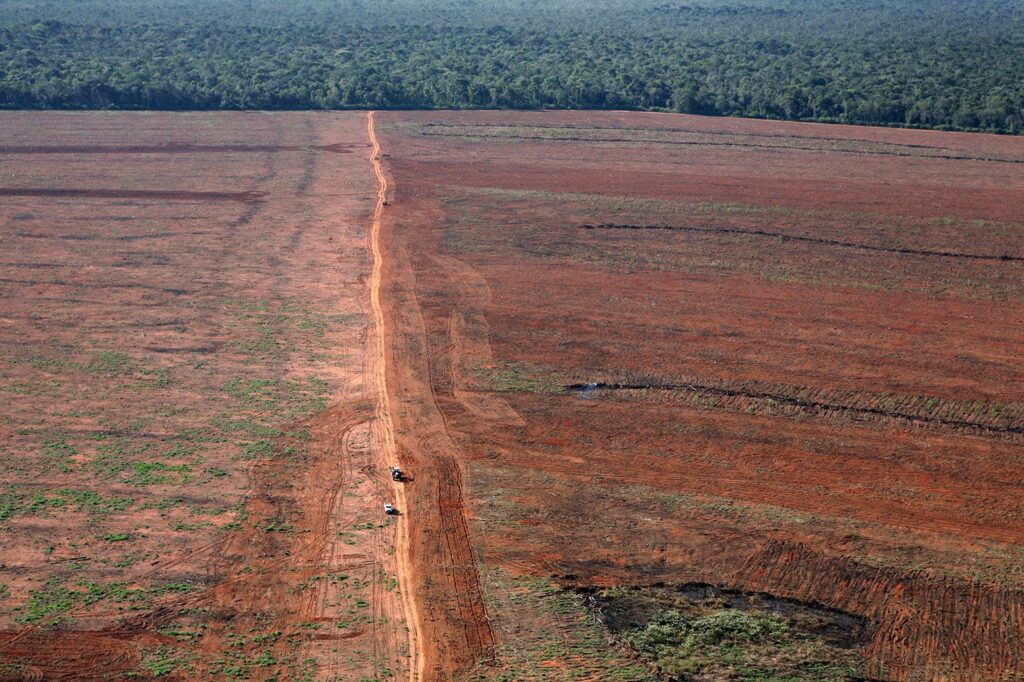
Because they are derived directly from food crops, experts and campaigners have expressed concerns over the impacts of first-generation biofuels on forests, food security and the environment, as well as indirect land-use change impacts. (See: What are some of the main criticisms of biofuels?

Several studies have found that the land-use emissions of first-generation biofuels are severely underestimated, but other experts tell Carbon Brief that this depends on how and where the crops are grown, processed and transported.

According to Dr Angelo Gurgel, principal research scientist at the Massachusetts Institute of Technology (MIT) Center for Sustainability Science and Strategy, the “big image that biofuels are bad” is not always accurate. Gurgel explains:

“Some biofuels can be better than others, varying from place to place and feedstock to feedstock. It depends on where you produce them, how much farmers can increase yields, how effectively a country’s regulations help avoid land-use change and how closely it is connected to international markets.

“Some options may be very, very good in terms of reducing emissions and other options probably will be very bad.”

Second-generation biofuels

Second-generation biofuels are extracted from biomass that is not meant for human consumption. 

Feedstocks for these biofuels are incredibly varied. They include agricultural waste, such as straw and corn stalks, grasses, forest residues left over from wood processing, used vegetable oil and solid waste. They can also be made from energy crops grown specifically to serve as biofuels, such as jatropha, switchgrass or pongamia.

Close-up of a jatropha plant and its seed pods. Credit: Andris Lipskis / Alamy Stock Photo.

Derived from “waste” or grown on “marginal” land, second-generation biofuels were developed in the early 2000s. These fuels aimed to overcome the food security and land-use issues tied to their predecessors, while increasing the amount of fuel drawn out from biomass, compared to first-generation feedstocks.

These feedstocks are either heated to yield oil or “syngas” and then cooled, or treated with enzymes, microorganisms or other chemicals to break down the tough cellulose walls of plants. They can be challenging to process and present significant logistical and land-use challenges.

Third-generation biofuels

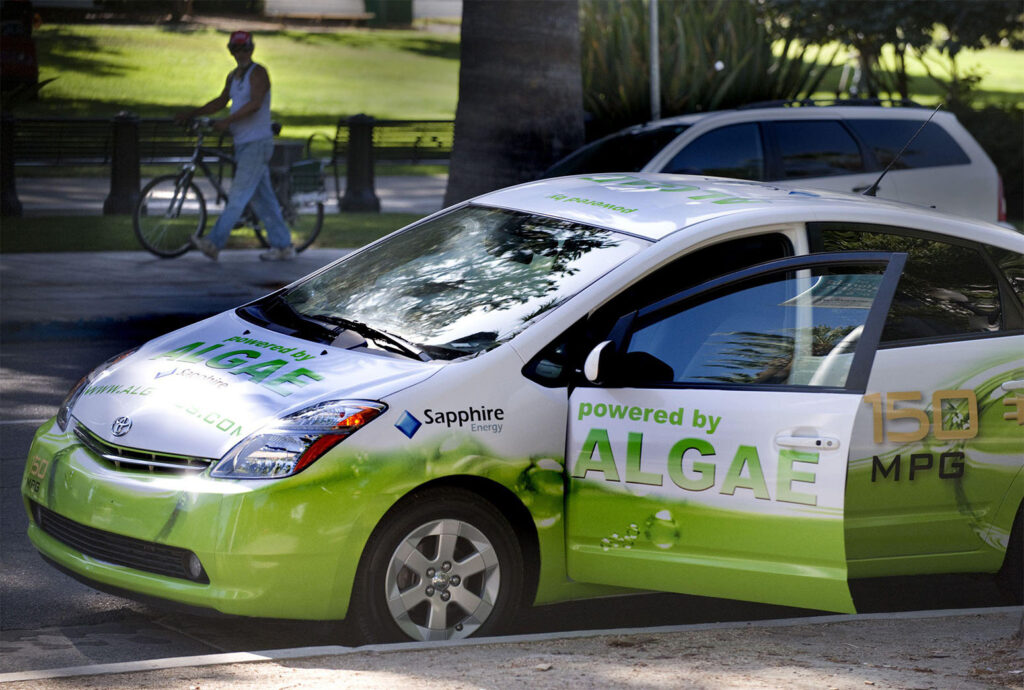
Third-generation biofuels are primarily derived from aquatic organic material, particularly algae and seaweed. While the US Department of Energy began its aquatic species programme in 1978 to research the production of biodiesel from algae, algal biofuel research saw a “sudden surge” in the 1990s and “became the darling” of renewable energy innovation in the early 21st century, says Mongabay.

Because algae grows faster than terrestrial plants, is high in lipid (fatty organic) content and does not compete with terrestrial crops for land use, many scientists and industry professionals consider third-generation biofuels an improvement over their predecessors. 

However, high energy, water and nutrient needs, high production costs and technical challenges are key obstacles to the large-scale production of algae-based biofuels. Since the early 2010s, many companies, including Shell, Chevron, BP and ExxonMobil, have abandoned or cut funding to their algal biofuel development programmes.

The Algaeus, a 2009 modified version of the Toyota Prius designed to run on electricity and algal biofuels. Credit: Sipa USA / Alamy Stock Photo.

Fourth-generation biofuels

Genetically modified algae, bacteria and yeast engineered for higher yields serve as the feedstock for fourth-generation biofuels. These fuels have been developed more recently – from the early 2010s onwards – and are an area of ongoing research and development.

Some of these organisms are engineered to directly or artificially photosynthesise solar energy and carbon dioxide (CO2) into fuel; these are called solar biofuels.

Others – called electrofuels, synthetic fuels or e-fuels – are produced when CO2 captured from biomass is combined with hydrogen and converted into hydrocarbons through other processes, typically using electricity generated from renewable sources.

Fourth-generation biofuels are technology- and CO2-intensive and expensive to produce. They also run up against public perception and legal limitations on genetically modified organisms, as well as concerns around biosafety and health.

What are the most common biofuels being used today?

Bioethanol is the most commonly used liquid biofuel in the world, followed by biodiesel.

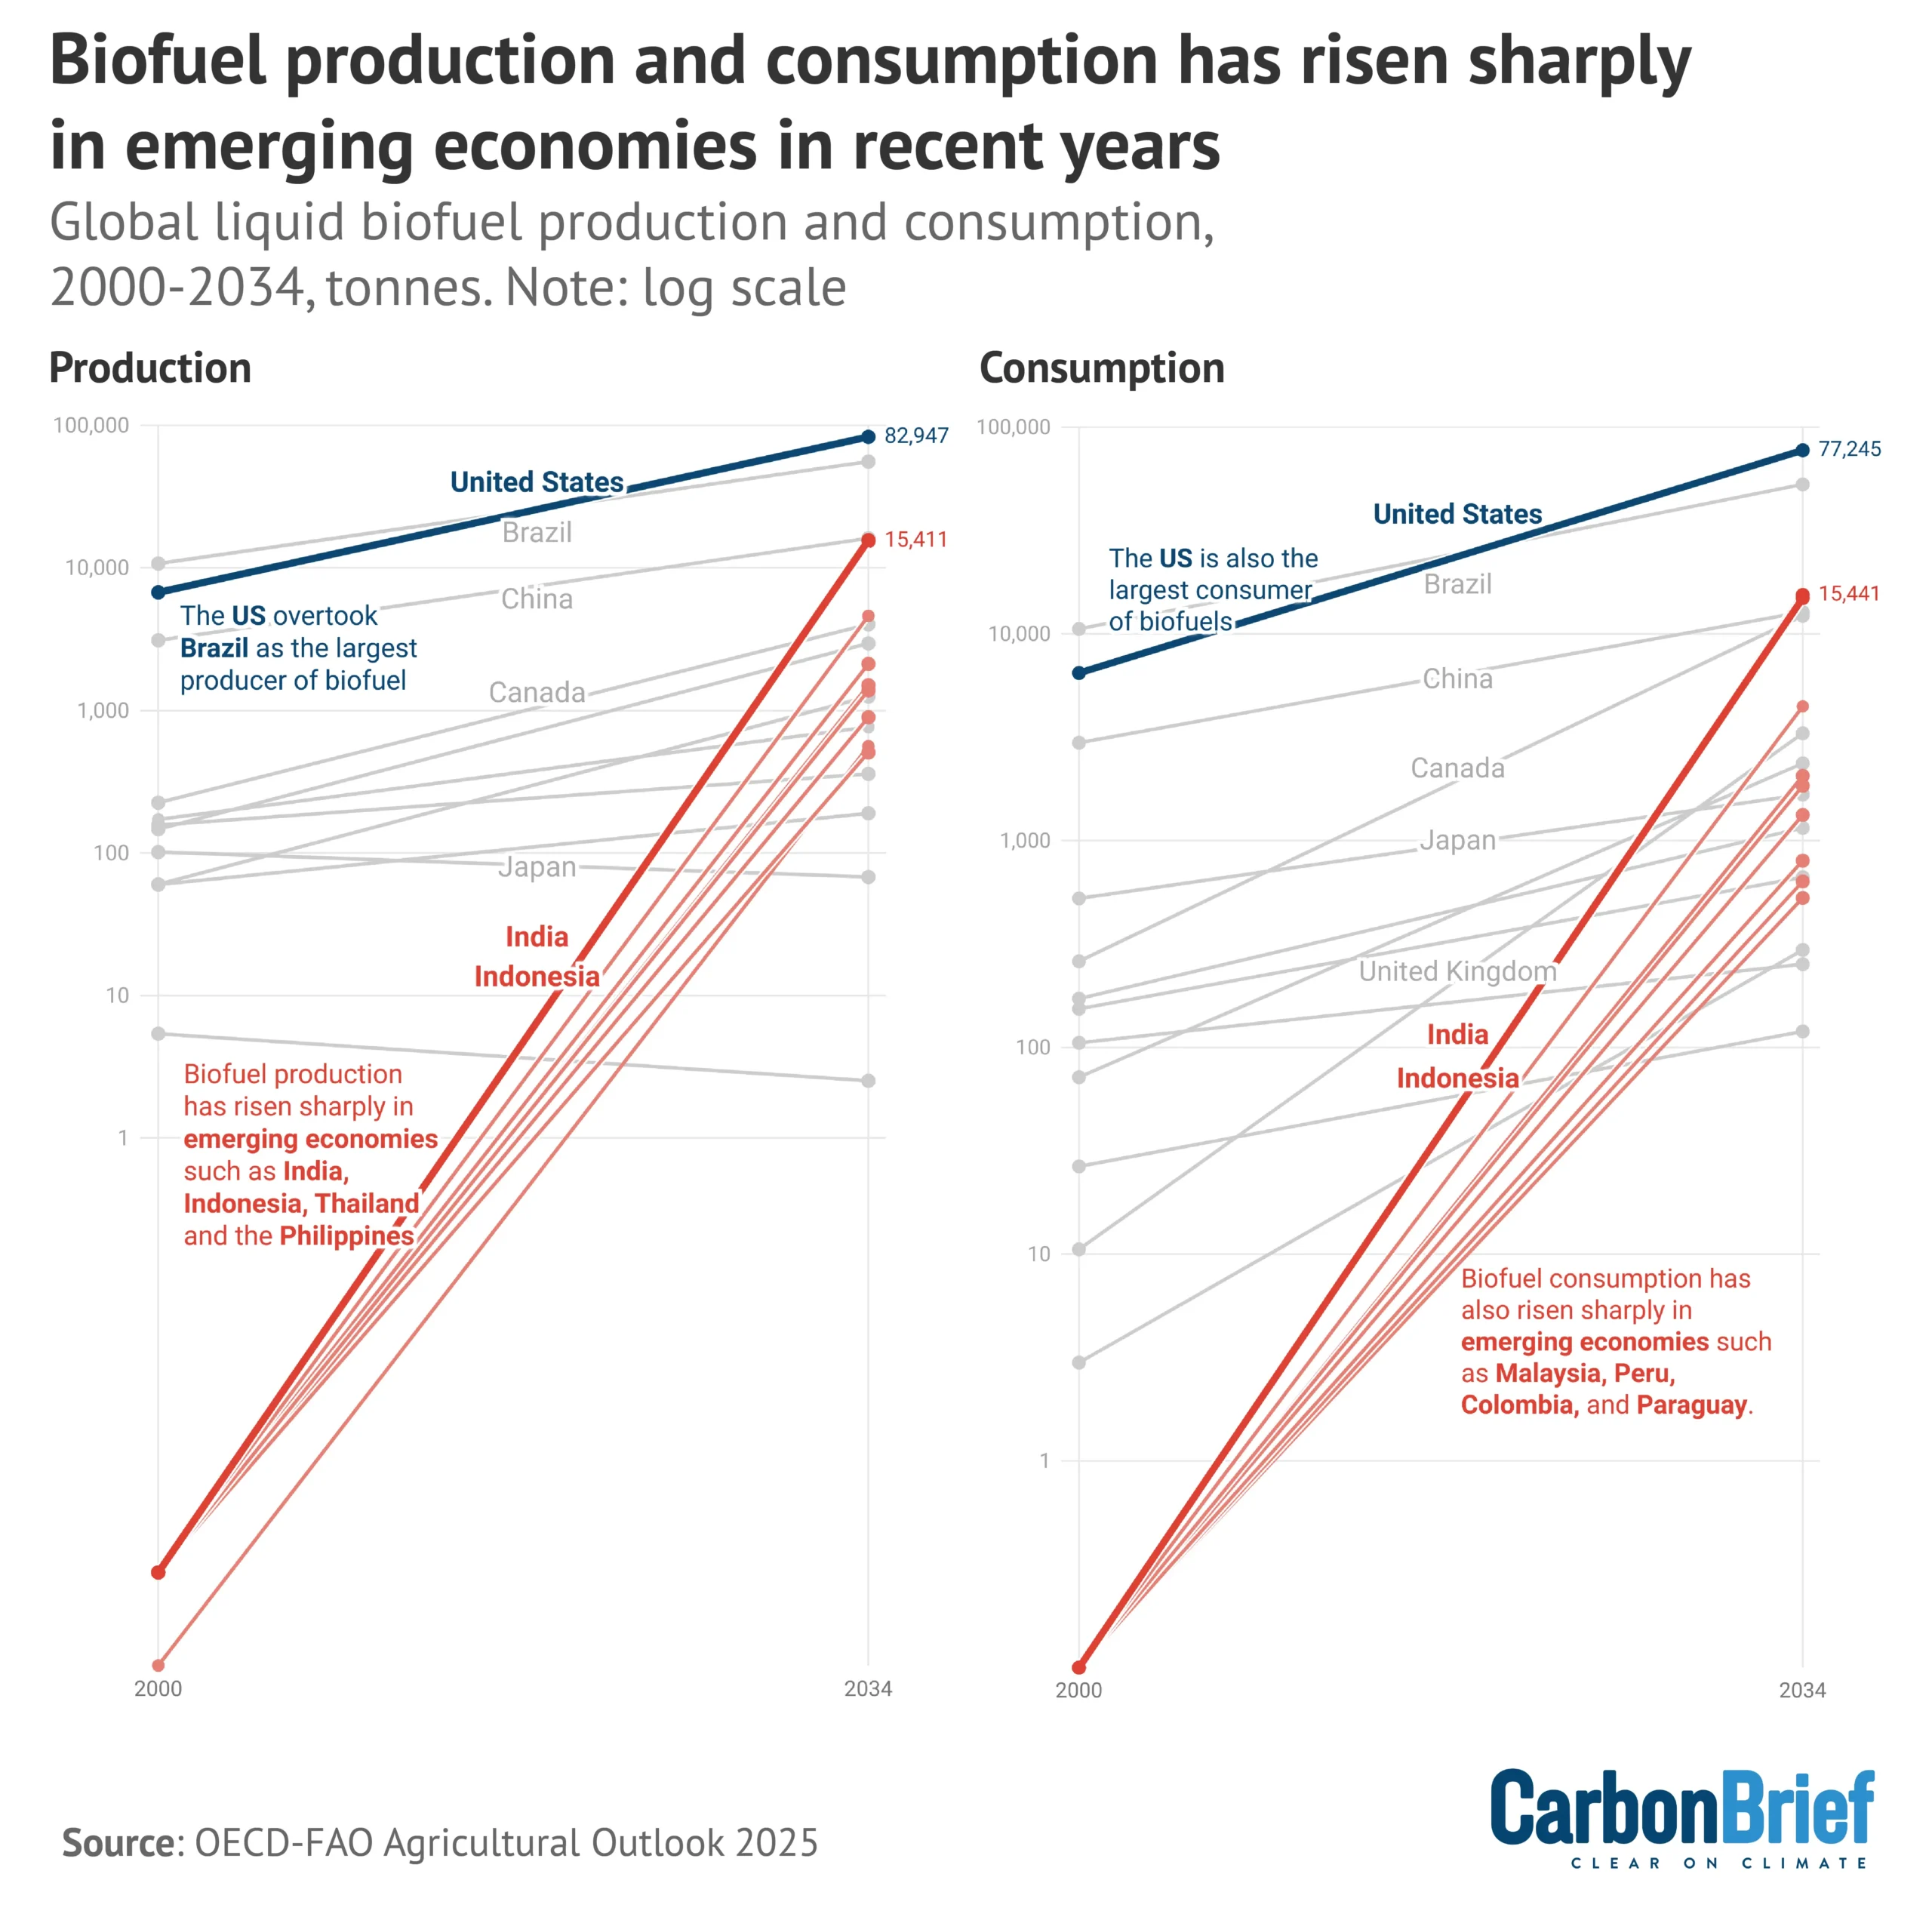
In 2024, global liquid biofuel production increased by 8% year-on-year, with the US (37%) and Brazil (22%) accounting for the largest overall share of production, according to the 2025 Statistical Review of World Energy from the Energy Institute.

Other countries that saw a notable increase in production between 2023-24 were Sweden (62%), Canada (39%), China (30%), India (26%) and Argentina (24%).

Bioethanol is the most commonly used biofuel in the world, with a consumption rate of 1.1m barrels of oil equivalent per day in 2024, according to the report. This is closely followed by biodiesel, at 1m barrels of oil equivalent per day.

In 2024, the US, Brazil and the EU accounted for nearly three-quarters of all biofuels consumed globally. However, while India’s biofuel demand grew by 38%, demand for biofuels in the EU fell by 11% in 2024, according to the review, echoing outlooks that show that middle-income countries are driving biofuel growth.

The chart below shows how biofuel production and consumption have changed since 2000, and how they are projected to change through 2034.

Liquid biofuel production and consumption in tonnes for top 10 producing and consuming countries, along with selected emerging economies, 2000-2034. Data: OECD-FAO Agricultural Outlook 2025-34 (2025).

What are the main arguments for biofuels? 

From lowered oil imports and emissions through to boosting farm livelihoods, countries that have boosted biofuels programmes cite several benefits in biofuels’ favour.

‘Renewable’ energy and lowered emissions

Biofuels are often described as “renewable” fuels, since crops can be grown over and over again.

In order to achieve this, crops for biofuels must be continuously replanted and harvested to meet energy demand. Growing crops – particularly in the monoculture plantations typically used for growing feedstocks – can require high use of fossil fuels, in the form of machinery and fertiliser. Furthermore, in the case of wood as a feedstock, regrowth can take decades.

While some biofuels offer significant emissions reductions, others, such as palm biodiesel, generate similar or sometimes higher emissions as fossil fuels when burned. However, ancillary emissions for biofuels are much smaller than for oil and gas operations.

One of the main cited benefits of biofuels is that plants capture CO2 from the atmosphere as they grow, potentially serving to mitigate emissions. However, several lifecycle-assessment studies have questioned just how much plants can offset emissions. These studies come up with varying estimates based on feedstock types, geography, production routes and methodology.

This divergence is echoed in the UN Intergovernmental Panel on Climate Change’s (IPCC) Sixth Assessment Report (AR6), which points to “contrasting conclusions” even when similar bioenergy systems and conditions are analysed.

Per the report, there is “medium agreement” on the emissions-reduction potential of second-generation biofuels derived from wastes and residues by 2050. 

At the same time, the IPCC adds that “technical land availability does not imply that dedicated biomass production for bioenergy…is the most effective use of this land for mitigation”.

It also warns that larger-scale biofuel use “generally translates into higher risk for negative outcomes for greenhouse gas emissions, biodiversity, food security and a range of other sustainability criteria”. 

Along with the IPCC, many other groups and experts – including the UK’s Climate Change Commission – have called for a “biomass hierarchy”, pointing to a limited amount of sustainable bioenergy resources available and how best to prioritise their use.

Use in hard-to-abate sectors

In many countries, such as the US and UK, biofuels are part of a standard grade of diesel and petrol (gasoline) available at most fuel pumps.

Biofuels have also been the leading measure for decarbonising road transport in emerging economies, where electric vehicle systems were not as developed as in many western nations.

According to the International Energy Agency (IEA), most new biofuel demand is coming from these countries, including Brazil, India and Indonesia.

Biofuels are also one of the key options being explored to decarbonise the emissions-heavy, but “hard-to-abate”, sectors of aviation and shipping.

The AR6 report notes that the “faster-than-anticipated adoption of electromobility” has “partially shifted the debate” from using biofuels primarily in land transport towards using them in shipping and aviation.

At the same time, experts question how this can be done sustainably, given the limited availability of advanced biofuels and the rising demand for them.

Government reports – such as those released by the EU Commission – recognise that, in some circumstances, so-called sustainable aviation fuels (SAFs) could produce just as many emissions as fossil fuels when burned in order to power planes.

However, SAFs do generally – although not always – have a lower overall “lifecycle” carbon footprint than petroleum-based jet fuel. This is due to the CO2 absorbed when growing plants for biofuels, or emissions that are avoided by diverting waste products to be used as fuels. 

Unlike the road sector, where “electrification is mature…aviation and shipping cannot be electrified so easily”, says Cian Delaney, fuels policy officer at the Brussels-based advocacy group Transport & Environment (T&E). 

According to a 2025 T&E briefing, the 2030 demand for biofuels from global shipping alone could require an area the “size of Germany”. Delaney tells Carbon Brief:

“In aviation in particular, where you still need some space to transition, you still need a certain amount of biofuels. But these biofuels should be advanced and waste biofuels derived from true waste and residues, and they are available in truly limited amounts, which is why, in parallel, we need to upscale the production of e-fuels [synthetic fuels derived from green hydrogen] for aviation.”

In February this year, more than 65 environmental organisations from countries including the US, Indonesia and the Netherlands wrote to the International Maritime Organization, urging its 176 member states to “exclude biofuels from the industry’s energy mix”.

The organisations cited the “devastating impacts on climate, communities, forests and other ecosystems” from biofuels, cautioning that fuels such as virgin palm oil are often “fraud[ulently]” mislabelled as used cooking oil – a key feedstock for SAF.

Meanwhile, the AR6 report has “medium confidence” that heavy-duty trucks can be decarbonised through a combination of batteries and hydrogen or biofuels. And despite growing interest in the use of biofuels for aviation, it says, “demand and production volumes remain negligible compared to conventional fossil aviation fuels”.

Energy security and reducing import dependence

In many countries, such as India and Indonesia, biofuels are seen as a part of a suite of measures to increase energy security and lessen dependence on fossil-fuel imports from other countries. This imperative received increasing emphasis after the Covid-19 pandemic and Russia’s war on Ukraine.

In developing countries, the “main motivation” behind biofuel policy is to find an alternative to excessive dependence on imported fossil fuels that are a “major drain” on foreign exchanges and subject to volatility and price shocks, says Prof Nandula Raghuram, professor of biotechnology at the Guru Gobind Singh University in New Delhi.

Raghuram, who formerly chaired the International Nitrogen Initiative, tells Carbon Brief that, in order for developing countries to “earn those precious dollars to finance our petroleum imports”, they have to export “valuable primary commodities”, such as grain and vegetables, at the cost of nutritional self-reliance. He adds:

“And so we have to see the biofuel approach as not so much a proactive strategy, but as a sort of reactive strategy to use whatever domestic capacity we have to produce whatever domestic fuel, including biofuels, to reduce that much burden on the exchequer for imports.”

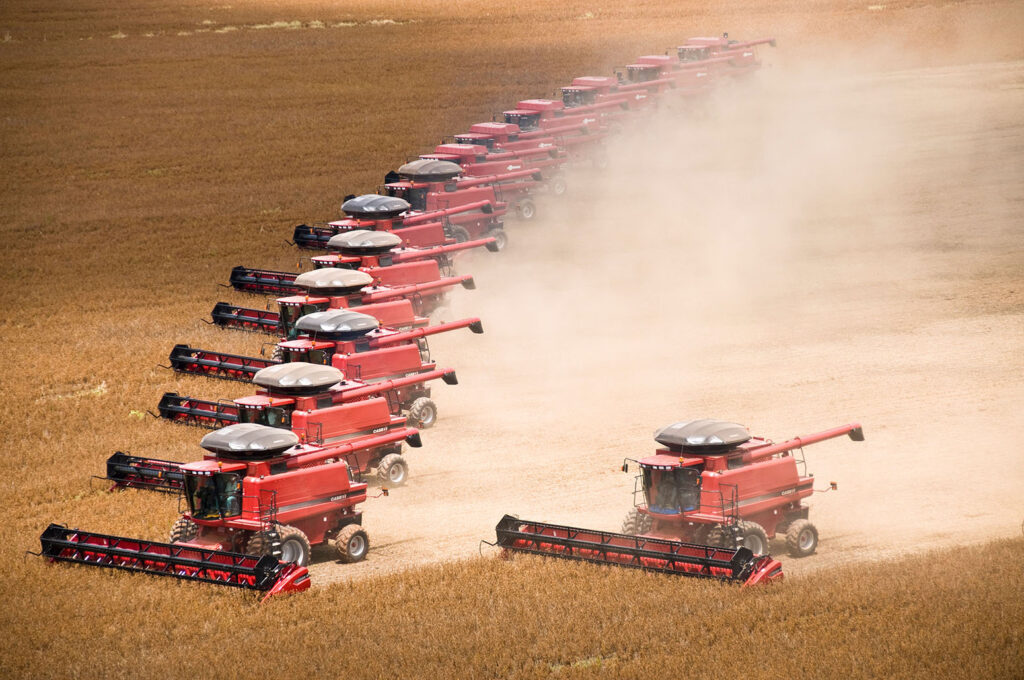
Boost to agriculture 

Many governments also see biofuels as an alternative income stream for farmers and a means to revitalise rural economies.

An increasing demand for biofuels could, for example, offer farmers higher returns on their crops, attract industry and services to agrarian areas and help diversify farm incomes.

In 2023, a report by the International Labour Organization (ILO) and the International Renewable Energy Agency (IRENA) estimated that the liquid biofuel industry employed approximately 2.8 million people worldwide.

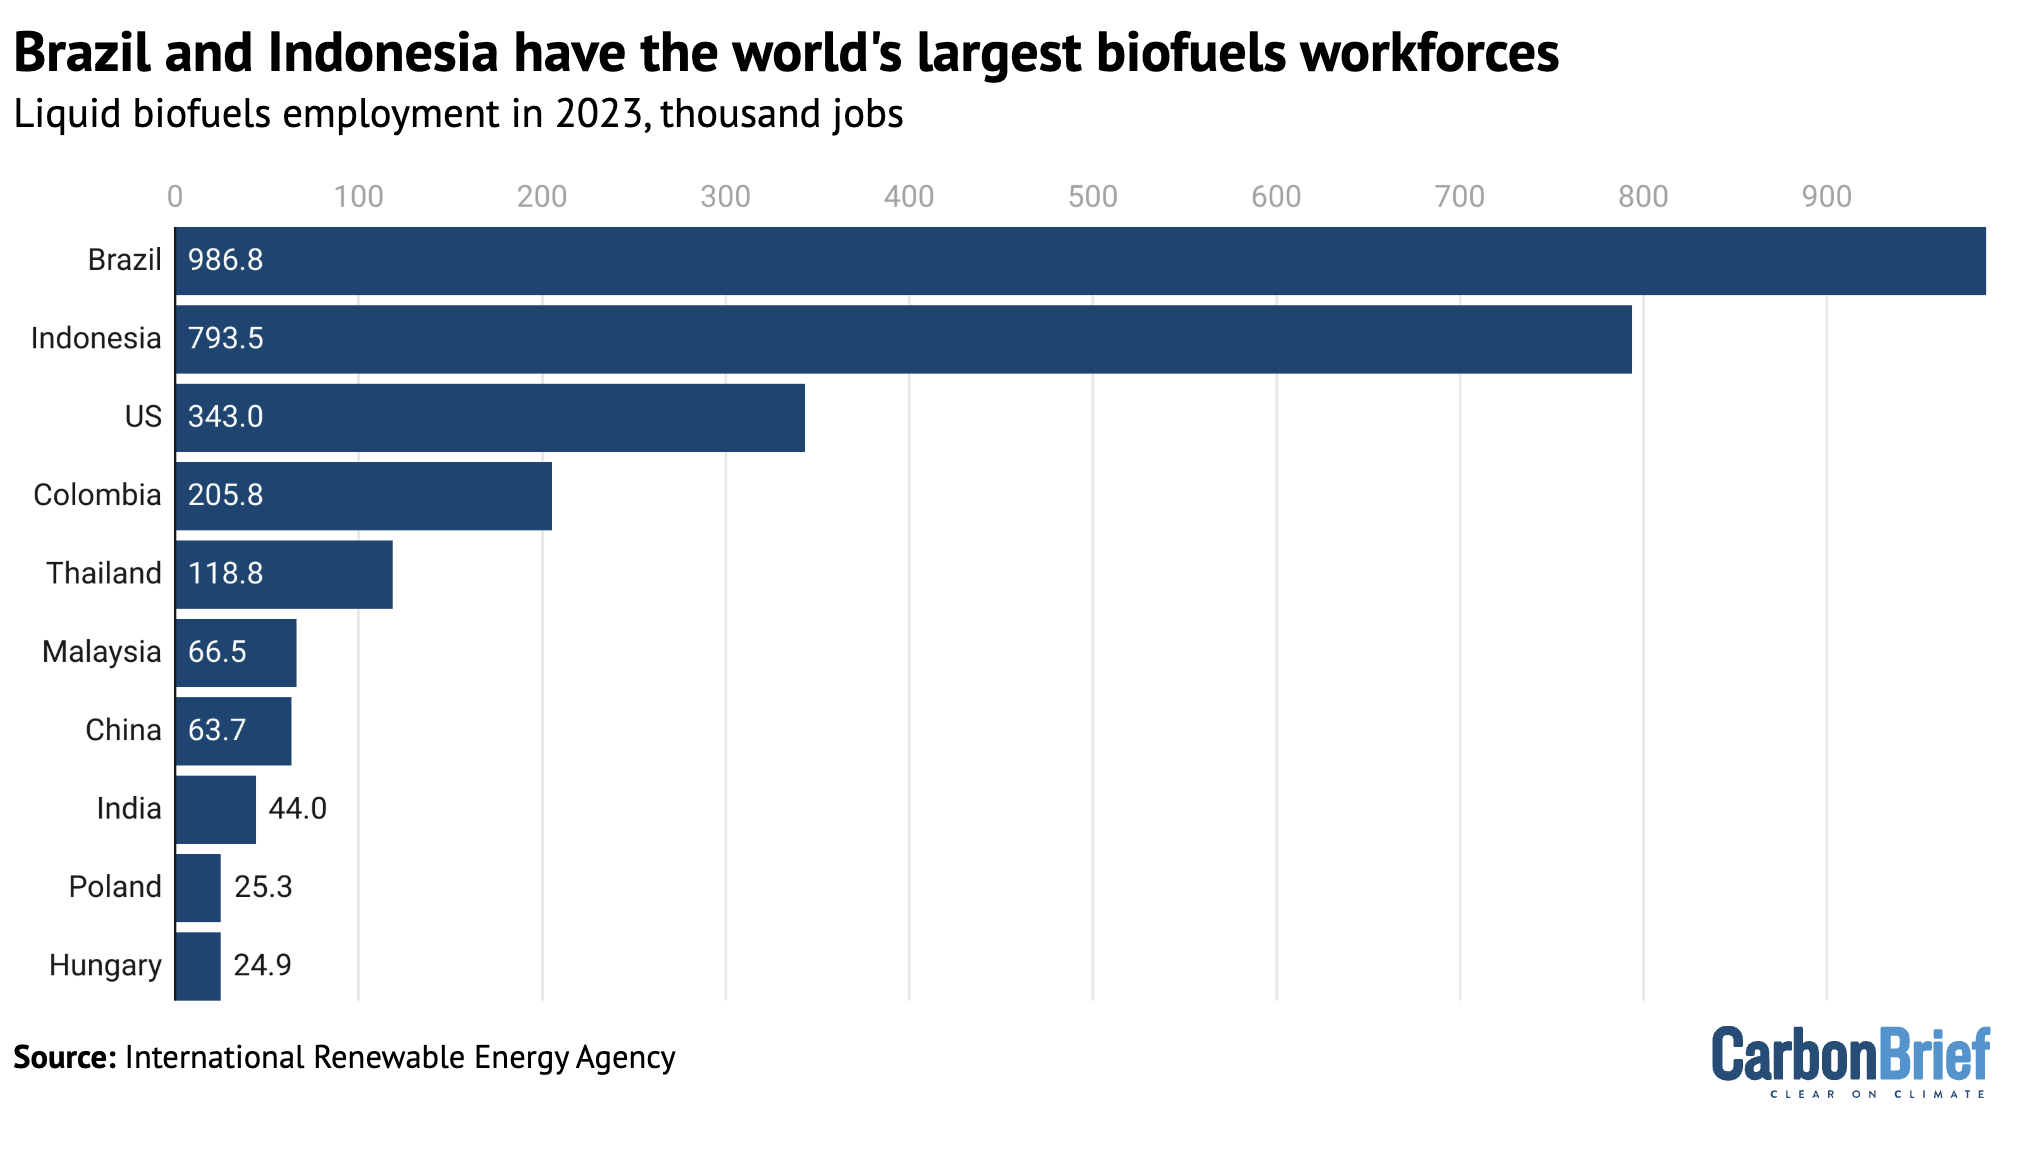
The bulk of these jobs were in Latin America and Asia, where farming is more labour-intensive and relies on informal and seasonal employment. Brazil’s biofuel sector alone employed nearly one million people in 2023, according to the report.
Meanwhile, North America and Europe accounted for only 12% and 6% of biofuel jobs in 2023, respectively, according to the report.

The chart below shows the number of jobs in the biofuel sector in the top 10 biofuel-producing countries.

Jobs relating to liquid biofuels in the top 10 producer countries in 2023. Source: International Renewable Energy Agency (Irena) and International Labor Organization (Irena-ILO) (2024). Chart: Carbon Brief.

Delaney points out that biofuel-related jobs account for less than 1% of all jobs in the EU, adding that the “most-consumed biofuel feedstocks” in the bloc are vegetable oils that are imported from countries such as Brazil and Indonesia. (See: How are countries using biofuels to meet their climate targets?)

He tells Carbon Brief:

“Despite strong biofuels mandates in the EU, the sector didn’t create as many jobs in the end for EU farmers, but, instead, benefited the big fuel suppliers and industry players.”

What are some of the main criticisms of biofuels?

Despite their widespread use and increasing adoption, experts recognise that biofuels “may also carry significant risks” and cause impacts that can undermine their sustainability, if not managed carefully. 

Production emissions, land-use change and deforestation

The different chemical processes involved in making biofuels require varying amounts of energy and, therefore, the associated emissions depend on how “clean” a producer country’s energy mix is.

At the same time, growing biofuel crops often relies on emissions-intensive fertilisers and pesticides to keep yields high and consistent. (See Carbon Brief’s detailed explainer on what the world’s reliance on fertilisers means for climate change.)

Biofuel production processes, such as fermentation, also release CO2 and other greenhouse gases, including methane and nitrous oxide.

MIT’s Gurgel tells Carbon Brief that it is “relatively straightforward” to measure these direct emissions from biofuel production.

However, given how different countries account for deforestation, tracking direct land-use change emissions related to biofuel production is slightly more challenging – although still possible, Gurgel says. These emissions can come from clearing forests or converting other land specifically for growing energy crops.

For example, in many tropical forest countries, native rainforests and peatland have been cleared to grow oil palm for biodiesel or sugarcane for bioethanol.

Deforestation in the Brazilian Amazon for cultivating soyabeans and corn used to produce biofuel. Credit: Ton Koene / Alamy Stock Photo (2009)

According to one 2011 study by the Centre for International Forestry Research and World Agroforestry (CIFOR-ICRAF), it could take more than 200 years to reverse the carbon emissions caused by clearing peatland to grow palm oil.

Gurgel tells Carbon Brief:

“What is really very hard – I would say impossible – to measure are the indirect impacts of biofuels on land.”

Indirect land-use change occurs when a piece of land used to grow food crops is used instead for biofuels. This can, in turn, require deforestation somewhere else to produce the same amount of crops for food as the original piece of land.

Indirect land-use change can mean a loss of natural ecosystems, with “significant implications for greenhouse gas emissions and land degradation”, according to a 2024 review paper.

Gurgel explains:

“If you provoke a chain of reactions in the market, that can lead to expansion of cropland in another region of the world and then this can push the agricultural frontier further and cause some deforestation…It’s quite hard to know exactly what’s going to happen and those things are interactions in the market that are impossible to measure.”

The “best that scientists can do” to determine if such a “biofuel shock” could indeed cause land-use change in a forest or grassland elsewhere “is try to project those emissions using models, or do very careful statistical work that will never be complete”, he adds.

Delaney, from Transport and Environment, contends that there is enough scientific research to “show that indirect land-use change is real” and to quantify the expansion of “certain food and feedstocks into high-carbon stock” areas, such as forests.

While this is “not easy” to do, he points to the European Commission’s indirect land-use change directive, the accompanying methodology and its scientific teams who study agricultural expansion rates. Delaney continues:

“What we all agree with at this point is that indirect land-use change exists, that it’s a problem, that certain feedstocks like palm and soya are particularly problematic from this perspective and that it is an issue that we need to tackle and capture in the best possible way.

“You cannot just be vague and descriptive without having proper figures behind it – and I think that’s something that at least the EU have tried and that they continue trying to implement. And I hope that, at the global level as well, this will be more recognised.”

Impacts on food, biodiversity and water security

Biofuel-boosting policies have been subjected to intense scrutiny during periods of global food-price spikes in 2008, 2011 and 2013.

Following the spikes, critics attributed increasing biofuel production as a major factor in the near-doubling of cereal prices. Studies have shown that they played a more “modest” role in some of these spikes and a more substantial one in others.
Severalexperts have linked food-price spikes to protests in north Africa and the Middle-East, including the Arab Spring.

Protests in Egypt’s Tahrir Square in 2011, which many experts have linked to global food price spikes that were partially influenced by food crops being diverted to biofuel production. Credit: Barry Iverson / Alamy Stock Photo.

In more recent years, the “food vs fuel debate” has come back to the fore since the start of the war in Ukraine in 2022.

This was in part due to the world’s reliance on Ukraine and Russia’s food and energy systems – particularly some of the most food-insecure countries, who had to contend with record-high food prices that peaked in March 2022, but still persist. The war also saw heightened calls for the US and EU to overturn biofuel-boosting policies to free up land to increase domestic food production and bring down food prices.

In developing countries, such as India, the use of cereals and oils to make biofuels while large sections of the population still lack access to adequate nutrition has attracted criticism from experts.

While first-generation biofuels rely on fertilisers to guarantee consistently high yields, second-generation biofuels could directly compete with feed for livestock or their return to soil as nutrients.

According to a 2013 report by the panel of scientists that advises the UN Committee on World Food Security (CFS):

“All crops compete for the same land or water, labour, capital, inputs and investment, and there are no current magic non-food crops that can ensure more harmonious biofuel production on marginal lands.”

This competition, along with clearing forests and other ecosystems for cropland, has consequences not just for emissions, but also for biodiversity, water and nutrients.

According to one 2021 review paper, local species richness and abundance were 37% and 49% lower, respectively, in places where first-generation biofuel crops were being grown than in places with primary vegetation. Additionally, it found that soya, wheat, maize and palm oil had the “worst effects” on local biodiversity, with Asia and central and South America being the most-impacted regions.

Soya beans being harvested near Mato Grosso in Brazil. Credit: Paulo Fridman / Alamy Stock Photo.

Biofuels’ impact on water resources, similarly, is highly crop- and location-specific.

For instance, growing a “thirsty” crop such as sugarcane in Brazil could have minimal impacts on local water resources, due to the region’s abundant rainfall. But in drought-prone India, experts have estimated that a litre of sugarcane ethanol requires more than 2,500 litres of water to produce and relies entirely on irrigation. Research has also found that nearly half of China’s maize crop requires irrigation to grow.

According to agricultural economist Dr Shweta Saini, meeting India’s 2025-26 biofuels target will require 275m tonnes of sugarcane, 6m tonnes of maize and 5.5m tonnes of rice. According to one 2020 study cited by Bloomberg columnist David Fickling, increasing sugarcane production to meet India’s biofuel targets “could consume an additional 348bn cubic metres of water…around twice what is used by every city” in the country.

Prof Raghuram tells Carbon Brief:

“Water resources are drying up everywhere in the country and by incentivising, through policy, a water-guzzling industry like this, we are inviting a sustainability crisis.”

‘Feedstock crunch’

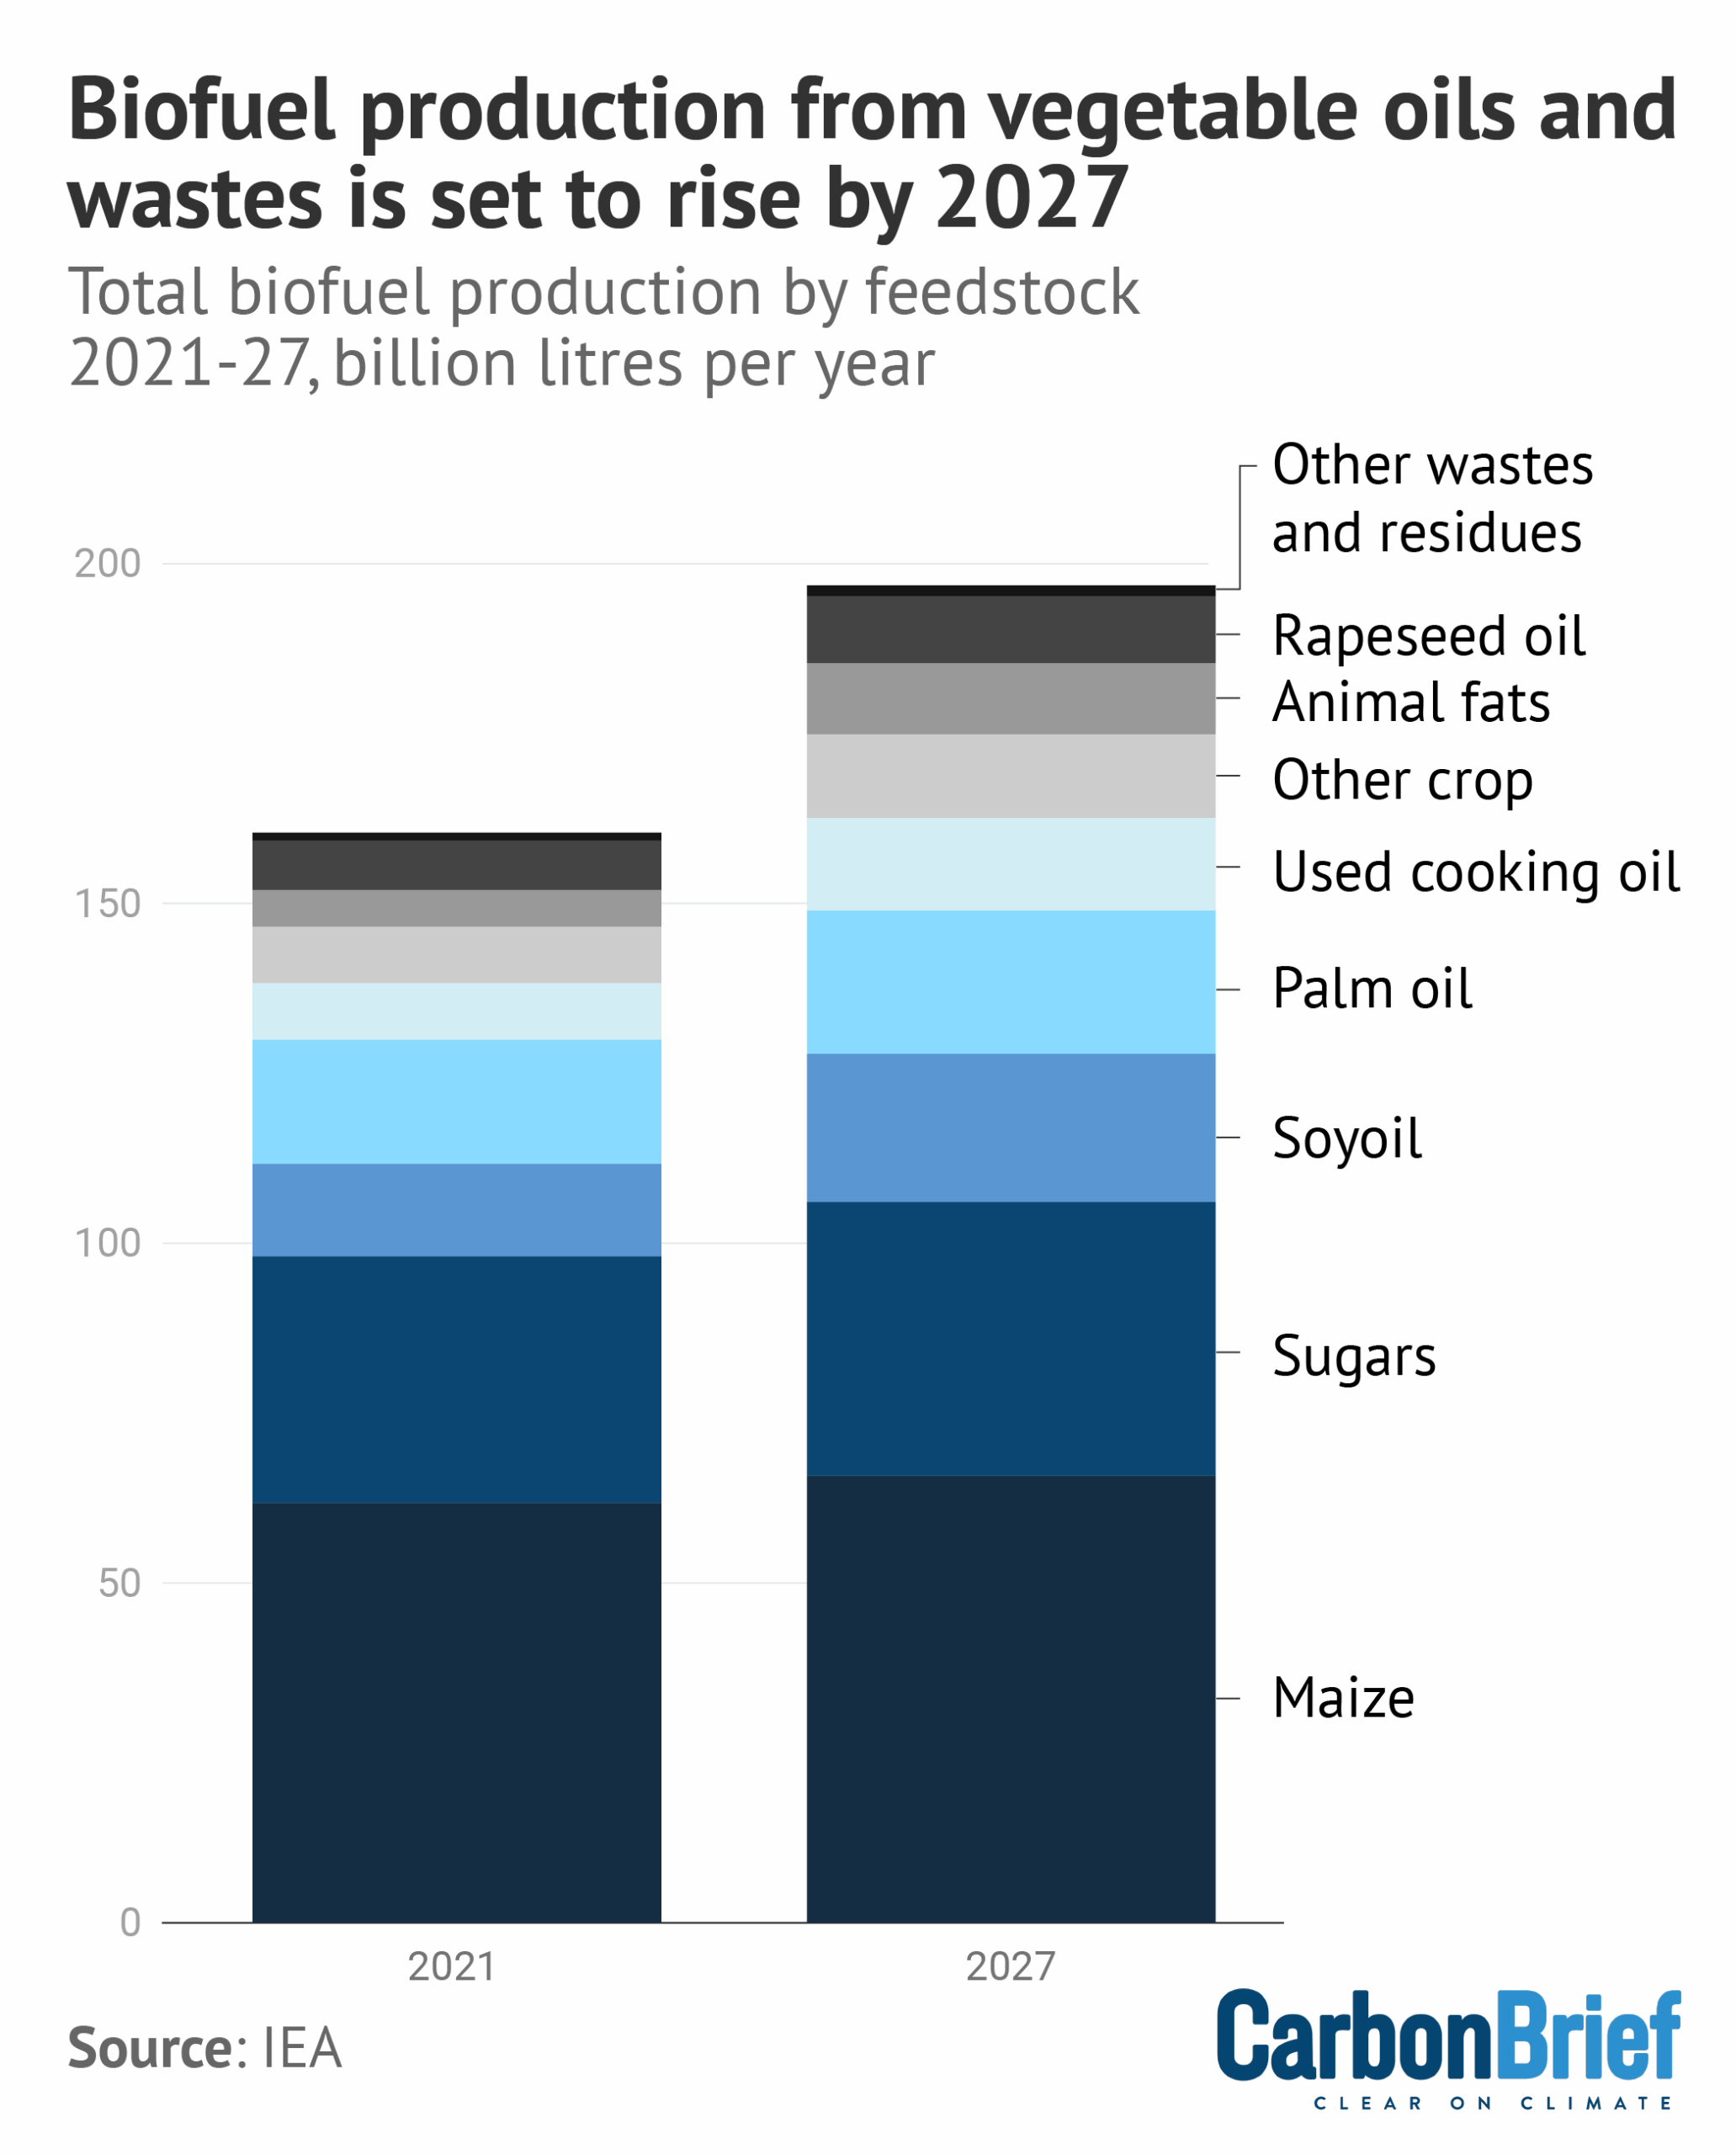
Another concern surrounding biofuels is that there may not be enough supply to go around to meet rising demand. The IEA described the potential shortfall as a “feedstock supply crunch” in a 2022 report.

Fuels derived from the most commonly used waste and residues, in particular, could be approaching supply limits, the IEA warns, as these fuels satisfy both sustainability and feedstock policy objectives in the US and EU.

Consumption of vegetable oil for biofuel production is expected to soar by 46% over 2022-27, the report says. Meanwhile, the world is estimated to “nearly exhaust 100% of supplies” of used cooking oil and animal fats within the decade.

For the world to stay on a net-zero trajectory, “a more than three times production increase” would be required, the report adds. It warns that if the limited availability of second-generation feedstocks continues unchanged, “the potential for biofuels to contribute to global decarbonisation efforts could be undermined”.

The chart below shows the biofuel demand share of global crop production from 2022-27.

Total biofuel production by feedstock dedicated to producing biofuels, IEA estimates for 2021 and 2027. Data: IEA (2022). Chart: Carbon Brief

How are countries using biofuels to meet their climate targets?

Broadly, biofuel policies are divided into two categories.

Technology “push” policies focus on the research and development of new technologies and include measures such as research funding, pilot plants and government support for commercialising nascent technologies.

Meanwhile, market “pull” policies drive demand for existing and emerging biofuels through measures such as “biofuel blending mandates” – where countries prescribe a certain percentage of biofuel with fossil fuels – and tax breaks for producers and vehicle owners.

US

The US Renewable Fuel Standard (RFS) is the world’s largest existing biofuel programme. Its mandates are keenly watched and contested by the country’s farm and petroleum lobbies.

Under RFS, the US Environmental Protection Agency sets out minimum levels of biofuels that must be blended into the US’s transport, heating and jet fuel supplies.

A truck transporting corn at an ethanol plant in Iowa, USA. Credit: Wang Ying / Alamy Stock Photo (2019)

Under the policy, oil refiners can either blend mandated volumes of biofuels into the nation’s fuel supply or buy credits – called Renewable Identification Numbers (RINS) – from those that do.

While the programme sets out emissions reduction targets, the environmental impacts of cropland expansion and monoculture driven by the policy have been cause for concern by experts.

According to one 2022 study, the RFS programme increased US fertiliser use by 3-8% each year between 2008-16 and caused enough domestic emissions from land-use change that the carbon intensity of corn ethanol was “no less than that of gasoline and likely at least 24% higher”. Additionally, the programme’s impacts on biodiversity have not yet been fully assessed.

In June 2025, the Trump administration announced plans to expand the biofuel mandate to a “record 24.02bn gallons” next year – an 8% increase from its 2025 target – while seeking to discourage imported biofuels.

EU

In the EU, policymakers have promoted biofuels since 2003 to reduce emissions in the transport system. As part of the EU’s Renewable Energy Directive (RED), biofuels have been explicitly linked to emissions targets.

Under the current iteration of RED (REDIII) – revised as part of the EU’s Fit for 55 package – EU countries are required to either achieve a share of 29% of renewable energy in transport or to reduce the emissions intensity of transport fuels by 14.5%. Additionally, it sets out a sub-target for “advanced biofuels” of 5.5% and excludes the use of food and feed-based biofuels in aviation and shipping.

In 2015, the European Commission acknowledged that the indirect land-use change emissions of first-generation biofuels could “fully negate” any emission savings by biofuels. The commission capped the use of first-generation biofuels in each member country at 7% of all energy used in transport by 2020, but did not announce plans to phase them out.

As of 2021, nearly 60% of all biofuels used in the EU were still made from food and feed crops, according to analysis by Oxfam. While the latest RED legislation continues to push for the use of advanced and waste biofuels, campaigners warn that a lack of clear definitions could increase the risk of “loopholes” and fraud, exacerbated by increased demand.

T&E’s Delaney tells Carbon Brief:

“You’re putting a lot of pressure on the land – you might require a lot of pesticides and irrigation – and there is not even enough land in Europe for this. How can you make sure true sustainability safeguards are in place so that you’re not actually driving additional demand for land in [biodiverse countries such as] Brazil?”

Brazil

Brazil has the world’s oldest biofuels mandate, dating back to the 1970s, established in a bid to insulate the country from expensive oil imports.

In 2017, Brazil announced a state policy called RenovaBio that set out national carbon intensity reduction targets for transport, decided biofuel mandates and created an open market for biofuel decarbonisation carbon reduction credits called CBIO.

In October 2024, Brazil enacted a “Fuels of the Future” law that replaced RenovaBio, with president Lula declaring that “Brazil will lead the world’s largest energy revolution”. The law aims to boost biofuel and sustainable aviation fuel (SAF) use, increasing biodiesel blending mandates by 1% every year starting in 2025 until it reaches 20% by March 2030.

Biofuels now account for 22% of the energy that fuels transport in Brazil and its ethanol market is “second in size only” to the US.

In June this year, Brazil announced that the country was increasing its biofuel blending mandates from 1 August in a bid to make the country “gasoline self-sufficient for the first time in 15 years”, reported Reuters.

Indonesia

As the world’s biggest palm oil producer, Indonesia has continued to raise its biodiesel blending mandates to meet its domestic energy needs.

The country first introduced mandatory biodiesel blending in 2008, at 2.5%. The mandate is currently at 40% in 2025 and, starting next year, could go up to 50% with an eventual goal of 100%.

While Indonesia’s president Prabowo Subianto has stated that implementing 50% blending could save the country $20bn in reduced diesel imports, the move would need an estimated 2.3m hectares of land, including protected forests, resulting in the “country’s largest-ever deforestation project”, according to Mongabay.

It could also compete with palm oil meant for domestic and international food markets, impacting already soaring prices and signalling the “end of cheap palm oil”.

India

India has quickly joined the ranks of major biofuel producers, due to high-level political support, policies and a diversity of feedstocks. In 2023, India launched the Global Biofuels Alliance as one of its key priorities of its G20 presidency.

India’s prime minister Narendra Modi holds hands with USA’s Joe Biden and Brazil’s Lula da Silva at the launch of the Global Biofuels Alliance in 2023. Credit: Planetpix / Alamy Stock Photo (2023)

Biofuel mandates are outlined in the country’s National Policy on Biofuels, first published in 2009 and subsequently amended in 2018 and 2022. In 2022, India achieved its 10% ethanol blending target ahead of schedule and is pursuing a 20% blending target by 2025, as well as a 5% biodiesel blending target by 2030.

India’s rapid biofuel push, however, has been criticised by food security experts as hunger levels rise, for its impact on endemic rainforests and, most recently, by vehicle owners for the impact of blended fuel on car engines.

Prof Raghuram says:

“From a sheer governance angle and sustainability angle, there are a lot of compromises being made to somehow push this whole thing. Even the land available in India is shrinking, as various reforms and dilution of environmental safeguards in the last 10 years have made it relatively easier to convert farm and forest land for non-agricultural purposes.”

China

China developed its first biofuel policies over 20 years ago and is one of the world’s biggest biofuel producers.

In 2017, China announced a new mandate expanding the use of fuel including bioethanol from 11 trial provinces to the entire country by 2020. However, Reuters and South China Morning Post reported that this was suspended in 2020. Only 15 provinces still maintain biofuel mandates, according to the US Department of Agriculture, which notes that a “lack of meaningful support for domestic biofuel consumption while aggressively promoting electric vehicles indicates a strategic choice to pursue transportation decarbonisation through electrification rather than liquid biofuels”.

At the same time, biofuel production in China grew by 30% in 2024, according to the Energy Institute’s Statistical Review.

While most of China’s biofuel production is grain-based, tax incentives for ethanol production have been gradually phased out and alternative biofuels have been incentivised, according to the IEA. China is currently piloting a scheme to increase biodiesel consumption at home, even as it exports biodiesel and used cooking oil to the EU and US.

How could climate change impact biofuel production?

Despite the well-documented impacts of climate change-induced extreme weather on land, agriculture and forests, there is currently little scientific literature examining how continued warming will impact global biofuel production.

One 2020 study found that bioethanol availability globally could drop – by 23% under a “very high emissions scenario” and by 4.3% under a “low emissions” scenario by 2060 – “if climate change risk is not adequately mitigated” and corn continues to be the dominant feedstock.

The study “encourages” changing out corn for switchgrass as a key source of bioethanol.

A farmer in southern China checks the growth of crop in his flooded corn field. Credit: ImagineChina / Alamy Stock Photo (2014)

Another 2021 study examining the viability of China’s planned biofuel targets estimated that energy crop yields in China in the 2050s will decrease significantly compared to the 2010s, due to the impacts of climate change.

It found that climate change is expected to have a “substantial impact” on the land available for biofuel production in the 2050s, under both scenarios used in the study.

Gurgel, from MIT, tells Carbon Brief that it is “very hard to take into account how much climate change will damage bio-energy production” at this point, given the uncertainty of what emissions pathway the world will follow. 

While most climate models “do a very good job” at forecasting average temperature change in the future, they do an “average job” at projecting rainfall change, or how many extreme weather events countries will see in the future, he says.

This is important because many biofuel crops, such as sugarcane and palm oil, are water-intensive and thrive in regions with abundant rainfall, but yields may fail in drier parts of the world that could see more drought.

Given this “cascade of uncertainties”, he continues, “we don’t have a clear picture of how bad the future [of agriculture] will be – we just know it will be more challenging than today”.

Delaney, meanwhile, asks whether investing in biofuels, which will be impacted by climate change, is a “good investment” for the long term. He tells Carbon Brief:

“I think these are the questions that we need to ask ourselves when we see – not just in India, but Indonesia, Brazil, everywhere around the world right now – this growing appetite for biofuels. Can we really keep the promises that we made at the end of the day?”

The post Q&A: How countries are using biofuels to meet their climate targets appeared first on Carbon Brief.

Q&A: How countries are using biofuels to meet their climate targets

Continue Reading

Climate Change

‘America needs you’: US seeks trade alliance to break China’s critical mineral dominance  

Published

on

The US is urging countries to form a critical mineral trading bloc to shore up access to resources that are pivotal to manufacturing energy, digital and advanced technologies and technologies, and to reduce the world’s dependence on China for mineral supplies.

Washington says this mineral club would provide countries with a tariff-free trade zone to buy and sell critical minerals with guaranteed minimum prices, helping them compete with Chinese producers and create more resilient supply chains.

China dominates global mineral refining capacity for 19 of 20 key minerals needed to manufacture clean energy technologies and advanced digital infrastructure.

“The Trump administration is proposing a concrete mechanism to return the global critical minerals market to a healthier, more competitive state,” US Vice President JD Vance told government representatives from 54 countries and the European Union attending the first US-hosted critical minerals ministerial meeting on Wednesday.

Large economies like India, Japan, France, Germany and the UK as well as resource-rich emerging and developing economies such as Argentina, the Democratic Republic of the Congo and Zambia were represented at the event in Washington DC.

“We want to eliminate th[e] problem of people flooding into our markets with cheap critical minerals to undercut our domestic manufacturers,” Vance said, without naming China.

“We want members to form a trading bloc among allies and partners, one that guarantees American access to American industrial might, while also expanding production across the entire zone. The benefits will be immediate and durable,” he added.

“In the end, it’s all in the US interest of course,” Bryan Bille, a principal at Benchmark Mineral Intelligence, told Climate Home News. “At the same time, the Trump Administration realises that international cooperation is needed to address these challenges.”

“America needs you”

“It feels like ‘thank you for coming, America needs your help’,” Patrick Schröder, a senior research fellow at Chatham House, said of the meeting.

“The US now have realised they cannot solve their critical minerals problem just on their own. To really reduce dependence on China, they need this bigger group of countries,” he said.

There is potential for a mineral trading club to become useful to diversify supply chains and support mineral production in developing countries “but it can’t be all about supplying the US with minerals,” Schröder told Climate Home News.

    On Wednesday, the US signed 11 bilateral critical minerals agreements with Argentina, the Cook Islands, Ecuador, Guinea, Morocco, Paraguay, Peru, the Philippines, the UAE and Uzbekistan. This comes on top of 10 other deals signed in the past five months, including with Australia, Japan, South Korea, Saudi Arabia and Thailand. The EU and the US have committed to conclude a deal within the next 30 days. The US government says the deals will form the basis for global collaboration.

    Secretary of the Interior Doug Burgum told a conference on Tuesday that “there is strong interest from another 20 countries” to sign similar deals.

    The US also announced the creation of the Forum on Resource Geostrategic Engagement (FORGE), which will succeed the Minerals Security Partnership and enable member countries to collaborate on mineral policy and projects. It will be chaired by South Korea until June.

    Prioritising cleantech

    US officials emphasised the growing need for minerals to power artificial intelligence, data centres and the digital economy but made no reference to the booming demand from cleantech industries manufacturing batteries, heat pumps, solar panels and wind turbines.

    For Schröder, Europe could play a role in shaping the initiative by prioritising cleantech industries.

    Any price-floor mechanism “should also be linked to ensuring that mining and processing is done to the highest possible environmental standards” and support efforts to improve supply chain traceability, he said.

      The Trump administration argues that setting a minimum price for minerals will help create a stable environment to attract long-term capital into new mining projects.

      But how this will work in practice remains unclear and complex. Prices vary for each mineral, each stage of the value chain and across different countries. “All of that needs to be discussed and agreed,” said Schröder, warning that a trading club could easily become “a cartel” and risk breaching World Trade Organisation rules.

      Chinese dependence

      The US’s attempt to broker new alliances to secure mineral supplies comes as Washington is seeking to fast-track mining permits at home and announced plans to stockpile minerals to help shield domestic manufacturers from cheaper Chinese competition.

      This is particularly acute when it comes to rare earths with China accounting for around 60% of mining output and more than 90% of global rare earths refining capacity.

      The Trump administration has doubled down on efforts to diversify its mineral supplies, especially for rare earths, after American manufacturers faced supply shortages last year when China expanded export restrictions amid trade tensions with Washington.

      Rare earths are pivotal to producing magnets that are used in wind turbines, electric vehicle motors as well as many other advanced technologies. Both countries reached a deal to lift the restrictions on supplies but some limits are still in place despite the truce.

      “We just can’t be in a position where our entire economy… is in a position to be held hostage by someone that could change the world economy through a form of export controls,” US Secretary of the Interior Burgum said on Tuesday.

        Yet, for many resource-rich countries, the US’s national security strategy poses the biggest risk to global supply chain stability, said Cory Combs, head of critical mineral research at advisory firm Trivium China.

        Ultimately, global efforts to diversify mineral value chain mean China will lose market share. “But it’s not going to lose its advantages,” he told Climate Home News.

        “Industry will still buy every Chinese material they can possibly get their hands on, because it’s cheaper, it’s better, it’s faster and more reliable when you don’t have the export controls,” he said.

        Project Vault

        To help shore up mineral reserves in the short-term, President Donald Trump announced the establishment of a US critical mineral reserve earlier this week.

        Project Vault will “ensure that American businesses and workers are never harmed by any shortage – we never want to go through what we went through a year ago,” he said.

        The US Export-Import Bank is providing up to $10 billion in loans – the largest deal in the bank’s history – to procure and store minerals in warehouses across the US for manufacturers to use in case of a supply shock.

        Dozens of companies have committed an additional $1.67bn in private capital to build up the reserve. EV battery manufacturer Clarios, GE Vernova, which produces wind turbines and grid electrification technologies, as well as carmakers Stellantis and General Motors and planemaker Boeing have said they would participate.

        Mineral analysts warn that stockpiling might be a short-term solution to securing minerals but in the case of rare earths it could in fact deepen reliance on Beijing if Chinese supplies remain the cheapest on the market and are therefore used to fill the vault.

        The post ‘America needs you’: US seeks trade alliance to break China’s critical mineral dominance   appeared first on Climate Home News.

        ‘America needs you’: US seeks trade alliance to break China’s critical mineral dominance  

        Continue Reading

        Climate Change

        Gas flaring soars in Niger Delta post-Shell, afflicting communities  

        Published

        on

        There are days when the sulphur-like, toxic smell coming from the nearby oil facilities is so potent that Azuh Chinenye struggles to go outside her house early in the morning. “When you inhale, you as a person, your body system, and every other thing will change… you can’t stand the odour,” she said.

        Chinenye lives in Oyigbo, a town less than 20 miles (32 km) from Port Harcourt, in the Niger Delta, the heart of Nigeria’s main oil-producing region.

        Signs of the industry are everywhere in Oyigbo. Active flare stacks stand just metres from homes and businesses, whose walls are caked in soot. Close to a primary school, Climate Home News saw oil spilling from a corroded underground pipe.

        The local oil field here was for many years owned and operated by Shell, until it was sold to a Nigerian firm for $533 million in early 2021. Since the sale, gas flaring has increased dramatically at Oyigbo, despite the new operator’s promise to “protect our planet” and the health of communities.

        A local doctor and residents told Climate Home News that the opposite is happening in reality, as people struggle with the effects of noxious pollutants released by flaring at production facilities close to their homes.

        Flaring worsens climate crisis

        Fifteen times more gas was burned at the Oyigbo field in 2024 compared to 2020, according to an analysis of satellite data prepared for Climate Home News by SkyTruth, an environmental watchdog. This pattern is repeated at other fields previously owned by Shell across the Niger Delta, the data shows.

        Flaring occurs when gas produced during oil drilling is burned off, instead of being utilised. The process releases vast amounts of carbon dioxide and methane, a potent planet-heating greenhouse gas, alongside toxic chemicals.

        Failure to tackle gas flaring pushes global climate goals further out of reach, as cutting methane emissions from the oil and gas industry is widely seen by climate and energy experts as a quick win to slow global warming in the short term.

        Shell claims to have significantly reduced its emissions and says it achieved zero routine flaring last year, but our analysis reveals that this was driven primarily by selling off high-emission assets – from the US to Nigeria – which are then free to continue polluting, albeit under different management.

        After Shell divestments, flaring on the rise

        A spokesperson for Shell told Climate Home News by email that, when the energy giant selects buyers for divestments, it assesses “a number of factors such as their financial strength, operating culture and environmental performance” and shares emissions reduction plans for the assets, where relevant.

        But Shell does not monitor the performance of those assets once it has handed over control to the buyer, the spokesperson said, adding that regulation of operations by the new owner is carried out by governments.

        After years of staying flat at the global level, flaring has risen again since 2023, including in Nigeria, where smaller home-grown firms have been ramping up production seeking to maximise oil revenues while lacking the expertise to prevent flaring, according to a World Bank report.

        To understand more about how this wasteful and dangerous process continues to harm people’s lives, Climate Home News went to the Niger Delta, a part of the world unique for how many residents are forced to live in close proximity to flare stacks.

        New owner promised sustainable production

        Rising gas flaring in Oyigbo is harming the wellbeing of the local community. Photo: Vivian Chime

        Chief Maduabuchi Felix Achiele at his home in Oyigbo. Photo: Vivian Chime

        Rising gas flaring in Oyigbo is harming the wellbeing of the local community. Photo: Vivian Chime

        Chief Maduabuchi Felix Achiele at his home in Oyigbo. Photo: Vivian Chime

        “Gas flaring has increased in the years since Shell left,” said Chief Maduabuchi Felix Achiele, a community leader in Oyigbo. “In a week, we can observe two, three, four instances of flaring but when Shell was here, it was just once in a while.”

        The field has been owned by Trans-Niger Oil and Gas (TNOG) since January 2021, along with the rest of the assets within the OML 17 oil block. The company that runs operations in the block – Lagos-based Heirs Energies – has boasted about turning an “underperforming asset” into an economic success after taking it over from Shell.

        Heirs Energies said it has doubled production at OML 17 without that coming at the expense of environmental and climate integrity. “We can create a symmetry, a symbiotic relationship between oil and gas, the environment and people […] sustainability is infused in what we are doing,” its CEO Osayande Igiehon said in an interview late last year.

          Heirs Energies announced an agreement with the Nigerian National Petroleum Corporation (NNPC) to capture and monetise gas from OML 17 in December, though the company did not give a timeframe for when this project would be completed. Heirs failed to respond to questions sent by Climate Home News for this story.

          On its website, the company says it is “committed to eliminating routine flaring and greenhouse gas emissions by 2025”. But the emissions figures and experience of the local community tell a radically different story.

          Jump in flaring volumes

          In OML 17, the vast oil block that covers much of the urban area of Port Harcourt and its surrounding towns like Oyigbo, gas flaring volumes grew sevenfold between 2020 – the last year of Shell’s involvement – and 2024, according to data presented to Climate Home News by SkyTruth.

          To conduct this analysis, we tracked sales of onshore Nigerian assets, determined the location of each site using open source data, and then worked with SkyTruth to monitor flaring from these locations using data from the Earth Observation Group at the Colorado School of Mines.

          Within OML 17, at Agbada, about a 30-minute drive north of Port Harcourt city centre, flaring doubled immediately after the sale in 2021. The following year, it almost doubled again and has remained close to that mark since. In Nkali, another asset within OML 17, flaring was nearly four times higher in the year after the sale.

          While SkyTruth’s analysis was only able to use figures up to 2024, flaring remained high at these oil blocks throughout 2025, according to publicly available data from the NNPC.

          This pattern can be seen in other oil blocks. Shell lost its right to operate OML 11 in August 2021, a block that spans the Ogoniland region. This helped the company to record a drop in emissions from both greenhouse gases and volatile organic compounds, while flaring went up under the block’s new operator, a subsidiary of the government-owned NNPC.

          “Catastrophic” for communities

          Communities in Ogoniland are seeking reparations for the decades-long environmental devastation caused by oil drilling. When it took control of the assets in 2021, the NNPC said the firm’s operations would be driven by “a social contract that would put the people and environment of the Niger Delta above pecuniary considerations”. Nonetheless, gas flaring tripled between 2021 and 2024 across all OML 11 fields, according to the analysis prepared by SkyTruth.

          It was a similar story at Nembe Creek, part of the OML 29 block sold by Shell to Nigerian firm Aiteo for $1.7bn in March 2015. That year, flaring rose by around a quarter and then doubled in 2016.

          For blighted Niger Delta communities, oil spill clean-ups are another broken promise

          Production at the facility fell dramatically following a huge oil spill in 2021 that dumped 20,000 barrels of oil per day into local creeks for a month. Gas flaring at Nembe Creek spiked again in 2024, to an annual volume 54% higher than in 2014, when Shell still ran the field. In June 2024, another spill forced Aiteo to halt production.

          Andrew Baxter, senior director for business and energy transition at the Environmental Defense Fund (EDF), told Climate Home News: “Flaring and spills harm human health. Flaring is not just a climate menace, it’s catastrophic to the communities that live around these facilities.”

          It also wastes energy, he said. “This is a depressing waste of resources when there are still significant challenges around energy access,” he added.

          Q&A: “False” climate solutions help keep fossil fuel firms in business

          Given the need to address climate change, it’s important that when majors sell fossil fuel assets, buyers have comparable green targets and operating standards, according to organisations like EDF.

          Baxter argued that the way Shell managed its troubled oil operations in the Niger Delta over decades had limited its options when selling them on.

          “When operators have a poor environmental record and substandard record of community engagement, it should come as little surprise when they cannot attract many interested buyers for those assets. This rule applies globally,” he said.

          Big Oil’s “paper decarbonisation”

          Between 2016 and 2023, more than 60% of Shell’s emissions reductions came from divestments. That matters because, despite these emissions no longer being Shell’s responsibility, they are still heating up the Earth’s climate.

          Krista Halttunen, a visiting researcher at Imperial College London who focuses on the future of the oil industry, told Climate Home News that companies like Shell are practising “paper decarbonisation”, reducing emissions in their annual reports rather than the real world.

          “This story shows the limits of company-driven emissions reduction,” she said. “Very few companies are reducing real-world emissions. Fossil fuel companies can’t meaningfully decarbonise without changing their business model, because their whole reason for being is digging up material that will add more carbon to the atmosphere.”

          Shell did not reply to Climate Home News’ questions about how it had achieved its emission reductions.

          It also appears that Shell’s achievement of reaching zero routine flaring in 2025 was achieved in large part through the sale of its Nigerian assets. In March of that year Shell sold its onshore Nigerian assets to a consortium of companies called Renaissance Africa. Earlier, in 2023, Shell had stated that its remaining Nigerian assets accounted for around half of total routine and non-routine flaring in its integrated gas and upstream facilities.

          Removing Nigerian assets from its portfolio, whether in the Renaissance deal or earlier transactions, may have helped transform Shell’s flaring emissions, but for people living in the Niger Delta life has stayed the same.

          Active flaring at an oil production facility in Oyigbo seen in January 2026. Photo: Vivian Chime

          An oil puddle near a community path in Oyigbo. The local chief said oil often spills from corroded underground pipelines. Photo: Vivian Chime

          Active flaring at an oil production facility in Oyigbo seen in January 2026. Photo: Vivian Chime

          An oil puddle near a community path in Oyigbo. The local chief said oil often spills from corroded underground pipelines. Photo: Vivian Chime

          “Flaring is not new in this community,” explained Theodore Ike Ogu, a 60-year-old smallholder farmer who lives in Oyigbo. “We are suffering and flaring is increasing.”

          Here, temperatures regularly hover around 35 degrees Celsius during the day, with humidity often exceeding 50%. When the flares are going full blast, the heat for those living and working nearby can be unbearable, locals said. At night, when the town is quiet, the noise from the flares keeps people awake.

          Chief Maduabuchi recalled that residents used to collect water during the rainy season to drink and wash. “You can’t even use it to wash because, as it comes down, it is dirty because of the smoke,” he complained.

          Health risks from toxic chemicals

          Gas flaring releases harmful chemicals, and numerous studies, including some conducted in the Niger Delta, have linked living close to flares with being more likely to contract forms of cancer and respiratory illnesses.

          Complaints from local communities about health issues and unexplained deaths have been rising in oil-producing communities such as Oyigbo as gas flaring intensifies, according to Dr Bieye Renner Briggs, a Port Harcourt-based public health physician and environmental advocate.

          While he cautions that a direct link has not yet been scientifically proven in the Niger Delta, Dr Briggs says the connection is “probable”, given similar findings in other oil regions worldwide. He recommended performing routine autopsies in the local communities to establish clear evidence of whether deaths are caused by gas flaring or oil pollution.

          In Oyigbo, flames can be seen rising from flare stacks located near homes and businesses. Source: Airbus / Google Earth – Image from 30/05/2025

          In Oyigbo, flames can be seen rising from flare stacks located near homes and businesses. Source: Airbus / Google Earth – Image from 30/05/2025

          Dr Briggs warned that people living near flare sites face a wide range of serious health hazards, from hypertension and cardiomyopathy, which can increase the risk of heart failure, to asthma, chronic bronchitis and kidney disease.

          Soot particles released by flaring represent a particularly acute health risk, he warned. These are small enough to bypass the body’s natural defences and enter the bloodstream, increasing the risk of cancers and other conditions, he told Climate Home News. “Everything a smoker will suffer and more is what somebody that is exposed to soot will suffer,” he said, noting that, unlike smokers, residents can do little to limit their constant exposure.

          The oil companies contacted by Climate Home News for this article, including Shell, did not respond to requests for comment on the health effects of flaring.

          “I have different health issues: incessant lung pains, at times a cough, all those things, catarrh,” said Theodore Ike Ogu, adding there are “so many things that we notice health-wise which we believe are due to flaring”.

          Azuh Chinenye’s husband, Kelechi Prince Azuh, died in May last year after suffering from breathing difficulties and frequent asthma attacks. “He was 49 years old,” she said, fighting back tears. “You see his poster outside there and three of the children are in university. He didn’t even see them complete their first year.”

          Azuh Chinenye said gas flaring has had a major impact on her life. Photo: Vivian Chime

          A poster commemorating Kelechi Prince Azuh who died last year after suffering from breathing difficulties. Photo: Vivian Chime

          Azuh Chinenye said gas flaring has had a major impact on her life. Photo: Vivian Chime

          A poster commemorating Kelechi Prince Azuh who died last year after suffering from breathing difficulties. Photo: Vivian Chime

          “Nowhere else to go”

          Oil production, meanwhile, has increased at former Shell fields. Extracting oil from mature fields like those in Nigeria produces a significant amount of associated gas and, in the absence of funding and infrastructure to make use of this, it is often flared.

          Last May, Heirs Energies CEO Igiehon told the Financial Times that Nigerian firms could build better relationships with locals, after years of tension with oil majors over frequent spills and the destruction of local livelihoods. “We’re able to move around unfettered because we have a robust relationship with the communities,” he argued.

          The increase in flaring in blocks like OML 17 has tested that idea.

          Colombia aims to launch fossil fuel transition platform at first global conference

          “Shell was great,” said Chief Maduabuchi, who explained that the company provided healthcare and food to the local community. The new operator, he says, “only gives us a small amount of rice, unlike Shell which used to give us each 50kg”.

          Asked why she has chosen to stay in Oyigbo after her husband’s death, Azuh Chinenye explains that it’s much cheaper to live here than in the centre of Port Harcourt. She uses her inhaler when she struggles to breathe and tries not to go outside when the soot gets bad.

          “I can easily pack up, but this is my compound, this is my community, and there is nowhere else I will go,” she said.

          Cover photo: A woman empties a plastic bowl filled with tapioca, which is derived from cassava paste, on sewn sacks laid on the ground close to a gas flaring furnace in Ughelli, Delta State, Nigeria September 17, 2020. (Photo: REUTERS/Afolabi Sotunde)

          The post Gas flaring soars in Niger Delta post-Shell, afflicting communities   appeared first on Climate Home News.

          Gas flaring soars in Niger Delta post-Shell, afflicting communities  

          Continue Reading

          Climate Change

          Analysis: Clean energy drove more than a third of China’s GDP growth in 2025

          Published

          on

          Solar power, electric vehicles (EVs) and other clean-energy technologies drove more than a third of the growth in China’s economy in 2025 – and more than 90% of the rise in investment.

          Clean-energy sectors contributed a record 15.4tn yuan ($2.1tn) in 2025, some 11.4% of China’s gross domestic product (GDP) – comparable to the economies of Brazil or Canada.

          The new analysis for Carbon Brief, based on official figures, industry data and analyst reports, shows that China’s clean-energy sectors nearly doubled in real value between 2022-25 and – if they were a country – would now be the 8th-largest economy in the world.

          Other key findings from the analysis include:

          • Without clean-energy sectors, China would have missed its target for GDP growth of “around 5%”, expanding by 3.5% in 2025 instead of the reported 5.0%.
          • Clean-energy industries are expanding much more quickly than China’s economy overall, with their annual growth rate accelerating from 12% in 2024 to 18% in 2025.
          • The “new three” of EVs, batteries and solar continue to dominate the economic contribution of clean energy in China, generating two-thirds of the value added and attracting more than half of all investment in the sectors.
          • China’s investments in clean energy reached 7.2tn yuan ($1.0tn) in 2025, roughly four times the still sizable $260bn put into fossil-fuel extraction and coal power.
          • Exports of clean-energy technologies grew rapidly in 2025, but China’s domestic market still far exceeds the export market in value for Chinese firms.

          These investments in clean-energy manufacturing represent a large bet on the energy transition in China and overseas, creating an incentive for the government and enterprises to keep the boom going.

          However, there is uncertainty about what will happen this year and beyond, particularly for solar power, where growth has slowed in response to a new pricing system and where central government targets have been set far below the recent rate of expansion.

          An ongoing slowdown could turn the sectors into a drag on GDP, while worsening industrial “overcapacity” and exacerbating trade tensions.

          Yet, even if central government targets in the next five-year plan are modest, those from local governments and state-owned enterprises could still drive significant growth in clean energy.

          This article updates analysis previously reported for 2023 and 2024.

          Clean-energy sectors outperform wider economy

          China’s clean-energy economy continues to grow far more quickly than the wider economy. This means that it is making an outsize contribution to annual economic growth.

          The figure below shows that clean-energy technologies drove more than a third of the growth in China’s economy overall in 2025 and more than 90% of the net rise in investment.

          Contributions to the growth in Chinese investment (left) and GDP overall (right) in 2025 by sector, trillion yuan.
          Contributions to the growth in Chinese investment (left) and GDP overall (right) in 2025 by sector, trillion yuan. Source: Centre for Research on Energy and Clean Air (CREA) analysis for Carbon Brief.

          In 2022, China’s clean-energy economy was worth an estimated 8.4tn yuan ($1.2tn). By 2025, the sectors had nearly doubled in value to 15.4tn yuan ($2.1tn).

          This is comparable to the entire output of Brazil or Canada and positions the Chinese clean-energy industry as the 8th-largest economy in the world. Its value is roughly half the size of the economy of India – the world’s fourth largest – or of the US state of California.

          The outperformance of the clean-energy sectors means that they are also claiming a rising share of China’s economy overall, as shown in the figure below.

          Share of China’s GDP contributed by clean-energy sectors, %.
          Share of China’s GDP contributed by clean-energy sectors, %. Source: CREA analysis for Carbon Brief.

          This share has risen from 7.3% of China’s GDP in 2022 to 11.4% in 2025.

          Without clean-energy sectors, China’s GDP would have expanded by 3.5% in 2025 instead of the reported 5.0%, missing the target of “around 5%” growth by a wide margin.

          Clean energy thus made a crucial contribution during a challenging year, when promoting economic growth was the foremost aim for policymakers.

          The table below includes a detailed breakdown by sector and activity.

          Sector Activity Value in 2025, CNY bln Value in 2025, USD bln Year-on-year growth Growth contribution Value contribution Value in 2025, CNY trn Value in 2024, CNY trn Value in 2023, CNY trn Value in 2022, CNY trn
          EVs Investment: manufacturing capacity 1,643 228 18% 10.4% 10.7% 1.6 1.4 1.2 0.9
          EVs Investment: charging infrastructure 192 27 58% 2.9% 1.2% 0.192 0.122 0.1 0.08
          EVs Production of vehicles 3,940 548 29% 36.4% 25.6% 3.94 3.065 2.26 1.65
          Batteries Investment: battery manufacturing 277 38 35% 3.0% 1.8% 0.277 0.205 0.32 0.15
          Batteries Exports: batteries 724 101 51% 10.1% 4.7% 0.724 0.48 0.46 0.34
          Solar power Investment: power generation capacity 1,182 164 15% 6.3% 7.7% 1.182 1.031 0.808 0.34
          Solar power Investment: manufacturing capacity 506 70 -23% -6.5% 3.3% 0.506 0.662 0.95 0.51
          Solar power Electricity generation 491 68 33% 5.1% 3.2% 0.491 0.369 0.26 0.19
          Solar power Exports of components 681 95 21% 4.9% 4.4% 0.681 0.562 0.5 0.35
          Wind power Investment: power generation capacity, onshore 612 85 47% 8.1% 4.0% 0.612 0.417 0.397 0.21
          Wind power Investment: power generation capacity, offshore 96 13 98% 2.0% 0.6% 0.096 0.048 0.086 0.06
          Wind power Electricity generation 510 71 13% 2.4% 3.3% 0.51 0.453 0.4 0.34
          Nuclear power Investment: power generation capacity 173 24 18% 1.1% 1.1% 0.17 0.15 0.09 0.07
          Nuclear power Electricity generation 216 30 8% 0.7% 1.4% 0.216 0.2 0.19 0.19
          Hydropower Investment: power generation capacity 54 7 -7% -0.2% 0.3% 0.05 0.06 0.06 0.06
          Hydropower Electricity generation 582 81 3% 0.6% 3.8% 0.582 0.567 0.51 0.51
          Rail transportation Investment 902 125 6% 2.1% 5.8% 0.902 0.851 0.764 0.714
          Rail transportation Transport of passengers and goods 1,020 142 3% 1.3% 6.6% 1.02 0.99 0.964 0.694
          Electricity transmission Investment: transmission capacity 644 90 6% 1.5% 4.2% 0.64 0.61 0.53 0.5
          Electricity transmission Transmission of clean power 52 7 14% 0.3% 0.3% 0.052 0.046 0.04 0.04
          Energy storage Investment: Pumped hydro 53 7 5% 0.1% 0.3% 0.05 0.05 0.04 0.03
          Energy storage Investment: Grid-connected batteries 232 32 52% 3.3% 1.5% 0.232 0.152 0.08 0.02
          Energy storage Investment: Electrolysers 11 2 29% 0.1% 0.1% 0.011 0.009 0 0
          Energy efficiency Revenue: Energy service companies 620 86 17% 3.8% 4.0% 0.62 0.528003 0.52 0.45
          Total Investments 7,198 1001 15% 38.2% 46.7% 7.20 6.28 6.00 4.11
          Total Production of goods and services 8,216 1,143 22% 61.8% 53.3% 8.22 6.73 5.58 4.32
          Total Total GDP contribution 15,414 2144 18% 100.0% 100.0% 15.41 13.01 11.58 8.42

          EVs and batteries were the largest drivers of GDP growth

          In 2024, EVs and solar had been the largest growth drivers. In 2025, it was EVs and batteries, which delivered 44% of the economic impact and more than half of the growth of the clean-energy industries. This was due to strong growth in both output and investment.

          The contribution to nominal GDP growth – unadjusted for inflation – was even larger, as EV prices held up year-on-year while the economy as a whole suffered from deflation. Investment in battery manufacturing rebounded after a fall in 2024.

          The major contribution of EVs and batteries is illustrated in the figure below, which shows both the overall size of the clean-energy economy and the sectors that added the most to the rise from year to year.

          Contribution of clean-energy sectors to China’s GDP and GDP growth, trillion yuan, 2022-2025.
          Contribution of clean-energy sectors to China’s GDP and GDP growth, trillion yuan, 2022-2025. Source: CREA analysis for Carbon Brief.

          The next largest subsector was clean-power generation, transmission and storage, which made up 40% of the contribution to GDP and 30% of the growth in 2025.

          Within the electricity sector, the largest drivers were growth in investment in wind and solar power generation capacity, along with growth in power output from solar and wind, followed by the exports of solar-power equipment and materials.

          Investment in solar-panel supply chains, a major growth driver in 2022-23, continued to fall for the second year. This was in line with the government’s efforts to rein in overcapacity and “irrational” price competition in the sector.

          Finally, rail transportation was responsible for 12% of the total economic output of the clean-energy sectors, but saw relatively muted growth year-on-year, with revenue up 3% and investment by 6%.

          Note that the International Energy Agency (IEA) world energy investment report projected that China invested $627bn in clean energy in 2025, against $257bn in fossil fuels.

          For the same sectors as the IEA report, this analysis puts the value of clean-energy investment in 2025 at a significantly more conservative $430bn. The higher figures in this analysis overall are therefore the result of wider sectoral coverage.

          Electric vehicles and batteries

          EVs and vehicle batteries were again the largest contributors to China’s clean-energy economy in 2025, making up an estimated 44% of value overall.

          Of this total, the largest share of both total value and growth came from the production of battery EVs and plug-in hybrids, which expanded 29% year-on-year. This was followed by investment into EV manufacturing, which grew 18%, after slower growth rates in 2024.

          Investment in battery manufacturing also rebounded after a drop in 2024, driven by new battery technology and strong demand from both domestic and international markets. Battery manufacturing investment grew by 35% year-on-year to 277bn yuan.

          The share of electric vehicles (EVs) will have reached 12% of all vehicles on the road by the end of 2025, up from 9% a year earlier and less than 2% just five years ago.

          The share of EVs in the sales of all new vehicles increased to 48%, from 41% in 2024, with passenger cars crossing the 50% threshold. In November, EV sales crossed the 60% mark in total sales and they continue to drive overall automotive sales growth, as shown below.

          Production of combustion-engine vehicles and EVs in China, million units. EVs include battery electric vehicles and plug-in hybrids.
          Production of combustion-engine vehicles and EVs in China, million units. EVs include battery electric vehicles and plug-in hybrids. Source: China Association of Automobile Manufacturers data via Wind Financial Terminal.

          Electric trucks experienced a breakthrough as their market share rose from 8% in the first nine months of 2024 to 23% in the same period in 2025.

          Policy support for EVs continues, for example, with a new policy aiming to nearly double charging infrastructure in the next three years.

          Exports grew even faster than the domestic market, but the vast majority of EVs continue to be sold domestically. In 2025, China produced 16.6m EVs, rising 29% year-on-year. While exports accounted for only 21% or 3.4m EVs, they grew by 86% year-on-year. Top export destinations for Chinese EVs were western Europe, the Middle East and Latin America.

          The value of batteries exported also grew rapidly by 41% year-on-year, becoming the third largest growth driver of the GDP. Battery exports largely went to western Europe, north America and south-east Asia.

          In contrast with deflationary trends in the price of many clean-energy technologies, average EV prices have held up in 2025, with a slight increase in average price of new models, after discounts. This also means that the contribution of the EV industry to nominal GDP growth was even more significant, given that overall producer prices across the economy fell by 2.6%. Battery prices continued to drop.

          Clean-power generation

          The solar power sector generated 19% of the total value of the clean-energy industries in 2025, adding 2.9tn yuan ($41bn) to the national economy.

          Within this, investment in new solar power plants, at 1.2tn yuan ($160bn), was the largest driver, followed by the value of solar technology exports and by the value of the power generated from solar. Investment in manufacturing continued to fall after the wave of capacity additions in 2023, reaching 0.5tn yuan ($72bn), down 23% year-on-year.

          In 2025, China achieved another new record of wind and solar capacity additions. The country installed a total of 315GW solar and 119GW wind capacity, adding more solar and two times as much wind as the rest of the world combined.

          Clean energy accounted for 90% of investment in power generation, with solar alone covering 50% of that. As a result, non-fossil power made up 42% of total power generation, up from 39% in 2024.

          However, a new pricing policy for new solar and wind projects and modest targets for capacity growth have created uncertainty about whether the boom will continue.

          Under the new policy, new clean-power generation has to compete on price against existing coal power in markets that place it at a disadvantage in some key ways.

          At the same time, the electricity markets themselves are still being introduced and developed, creating investment uncertainty.

          Investment in solar power generation increased year-on-year by 15%, but experienced a strong stop-and-go cycle. Developers rushed to finish projects ahead of the new pricing policy coming into force in June and then again towards the end of the year to finalise projects ahead of the end of the current 14th five-year plan.

          Investment in the solar sector as a whole was stable year-on-year, with the decline in manufacturing capacity investment balanced by continued growth in power generation capacity additions. This helped shore up the utilisation of manufacturing plants, in line with the government’s aim to reduce “disorderly” price competition.

          By late 2025, China’s solar manufacturing capacity reached an estimated 1,200GW per year, well ahead of the global capacity additions of around 650GW in 2025. Manufacturers can now produce far more solar panels than the global market can absorb, with fierce competition leading to historically low profitability.

          China’s policymakers have sought to address the issue since mid-2024, warning against “involution”, passing regulations and convening a sector-wide meeting to put pressure on the industry. This is starting to yield results, with losses narrowing in the third quarter of 2025.

          The volume of exports of solar panels and components reached a record high in 2025, growing 19% year-on-year. In particular, exports of cells and wafers increased rapidly by 94% and 52%, while panel exports grew only by 4%.

          This reflects the growing diversification of solar-supply chains in the face of tariffs and with more countries around the world building out solar panel manufacturing capacity. The nominal value of exports fell 8%, however, due to a fall in average prices and a shift to exporting upstream intermediate products instead of finished panels.

          Hydropower, wind and nuclear were responsible for 15% of the total value of the clean-energy sectors in 2025, adding some 2.2tn yuan ($310bn) to China’s GDP in 2025.

          Nearly two-thirds of this (1.3tn yuan, $180bn) came from the value of power generation from hydropower, wind and nuclear, with investment in new power generation projects contributing the rest.

          Power generation grew 33% from solar, 13% from wind, 3% from hydropower and 8% from nuclear.

          Within power generation investment, solar remained the largest segment by value – as shown in the figure below – but wind-power generation projects were the largest contributor to growth, overtaking solar for the first time since 2020.

          Value of new clean-power generation capacity, billion yuan, by year added.
          Value of new clean-power generation capacity, billion yuan, by year added. Source: CREA analysis for Carbon Brief.

          In particular, offshore wind power capacity investment rebounded as expected, doubling in 2025 after a sharp drop in 2024.

          Investment in nuclear projects continued to grow but remains smaller in total terms, at 17bn yuan. Investment in conventional hydropower continued to decline by 7%.

          Electricity storage and grids

          Electricity transmission and storage were responsible for 6% of the total value of the clean-energy sectors in 2025, accounting for 1.0 tn yuan ($140bn).

          The most valuable sub-segment was investment in power grids, growing 6% in 2025 and reaching $90bn. This was followed by investment in energy storage, including pumped hydropower, grid-connected battery storage and hydrogen production.

          Investment in grid-connected batteries saw the largest year-on-year growth, increasing by 50%, while investments in electrolysers also grew by 30%. The transmission of clean power increased an estimated 13%, due to rapid growth in clean-power generation.

          China’s total electricity storage capacity reached more than 213GW, with battery storage capacity crossing 145GW and pumped hydro storage at 69GW. Some 66GW of battery storage capacity was added in 2025, up 52% year-on-year and accounting for more than 40% of global capacity additions.

          Notably, capacity additions accelerated in the second half of the year, with 43GW added, compared with the first half, which saw 23GW of new capacity.

          The battery storage market initially slowed after the renewable power pricing policy, which banned storage mandates after May, but this was quickly replaced by a “market-driven boom”. Provincial electricity spot markets, time-of-day tariffs and increasing curtailment of solar power all improved the economics of adding storage.

          By the end of 2025, China’s top five solar manufacturers had all entered the battery storage market, making a shift in industry strategy.

          Investment in pumped hydropower continued to increase, with 15GW of new capacity permitted in the first half of 2025 alone and 3GW entering operation.

          Railways

          Rail transportation made up 12% of the GDP contribution of the clean-energy sectors, with revenue from passenger and goods rail transportation the largest source of value. Most growth came from investment in rail infrastructure, which increased 6% year-on-year

          The electrification of transport is not limited to EVs, as rail passenger, freight and investment volumes saw continued growth. The total length of China’s high-speed railway network reached 50,000km in 2025, making up more than 70% of the global high-speed total.

          Energy efficiency

          Investment in energy efficiency rebounded strongly in 2025. Measured by the aggregate turnover of large energy service companies (ESCOs), the market expanded by 17% year-on-year, returning to growth rates last seen during 2016-2020.

          Total industry turnover has also recovered to its previous peak in 2021, signalling a clear turnaround after three years of weakness.

          Industry projections now anticipate annual turnover reaching 1tn yuan in annual turnover by 2030, a target that had previously been expected to be met by 2025.

          China’s ESCO market has evolved into the world’s largest. Investment within China’s ESCO market remains heavily concentrated in the buildings sector, which accounts for around 50% of total activity. Industrial applications make up a further 21%, while energy supply, demand-side flexibility and energy storage together account for approximately 16%.

          Implications of China’s clean-energy bet

          Ongoing investment of hundreds of billions of dollars into clean-energy manufacturing represents a gigantic economic and financial bet on a continuing global energy transition.

          In addition to the domestic investment covered in this article, Chinese firms are making major investments in overseas manufacturing.

          The clean-energy industries have played a crucial role in meeting China’s economic targets during the five-year period ending this year, delivering an estimated 40%, 25% and 37% of all GDP growth in 2023, 2024 and 2025, respectively.

          However, the developments next year and beyond are unclear, particularly for solar power generation, with the new pricing system for renewable power generation leading to a short-term slowdown and creating major uncertainty, while central government targets have been set far below current rates of clean-electricity additions.

          Investment in solar-power generation and solar manufacturing declined in the second half of the year, while investment in generation clocked growth for the full year, showing the risk to the industries under the current power market set-ups that favour coal-fired power.

          The reduction in the prices of clean-energy technology has been so dramatic that when the prices for GDP statistics are updated, the sectors’ contribution to real GDP – adjusted for inflation or, in this case deflation – will be revised down.

          Nevertheless, the key economic role of the industry creates a strong motivation to keep the clean-energy boom going. A slowdown in the domestic market could also undermine efforts to stem overcapacity and inflame trade tensions by increasing pressure on exports to absorb supply.

          A recent CREA survey of experts working on climate and energy issues in China found that the majority believe that economic and geopolitical challenges will make the “dual carbon” goals – and with that, clean-energy industries – only more important.

          Local governments and state-owned enterprises will also influence the outlook for the sector. Their previous five-year plans played a key role in creating the gigantic wind and solar power “bases” that substantially exceeded the central government’s level of ambition.

          Provincial governments also have a lot of leeway in implementing the new electricity markets and contracting systems for renewable power generation. The new five-year plans, to be published this year, will therefore be of major importance.

          About the data

          Reported investment expenditure and sales revenue has been used where available. When this is not available, estimates are based on physical volumes – gigawatts of capacity installed, number of vehicles sold – and unit costs or prices.

          The contribution to real growth is tracked by adjusting for inflation using 2022-2023 prices.

          All calculations and data sources are given in a worksheet.

          Estimates include the contribution of clean-energy technologies to the demand for upstream inputs such as metals and chemicals.

          This approach shows the contribution of the clean-energy sectors to driving economic activity, also outside the sectors themselves, and is appropriate for estimating how much lower economic growth would have been without growth in these sectors.

          Double counting is avoided by only including non-overlapping points in value chains. For example, the value of EV production and investment in battery storage of electricity is included, but not the value of battery production for the domestic market, which is predominantly an input to these activities.

          Similarly, the value of solar panels produced for the domestic market is not included, as it makes up a part of the value of solar power generating capacity installed in China. However, the value of solar panel and battery exports is included.

          In 2025, there was a major divergence between two different measures of investment. The first, fixed asset investment, reportedly fell by 3.8%, the first drop in 35 years. In contrast, gross capital formation saw the slowest growth in that period but still inched up by 2%.

          This analysis uses gross capital formation as the measure of investment, as it is the data point used for GDP accounting. However, the analysis is unable to account for changes in inventories, so the estimate of clean-energy investment is for fixed asset investment in the sectors.

          The analysis does not explicitly account for the small and declining role of imports in producing clean-energy goods and services. This means that the results slightly overstate the contribution to GDP but understate the contribution to growth.

          For example, one of the most important import dependencies that China has is for advanced computing chips for EVs. The value of the chips in a typical EV is $1,000 and China’s import dependency for these chips is 90%, which suggests that imported chips represent less than 3% of the value of EV production.

          The estimates are likely to be conservative in some key respects. For example, Bloomberg New Energy Finance estimates “investment in the energy transition” in China in 2024 at $800bn. This estimate covers a nearly identical list of sectors to ours, but excludes manufacturing – the comparable number from our data is $600bn.

          China’s National Bureau of Statistics says that the total value generated by automobile production and sales in 2023 was 11tn yuan. The estimate in this analysis for the value of EV sales in 2023 is 2.3tn yuan, or 20% of the total value of the industry, when EVs already made up 31% of vehicle production and the average selling prices for EVs was slightly higher than for internal combustion engine vehicles.

          The post Analysis: Clean energy drove more than a third of China’s GDP growth in 2025 appeared first on Carbon Brief.

          Analysis: Clean energy drove more than a third of China’s GDP growth in 2025

          Continue Reading

          Trending

          Copyright © 2022 BreakingClimateChange.com