

In February 2026, the United States and India reached a landmark trade deal that reshaped clean energy trade between the two nations. The agreement lowered reciprocal tariffs on Indian goods from 25% to 18% and removed a 25% penalty tariff imposed due to India’s Russian oil imports. For Indian solar exports, this effectively cut total tariffs from roughly 50% to 18%, immediately lifting optimism across the renewable energy sector and providing relief to developers.
This deal marked a reset in US-India trade relations. In return, India committed to purchasing $500 billion in American energy, technology, and agricultural products over five years. Moreover, the agreement encourages India to shift energy imports from Russia to the US and Venezuela, further aligning trade with energy security goals.
Solar Exports and Market Reaction
The impact on solar exports was immediate and significant. In the first nine months of 2025, India exported 10.4 GW of solar modules to the US, nearly 97% of total solar exports, according to JMK Research and Mercom Capital.
This surge was further boosted by strong demand from Europe, where India shipped an additional 1.6 GW, bringing the first nine months’ total to 15 GW. Consequently, Indian manufacturers are consolidating their position as reliable global suppliers.
Waaree Energies, Adani Solar, and RenewSys led the expansion. Their success is underpinned by growing domestic production capacity, which reached 52 GW for solar cells and 55 GW for modules by Q3 2025. At the same time, India’s dependence on imported components is declining.
Module imports fell 39% from the previous quarter, although China still supplies nearly 75% of imports. This shift signals India’s strengthening self-reliance and growing manufacturing sophistication.
Solar Stocks Rally After US-India Trade Deal
Several media resources reported that the stock market responded promptly after the trade deal. Solar-focused firms, including Insolation Energy Ltd. and Oriana Power Ltd., surged over 24% in February 2026, recovering from losses in January. Investors expect that lower tariffs will not only improve profit margins but also accelerate orders and speed up US project pipelines. If the deal is formally ratified in March, analysts predict this momentum will continue.
Additionally, the tariff cut supports supply chain diversification. As the US reduces reliance on Chinese suppliers, Indian manufacturers are emerging as reliable alternatives. In particular, Vikram Solar and Waaree Energies are well-positioned to capture growing shares in utility-scale and commercial solar projects.
Inside India’s Solar Growth Story
Domestic solar development has mirrored export growth. JMK Research further highlighted that in 2025, India added:
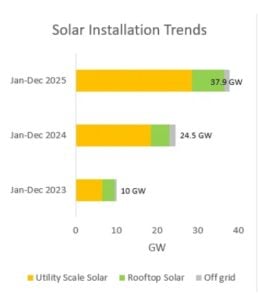
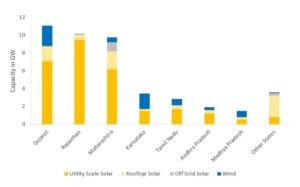
- A record 37.9 GW of solar capacity, representing a 54.7% increase from 2024. Of this, utility-scale projects contributed 28.6 GW. Furthermore, the open access segment accounted for more than 38% of utility-scale additions, showing the increasing role of private buyers.
- Rooftop solar also expanded rapidly, with 7.9 GW added in 2025—a 72% rise from the previous year. Programs such as PM Surya Ghar: Muft Bijli Yojana supported this growth by incentivizing households to adopt solar systems.
- Off-grid and distributed solar contributed 1.35 GW, slightly below 2024 levels, but remained an important segment for decentralized power solutions.
Quite evidently, India’s strong domestic manufacturing is the reason for installation growth. By December 2025, cumulative module and cell capacity crossed 200 GW. The market remains concentrated, with the top five cell manufacturers—Waaree, Adani, Vikram, REC, and Rayzon—holding 71% of capacity. In the module segment, Waaree, Adani, Vikram, REC, and RenewSys account for 58%. By mastering efficient production and securing a stable supply of raw materials, these firms continue to strengthen India’s global competitiveness.
Electricity Demand and Renewable Energy Milestones
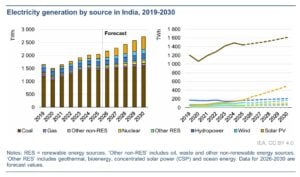
While exports attract attention, domestic electricity demand is equally critical. IEA’s latest electricity report shows that in 2025, demand rose only 1.4%, the slowest pace since 1972 outside the pandemic. Mild weather reduced cooling needs, early monsoon rains eased peak loads, and industrial activity slowed slightly.
However, this slowdown is temporary. Demand is expected to rebound 6.9% in 2026 and grow at an average of 6.4% annually through 2030. Rising incomes will drive greater air conditioner and appliance use, industrial output is expanding steadily, and electricity use in agriculture and transport continues to rise. As a result, combined with strong exports, India is set to strengthen its position as a key player in global renewable energy.
Government Programs Boost Solar Adoption Nationwide
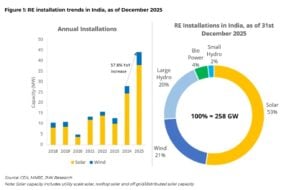
The IEA report further says that renewable electricity generation reached record levels in 2025, increasing 20% over 2024. Solar PV led the expansion with 24% growth, benefiting from falling module costs and sustained policy support. Consequently, total operational renewable energy capacity surpassed the 200 GW mark, with solar accounting for 53% of total renewable capacity.
Looking ahead, India now draws around 50% of its installed capacity from non-fossil sources, ahead of its 2030 Paris Agreement target.
Government programs continue to encourage adoption. PM-KUSUM promotes solar-powered agricultural pumps, while PM Surya Ghar incentivizes rooftop installations. Furthermore, the launch of India’s first National Policy on Geothermal Energy in 2025 expands the country’s clean energy options, complementing solar development.
Between 2026 and 2030, the country plans to add nearly 300 GW of renewable capacity, with solar leading the way. Domestic manufacturing will support this growth, with 100 GW of ALMM-certified capacity ensuring a self-reliant supply chain.
Grid Modernization and Reliability
As the sector grows, India is shifting focus from capacity addition to reliable operation. In 2025, the Central Electricity Authority mandated Automatic Weather Stations at large solar projects to improve forecasting and ensure stable integration into the grid.
Additionally, the Ministry of Power launched the India Energy Stack to build a digital infrastructure for the power sector. A Utility Intelligence Platform integrates data from distribution companies, improving operations and enabling better planning.
Meanwhile, the Revamped Distribution Sector Scheme continues to roll out, including 203 million smart meters. States that implement reforms efficiently receive additional financial incentives. Together, these measures ensure that India’s growing renewable fleet can operate smoothly alongside coal, gas, and nuclear power.
State-wise Solar and wind capacity addition in India from January-December 2025
Implications of the US-India Deal
Ultimately, the US-India solar tariff cut is more than a trade story. It strengthens India’s renewable energy exports, improves project economics in the US, and enhances the competitiveness of Indian manufacturers.
Moreover, combined with rising domestic demand, record solar expansion, nuclear development, and grid modernization, India’s energy sector is entering a transformative decade. By 2030, the country could lead global clean energy exports while maintaining a diverse and reliable power system.
In short, the tariff cut boosts short-term exports and creates long-term advantages. It strengthens US-India trade ties and aligns closely with India’s renewable energy ambitions through 2030, positioning India as a global solar powerhouse.
- READ MORE: Renewables 2025: How China, the US, Europe, and India Are Leading the World’s Clean Energy Growth
The post India’s Solar and Renewable Energy Outlook to 2030: Impact of the US-India 18% Tariff Cut on Exports appeared first on Carbon Credits.

EU carbon credit claims changed on 27 September 2026, the day the Directive (EU) 2024/825 began to apply across the European Union. The change is narrow. It changes how a company can talk about the credits it buys. A product can no longer be called neutral on the strength of compensation alone; however, every specific, evidenced statement about what a company measured, reduced, and funded stays fully available.

The post Promoting Improved Cooking Practices in Nigeria appeared first on Terrapass.



-
Climate Change1 year ago
Guest post: Why China is still building new coal – and when it might stop
-

 Greenhouse Gases2 years ago
嘉宾来稿:满足中国增长的用电需求 光伏加储能“比新建煤电更实惠”
-
Greenhouse Gases1 year ago
Guest post: Why China is still building new coal – and when it might stop
-

 Climate Change2 years ago
嘉宾来稿:满足中国增长的用电需求 光伏加储能“比新建煤电更实惠”
-

 Renewable Energy12 months ago
Sending Progressive Philanthropist George Soros to Prison?
-
Climate Change2 years ago
Bill Discounting Climate Change in Florida’s Energy Policy Awaits DeSantis’ Approval
-
Greenhouse Gases1 year ago
嘉宾来稿:探究火山喷发如何影响气候预测
-

 Climate Change2 years ago
Analysis: China’s CO2 falls 1% in Q2 2024 in first quarterly drop since Covid-19