

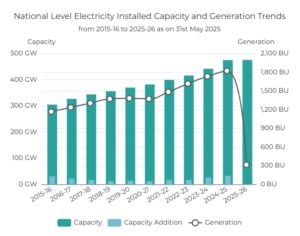
India’s energy transition reached a critical milestone in June 2025. The Government of India, Press Information Bureau, noted that the country’s total installed power generation capacity hit 476 GW, with non-fossil fuel sources contributing nearly 49 percent. This marks a substantial shift from a coal-dominated past, driven by rapid solar growth, expanding wind and hydro capacity, and early strides in hydrogen and nuclear energy.
India’s Rising Electricity Demand Fuels the Shift
Electricity demand in India has surged in recent years, fueled by growing commercial and residential spaces, increased ownership of air conditioners and appliances, and rising industrial consumption. Over the past five years, India recorded the third-largest growth in power generation capacity globally, after China and the United States.
Although generation has increased across all sources, investment in renewables—especially solar PV—has taken the lead. According to the IEA, 83 percent of India’s power sector investment in 2024 went to clean energy.
India also became the world’s largest recipient of development finance for clean power, receiving around USD 2.4 billion for project-level interventions. As a result, the share of non-fossil power generation capacity climbed to 44 percent in 2024, closing in on India’s target of 50 percent by 2030.
Solar Power Becomes the Cornerstone of Clean Energy
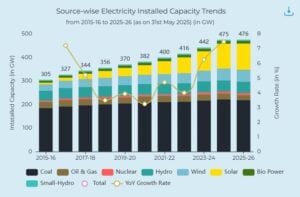
Solar energy continues to dominate India’s renewable push. Installed solar capacity soared to 110.9 GW in June 2025, up from just 2.82 GW in March 2014—a nearly 39-fold increase. In FY 2024–25 alone, 23.83 GW of solar was added, showcasing robust government support and investor confidence.
This growth aligns with a major expansion in domestic solar manufacturing. Module production capacity jumped from 2.3 GW to 88 GW, and cell production rose from 1.2 GW to 25 GW. These developments have strengthened India’s self-reliance in the solar supply chain.
Flagship programs such as PM Surya Ghar: Muft Bijli Yojana, rooftop solar subsidies, and the PM-KUSUM scheme have accelerated adoption, especially in rural and residential areas, empowering households and farmers to embrace solar energy.
Coal Still Dominates India’s Power Mix, but Its Grip is Slipping
Despite clean energy gains, coal remains India’s largest single source, with an installed capacity of 219 GW. When combined with gas (20 GW) and diesel (0.589 GW), thermal power contributes 240 GW, slightly over 50 percent of the country’s total.
Coal continues to play a key role in meeting base load demand, particularly for industrial use. However, its dominance is gradually eroding as solar, wind, and other renewable options scale up. Additionally, policy pressure to decarbonize and falling costs of renewables are accelerating this shift.
Wind, Hydro, and Biomass Add Balance to the Grid
India’s renewable mix is becoming increasingly diverse. Wind power reached 51.3 GW, with 4.15 GW added in the last fiscal year. Hydropower, including both large and small projects, stood at 48 GW, up from 35.8 GW in 2014. These sources provide critical grid flexibility and peak load management.
Biomass and biogas power have also strengthened, contributing 11.6 GW. Over five million small biogas plants and hundreds of medium-scale systems are now operational. In a major leap, India’s production of compressed biogas has reached 1,211 tonnes per day across 150 plants—up from just 8 tonnes per day in 2014.
Green Hydrogen finds its Place in the Energy Mix
India’s green hydrogen ambitions are taking shape under the National Green Hydrogen Mission. While still in its early stages, pilot projects using electrolysis powered by solar and wind have begun.
These initiatives support the government’s target of producing 5 million metric tonnes of green hydrogen annually by 2030, backed by 125 GW of renewable capacity.
Though current hydrogen capacity remains in the pilot phase, it is expected to play a transformative role in decarbonizing heavy industries, refining, and long-duration storage in the coming decade.
Nuclear power: Needs a Ramp-Up
Nuclear energy continues to provide a steady source of low-emission electricity, with 8.8 GW of capacity as of June 2025. While its share remains modest, nuclear offers reliable baseload power and supports the country’s broader clean energy ambitions.
The Government of India’s Department of Atomic Energy has announced that the RAPS-7 reactor (700 MW) was successfully connected to the grid on March 17, 2025, increasing the total number of operational nuclear reactors in the country to 25, with a combined capacity of 8,880 MW.
An additional 13,600 MW of nuclear power capacity is currently under implementation. Once these projects are progressively completed, India’s total nuclear capacity is expected to reach 22,480 MW by 2031–32.
The private sector is already playing a significant role in the nuclear ecosystem, particularly in the manufacturing, supply, and execution of nuclear power projects. Moreover, private investment in nuclear power generation has now been enabled within the current legal framework to support the establishment of Bharat Small Reactors (BSRs).
India’s Investment Landscape and Infrastructure Bottlenecks
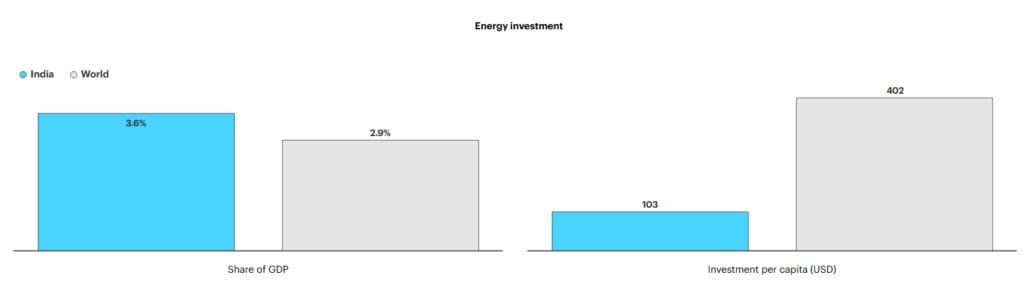
India has introduced several steps to attract more investment in clean energy. These include significant support for solar panel manufacturing, battery production, and building better electricity grids. The IEA further highlighted that in 2023, foreign direct investment (FDI) in the power sector reached USD 5 billion. It’s almost double the amount seen before COVID-19. Under the current policy, India allows 100 percent FDI in power generation and transmission, except in nuclear energy.
However, foreign portfolio investment (money from global investors in stocks and bonds) has dropped over the last two years. One major challenge is the high cost of financing. In India, borrowing costs for renewable energy projects are 80 percent higher than in developed countries, which makes clean energy projects more expensive and less profitable.
Another serious issue is off-taker risk—this means that electricity distribution companies (discoms) often fail to pay power generators on time. As of March 2025, discoms owed more than USD 9 billion in unpaid bills. Their total losses had reached USD 75 billion by 2023.
In addition, poor transmission infrastructure is holding back progress. India has about 60 GW of renewable power capacity that is ready but cannot be used fully because the electricity cannot be moved where it is needed. This shows the urgent need to improve the power grid and connect new projects to the system faster.
The Future is Clean Energy
India’s energy system is changing quickly. Today, clean energy sources like solar, wind, hydro, biomass, nuclear, and hydrogen make up almost half of the country’s power capacity, nearly equal to fossil fuels. This shows that India is on track toward a cleaner, low-carbon future.
- The country’s goal is to have 500 GW of non-fossil power capacity by 2030.
The progress seen by June 2025 proves that this goal is within reach. But to keep the momentum going, India must solve key problems like discom debt, grid delays, and high project costs. With the right actions, India can fully unlock the potential of clean, affordable, and reliable energy.
The post India Achieves 50% Non-Fossil Fuel Power Milestone: Solar Shines Bright appeared first on Carbon Credits.

EU carbon credit claims changed on 27 September 2026, the day the Directive (EU) 2024/825 began to apply across the European Union. The change is narrow. It changes how a company can talk about the credits it buys. A product can no longer be called neutral on the strength of compensation alone; however, every specific, evidenced statement about what a company measured, reduced, and funded stays fully available.

The post Promoting Improved Cooking Practices in Nigeria appeared first on Terrapass.


-
Climate Change1 year ago
Guest post: Why China is still building new coal – and when it might stop
-

 Greenhouse Gases2 years ago
嘉宾来稿:满足中国增长的用电需求 光伏加储能“比新建煤电更实惠”
-
Greenhouse Gases1 year ago
Guest post: Why China is still building new coal – and when it might stop
-

 Climate Change2 years ago
嘉宾来稿:满足中国增长的用电需求 光伏加储能“比新建煤电更实惠”
-

 Renewable Energy12 months ago
Sending Progressive Philanthropist George Soros to Prison?
-
Climate Change2 years ago
Bill Discounting Climate Change in Florida’s Energy Policy Awaits DeSantis’ Approval
-
Greenhouse Gases1 year ago
嘉宾来稿:探究火山喷发如何影响气候预测
-

 Climate Change2 years ago
Analysis: China’s CO2 falls 1% in Q2 2024 in first quarterly drop since Covid-19