Connect with us

Published

on

A few years ago, solar power became the “cheapest electricity in history”, but it still lacked the ability to meet demand 24 hours a day and 365 days a year.

Since then, there have been significant improvements in the cost and performance of batteries, making it cheaper than ever to pair solar with energy storage using batteries.

In our new Ember “white paper”, we present modelling showing that solar with batteries in major sunny cities, such as Las Vegas or Mexico City, can now get more than 90% of the way to continuous generation, at costs below those of coal or nuclear power.

Even in cloudier cities away from the equator, such as Birmingham in the UK, it is possible to run on solar plus storage across the majority of hours in the year.

The white paper sets out how near-continuous “24/365” solar power has become an economic and technological reality in sunny regions.

Solar and storage ‘gamechangers’

A solar panel generates most electricity when the sun is shining, meaning it cannot provide constant power throughout the year. Put another way, 100 watts (W) of solar capacity only generates around 20W on average – and that output will be concentrated in daylight hours.

Our report shows that battery energy storage can unlock solar’s full potential, by turning daytime generation into around-the-clock electricity.

Indeed, when paired with sufficient battery storage, that same 100W of solar capacity can provide electricity around the clock – up to 100% of the time.

This also means up to five times as much solar generation can be delivered using the same connection to the electricity network, reducing the need for costly grid upgrades.

Battery energy storage is now cheaper than ever, with global average prices falling by 40% in 2024 alone. The cost of a full battery system fell to a record-low $165 per kilowatt hour (kWh), according to BloombergNEF.

Additionally, there have been a number of technological improvements boosting battery energy storage.

Recent innovations mean almost all grid batteries are now cobalt- and nickel-free, reducing the need for so-called “critical minerals”. They are longer-lasting than ever, with some batteries now having 20-year warranties. And they are safer than ever – with fire risk improving by a hundred-fold since 2019.

Improved container design has also cut maintenance and installation costs.

Our white paper shows that supply is ready to scale, with manufacturing capacity already exceeding demand. There is also significant new production capacity under construction outside of China.

The next frontier is sodium-ion “salt” batteries, which would eliminate the need for lithium and drive prices down even further. One large salt-battery plant has already been commissioned in China.

These technological advances and declining costs mean the world’s first “24/365” battery and solar plants are now coming online:

  • In Hawaii, several solar-plus-battery projects are providing electricity through the night after the decommissioning of the last coal power plant in 2022.
  • In the United Arab Emirates (UAE), at 100 megawatt (MW), Moro Hub is the world’s largest 100% solar-powered data centre, commissioned in 2022.
  • In Saudi Arabia, a tourist mega project, including 16 hotel resorts that are all powered entirely by solar electricity, was completed in 2023.
  • The first gigawatt-scale 24-hour solar project is already under development in the UAE. Emirati state-owned renewable energy company Masdar is leading the project, which was announced in January 2025 and will consist of a 5.2 gigawatt (GW) solar photovoltaic (PV) plant coupled with a 19 gigawatt hour (GWh) battery storage system to provide 1GW of uninterrupted solar electricity supply to the grid.

These examples show that 24/365 solar electricity has already been supplying customers and that it will increasingly start being used to power parts of the grid.

Cheaper in the sun

In order to investigate the potential for 24/365 solar, Ember’s white paper modelled a hypothetical system, using real weather data, for a series of cities around the world.

The modelling is based on a system with 6GW of solar capacity and 17GWh of battery storage, because there are roughly 15 hours of darkness in winter in the mid-latitudes.

The modelling shows that solar and battery in the sunniest cities could already get more than 90% of the way to 24/365 solar generation, covering almost every hour of every day in the year.

For example, Muscat in Oman could draw on 1GW of continuous solar electricity for 99% of hours in the year, if it paired 6GW of solar panels with 17GWh of battery capacity.

Las Vegas in the US, Mexico City in Mexico and Johannesburg in South Africa could all rely on such solar-plus-storage systems for at least 95% of hours in the year.

Even Birmingham in the UK could achieve 1GW of solar output for 62% of hours annually. (This is lower than for sunnier cities due to a stronger seasonal cycle and cloudier weather.)

In the sunniest places, solar and storage could generate reliable output, close to 24/365, for around $100 per megawatt hour (MWh), based on average global costs for solar and batteries in 2024.

For each city, the yellow shading in the figure below shows the share of hours each year that it could rely on 1GW of solar output if it installed a 6GW solar plus 17GWh battery system, given historical weather conditions.
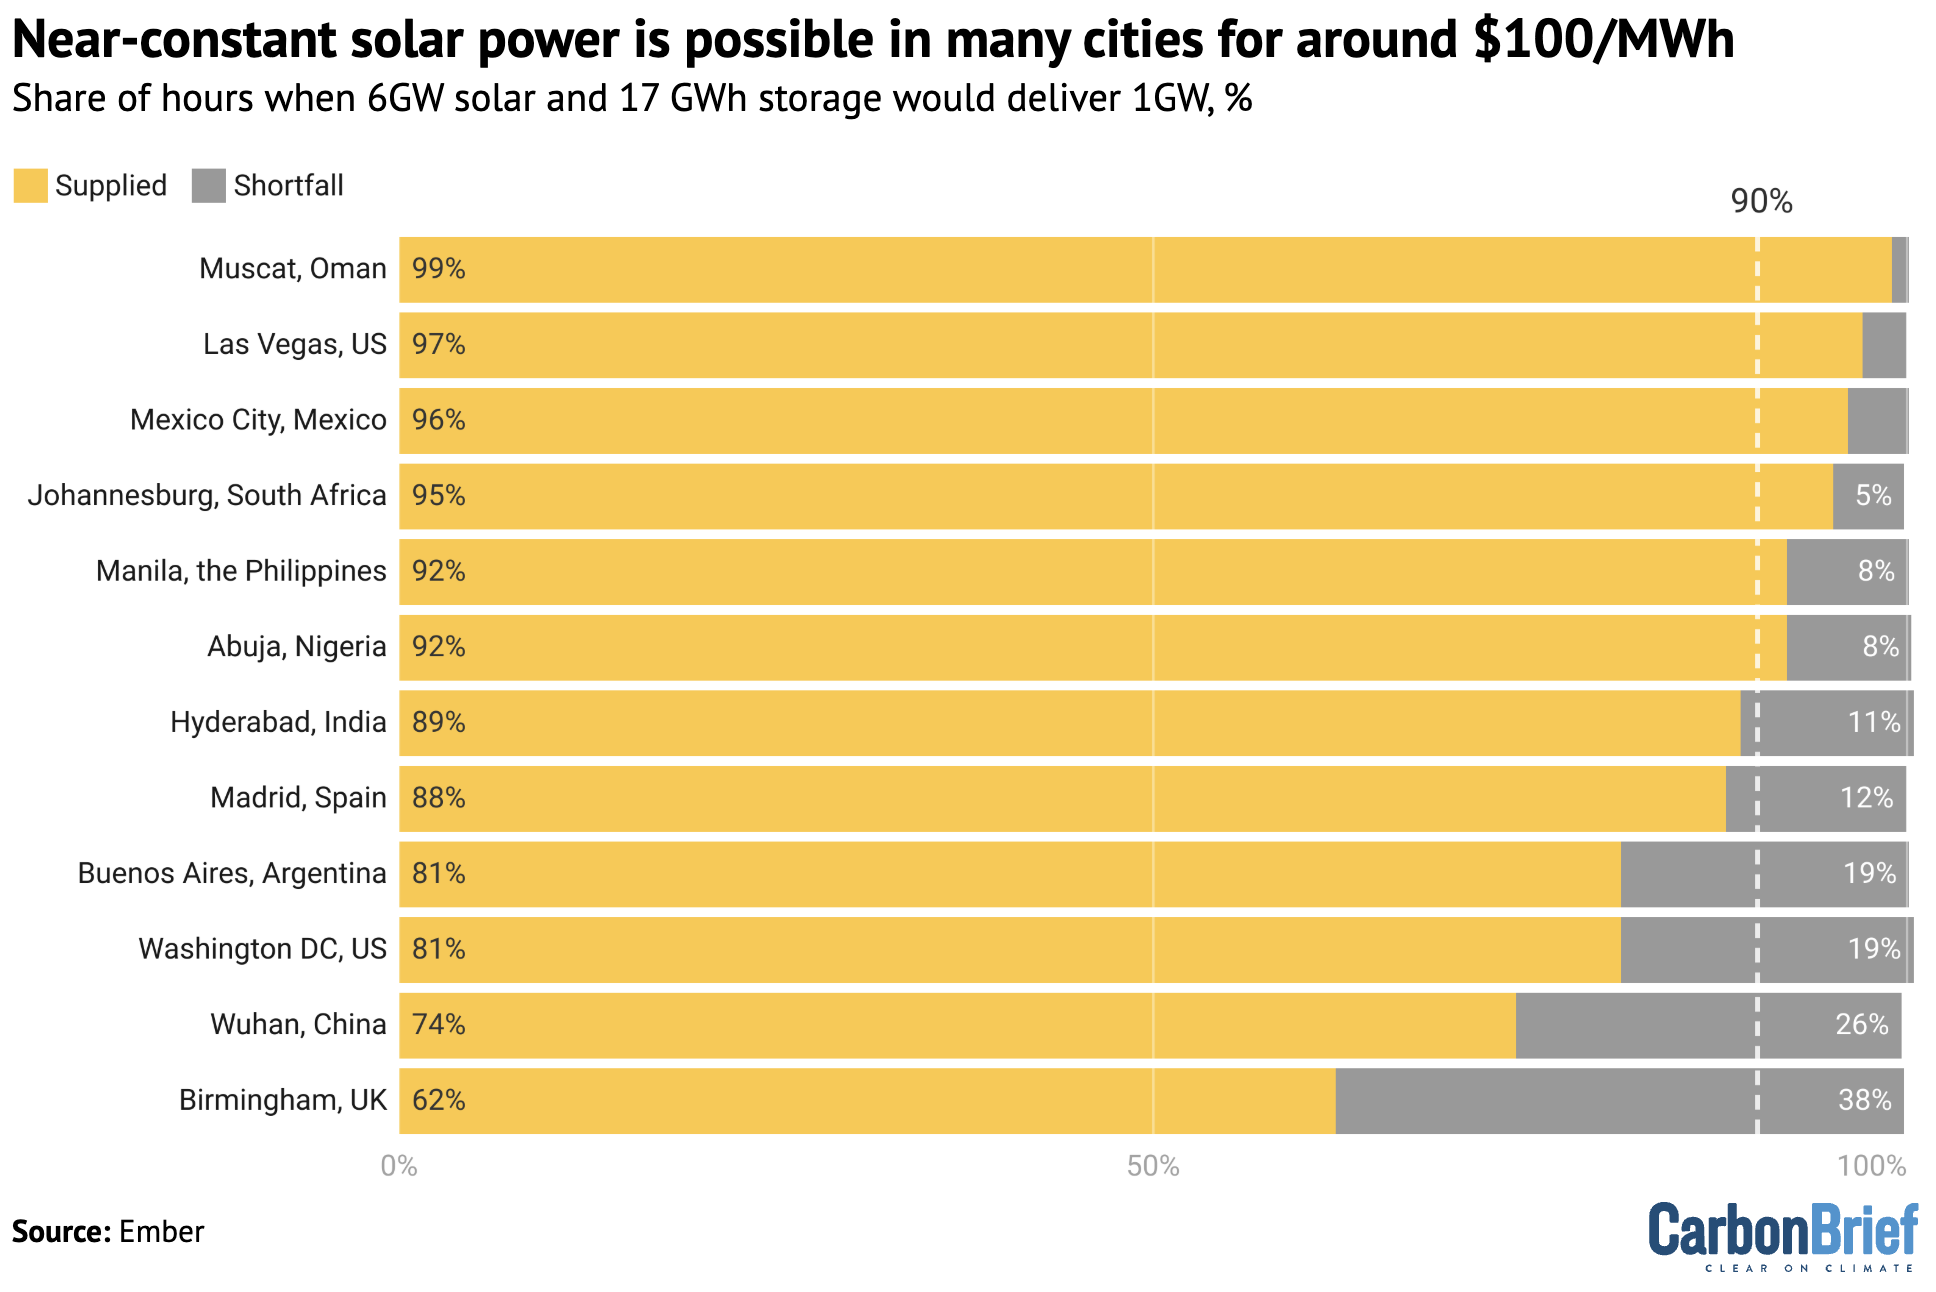
Chart: Near-constant solar power is possible in many cities for around $100/MWh
Share of the time when a 6GW solar plus 17GWh storage system would deliver 1GW of power across 12 cities, %, based on average weather conditions over 2005-23. Source: Ember.

Over the past year alone, the levelised cost of electricity (LCOE) for solar-plus-storage systems fell by 22%, driven by a 40% fall in battery prices. This is based on $165/kWh, which was BloombergNEF’s assessment of the global battery pack price at the end of 2024. The LCOE of solar and battery had fallen by 28% over the previous four years.

This makes solar with battery storage cheaper than both coal and nuclear when compared with US-based LCOE, as shown in the chart below.
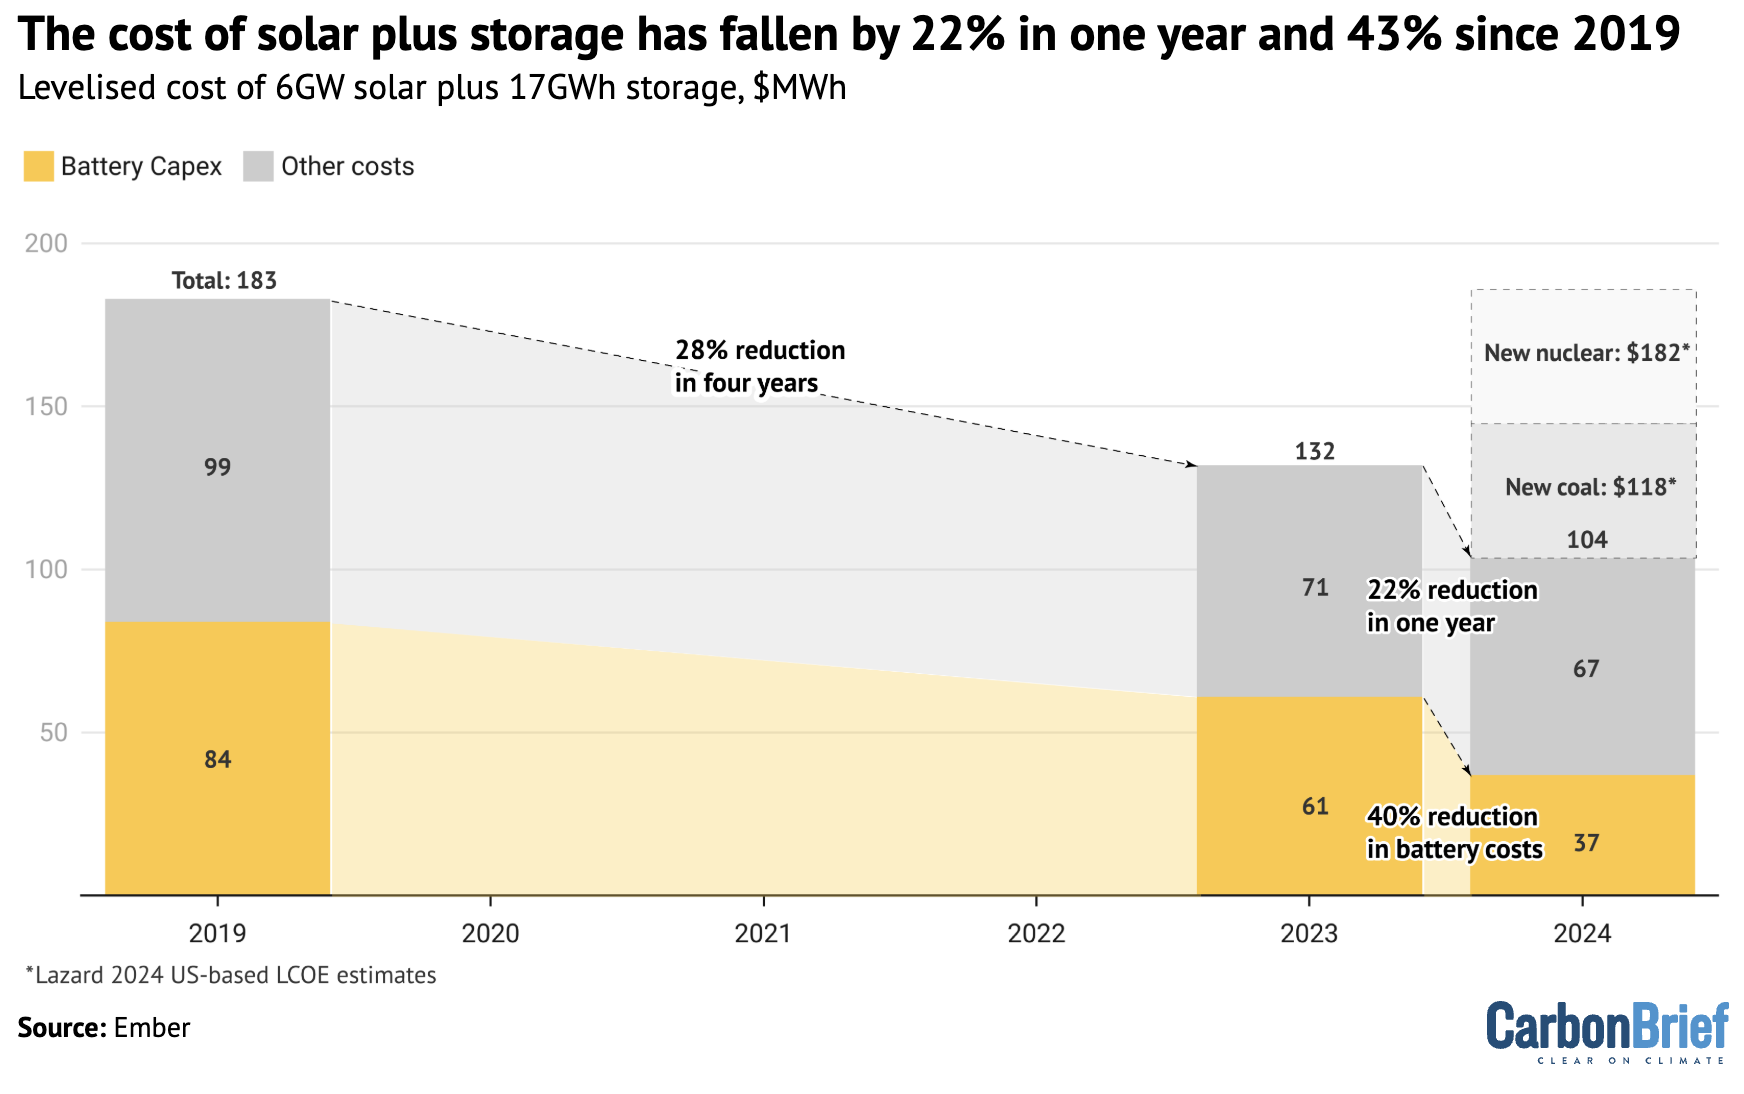
Chart: The cost of solar plus storage has fallen by 22% in one year and 43% since 2019.
The levelised cost, in $/MWh, of a 6GW solar power system co-located with a 17GWh battery system. The capital cost of the battery is shown in yellow and other costs are shown in grey. Costs for US coal and nuclear are from Lazard 2024. Source: Ember.

There is evidence that 2025 solar and battery prices will continue to fall again. Already in early 2025, tenders for large-scale battery storage projects in Tabuk and Hail, Saudi Arabia, reported battery prices as low as $72/kWh.

Cloudy day challenges

Our modelling shows that the greatest challenge to generating constant, year-round electricity from solar plus storage is not nighttime, but clouds.

In the mid-latitudes, with around 15 hours of darkness in winter, around 17 hours of battery capacity is sufficient to bridge the period from sunset to sunrise.

This is because batteries typically do not fully charge and discharge to maintain high performance over time.

However, getting to 24/365 solar is harder, as while every day has daylight, not every day has full sunlight. Even though clouds do not reduce solar generation to zero – and despite batteries being cheaper than ever – extra battery storage is still not an economical option for bridging cloudy periods across multiple days.

The graphic below illustrates this, based on the same 6GW solar plus 17GWh storage system as described before, generating electricity under the weather conditions and seasonal cycles of the same 12 cities around the world.

The chart for each city runs from January to December on the horizontal axis and across 24 hours of each day on the vertical axis. Direct use of solar power is shown in orange, with stored solar from the battery shown in yellow and periods with a shortfall in dark blue.

The figure shows that, even on the cloudiest day of the year in Muscat, this solar-plus-storage system would generate constant electricity for 18 hours. Madrid in Spain would see lower output on some shorter and cloudier days in November, December and January. In contrast, Hyderabad in India would be impacted in the summer by cloudy monsoon days.

Overall, the figure shows that the sunniest cities would only fall slightly short of 24/365 solar electricity, but clouds would have a larger impact elsewhere.
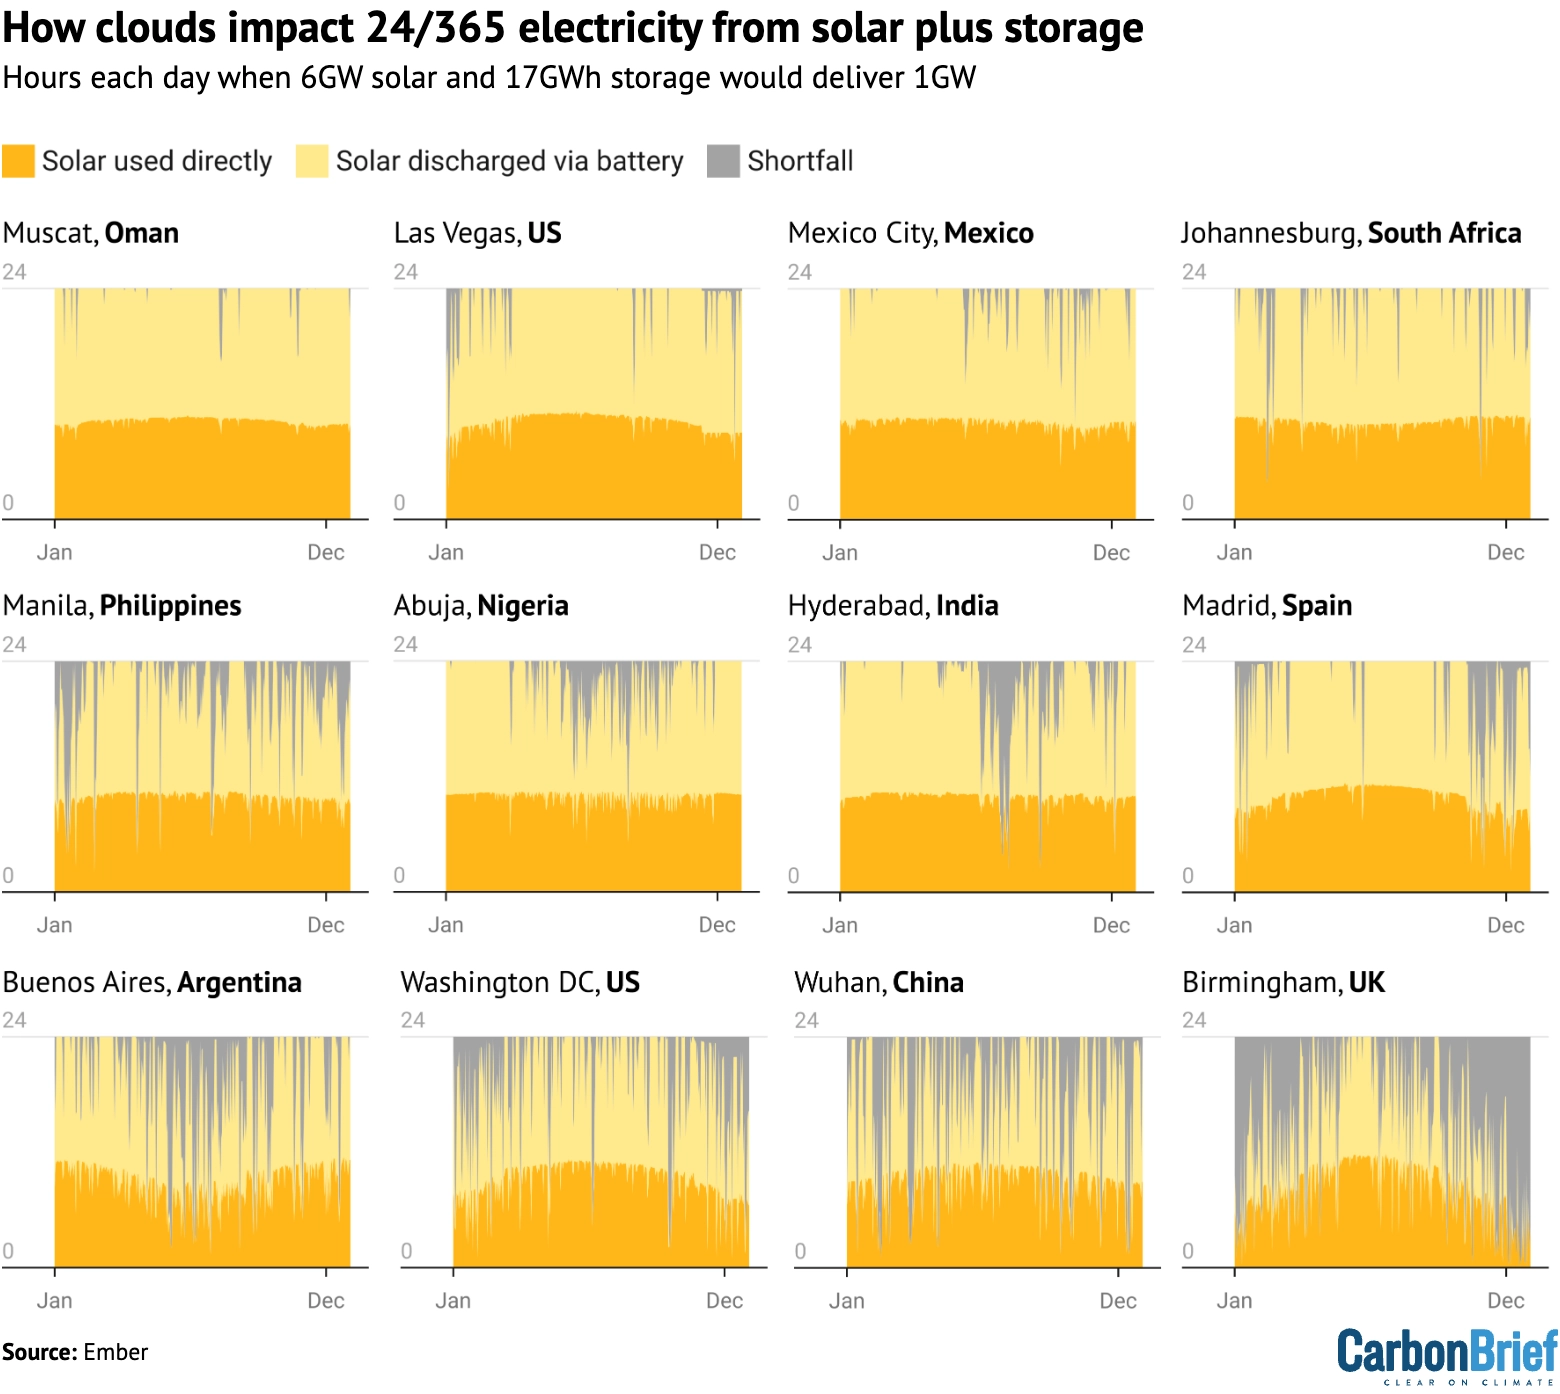
Chart: How clouds impact 24/365 electricity from solar plus storage
Hours each day when 6GW solar and 17GWh storage would deliver 1GW at 12 locations around the world. Each chart runs from January to December on the x-axis and across 24 hours on the y-axis. Solar power directly used is shown in orange, solar power discharged via battery storage is in yellow and the shortfall to 1GW is grey. Source: Ember.

The trade-off

The International Energy Agency (IEA) has described solar power as offering the “cheapest electricity in history”.

For example, solar power costs just $41/MWh in Las Vegas, according to Ember’s calculations using average global equipment and borrowing costs. However, this is only delivering electricity through daytime hours. As a result, on average around the world, solar has a “capacity factor” of 21% – meaning each unit of solar capacity generates 21% of its maximum theoretical output.

Raising this all the way to 97% raises the price to $104/MWh. However, this also substantially improves the value of solar, now that it is delivering close to 24/365. However, as the chart below shows, meeting the last few percent of demand from solar and storage alone significantly increases the price.

The best value between solar alone or solar with plentiful storage depends on the use case.

It may be optimal to build solar without a battery, so long as a factory can access cheap grid electricity when the solar panels are not generating, for example.

On the other hand, it may be optimal to build solar and batteries to get to 99.7% for an off-grid data centre that values reliability over price. Even in the most sunny places, exactly 100% supply will generally be uneconomic – but it is possible to get very close.
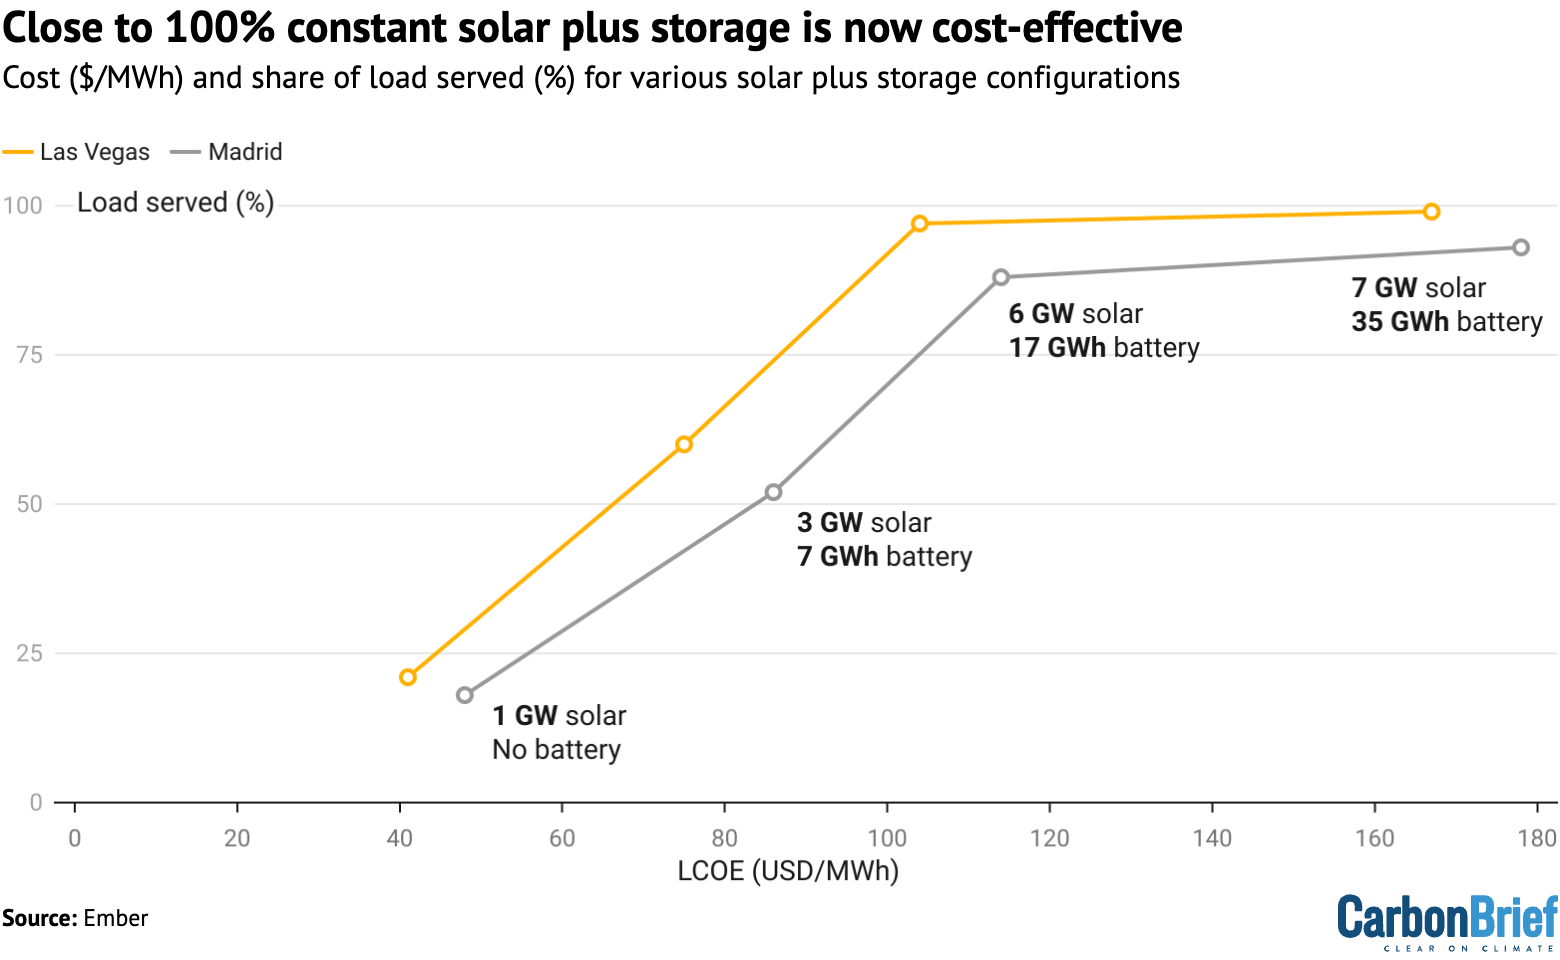
Line chart: Close to 100% constant solar plus storage is now cost-effective
Share of hours with at least 1GW of output, %, for various solar plus storage configurations, as well as the levelised cost, $/MWh, in Madrid, Spain (grey) and Las Vegas, US (yellow). Source: Ember.

For many cases and based on current prices, the sweet spot may be to size the system for a constant supply of solar electricity for 60-90% of the time, our modelling suggests.

This provides cheap, low-carbon solar power most of the time. It would enable electricity to be used flexibly through the night or during high-price hours.

If widely deployed, such systems would allow for a significantly downscaled need for grid investment, whether they are large-scale solar farms exporting more electricity to the grid or industrial sites drawing from public supplies less often.
The post Guest post: How solar panels and batteries can now run ‘close to 24/365’ in some cities appeared first on Carbon Brief.

Guest post: How solar panels and batteries can now run ‘close to 24/365’ in some cities

Continue Reading

Climate Change

Pawa in Palau

Published

on

This week our powerful Pacific team is in Palau for the Pacific Islands Forum Leaders Meeting. This is a major moment in our campaigns for Pacific climate justice and to stop deep sea mining. So what’s it all about, what can we expect over the coming days, and why is this year’s meeting in particular so important? Read on to find out!

*Pawa is Melanesian word meaning collective power.

Meet Moemoana Schwenke, our Pacific Climate Campaigner

“When you love something deeply, you do everything you can to protect it.”

@greenpeaceap

For us in the Pacific, protecting our home is an expression of love. Follow our journey across the Pacific all the way to COP31 in Türkiye. Pacific voices continue to lead the call for climate justice champion our priorities and build a movement for a Fossil Fuel Free Pacific, from our islands to the world. Join the movement and follow the journey. @Moemoana Schwenke

♬ original sound – Greenpeace Australia Pacific

What is the Pacific Islands Forum (PIF)?

The Pacific Islands Forum, or ‘PIF’, is our region’s most important political organisation. It is where countries of the Pacific — including Australia and New Zealand — come together to collaborate on shared challenges and to set collective goals.

The PIF Leaders Meeting is an annual weeklong event that includes a dedicated meeting of the Pacific’s small island developing states (PSIDS), many special side events organised by Pacific civil society, the leaders’ meeting itself, and more. At the end of the week, leaders issue a Forum Communiqué, capturing what they have agreed on, their shared priorities and the actions they will take together.

This year’s meeting is being held in the beautiful northern Pacific nation of Palau, the same place our Pacific team gathered back in January to plan for the year.

Islands in Palau
© Hector John Periquin

What’s at stake this year?

Climate change has dominated the PIF for decades. Pacific leaders have been crystal clear it is their number one priority, and the annual gathering is the moment they can exert maximum pressure on Australia over its fossil fuel record.

The voyage to COP31

This year’s meeting comes less than three months before COP31, where Australia will take on the role of President of Negotiations — a role it has committed to undertaking in partnership with the Pacific — and less than a month before the ‘Pacific Pre-COP’, to be held in Fiji and Tuvalu.

Following a fraught round of mid-year negotiations in Bonn, PIF leaders will need to set out a clear vision and priorities for COP31. These include accelerating a just global transition away from fossil fuels, defending science as the foundation of international climate cooperation, and increasing the availability and accessibility of finance for renewable energy and climate adaptation.

Pictured left to right - 
- Dr Simon Bradshaw, COP31 Lead and report author, Greenpeace Australia Pacific
-Belyndar Rikimani, Campaigns and Research Lead, Pacific Islands Students Fighting Climate Change
-Shiva Gounden, Head of Pacific, Greenpeace Australia Pacific
© Greenpeace / Marie Jacquemin

Accountability for Australian fossil fuel exports

Since the last PIF Leaders Meeting, Australia has signed the Belém Declaration on the Transition Away from Fossil Fuels. The declaration reaffirmed the legally binding commitment to help limit global warming to 1.5°C and recognised that this is incompatible with new fossil fuel production. Yet, Australia has continued to approve new coal and gas projects, including at least five since the last PIF Leaders Meeting.

Barry Dick observes the community graveyard impacted by coastal erosion on Pele Island in Vanuatu.
© Niki Kuautonga / Greenpeace

What is Greenpeace doing?

We’re going big this year, taking six members of our team to Palau to support Pacific leaders to hold the line, hold Australia accountable, and show the world what’s at stake. We’ll lobby leaders, hold press conferences, share our messages with the world, and support our incredible local partners in Palau.

Members of the Greenpeace Pacific team at the Pacific Islands Forum leaders' meeting in Palau, 2026.

How can you get involved?

PIF is the first in a drumbeat of major moments where we’ll be carrying the voices of the Pacific to the world. Come October we’ll be voyaging to Fiji on our ship Oceania for the Pacific Pre-COP, and in November we’ll be off to Antalya for the world’s climate negotiations (COP31).

Learn more about the Pacific way to a fossil fuel free future by checking out our report and exhibition.

Follow our journey, and check back here for more ways to join the movement for climate justice. Together we have the pawa!

Pawa in Palau

Continue Reading

Climate Change

From firefighting to future-proofing: Preventing wildfires must be the priority

Published

on

Gill Einhorn is head of the Forest Future Alliance and Natalie Çilem is community lead of the Global Wildfire Leadership Network.

Wildfires have devastated communities across the world this summer, claiming lives, displacing thousands of people and leaving billions in economic damage in their wake. In Europe alone, wildfires have already caused an estimated €19 billion in losses this year.

They are an economic, financial and public health challenge that is growing faster than many governments and markets are prepared for – and exposing the real costs of poor land management.

A system built for recovery, not resilience

Far more money is currently spent responding to the disastrous effects of wildfires than preventing them in the first place. The United Nations Environment Programme estimates that more than half of wildfire-related spending goes towards response, while planning receives only around 0.2 percent. This problem is not limited to wildfires; over 95 percent of disaster aid between 2005 and 2017 was allocated to response, and less than 4 percent was directed towards prevention or preparedness.

Forests are critical, but without investment in how land is managed and protected, their value is neither stable nor guaranteed. Protecting forests requires investing not only in conservation, but in the conditions that keep forests standing.

    Each dollar invested in wildfire-resistant construction could save around $210 in avoided future economic losses, according to a report by the World Economic Forum and Forest Future Alliance. Despite this evidence that prevention can significantly reduce future costs, wildfire resilience remains chronically underfunded.

    This spending discrepancy is creating significant challenges for insurers, asset owners and financial institutions. Global insured losses from natural catastrophes reached $107 billion in 2025, with wildfires, floods and storms accounting for 92 percent of claims.

    In this context, insurers are reassessing where and how they are willing to underwrite risk. Around 56 percent of global wildfire losses between 2000 and 2023 were uninsured. In some high-risk areas, insurers are scaling back coverage altogether, leaving homeowners, businesses and governments to shoulder a growing share of the costs – making it increasingly difficult to break even.

    Proven solutions are already paying off

    In many regions, wildfires are driven not by natural causes but by the deliberate clearing of land for agriculture. Degraded landscapes are becoming drier, more flammable and increasingly vulnerable to catastrophic loss, creating a vicious cycle of deforestation, economic damage and rising emissions.

    The answer is not simply stronger firefighting capacity. Governments, investors and businesses must work together to shift capital upstream into prevention, resilience and long-term landscape stewardship of healthy forests. That means planting appropriately, investing in heat-resistant species, exploring approaches that minimise fire footprints through active management, and exploring the AI and technology solutions that are burgeoning.

    A burnt olive tree in an area affected by a wildfire in Ano Sichaina near Patras, Greece, August 14, 2025. REUTERS/Louiza Vradi

    A burnt olive tree in an area affected by a wildfire in Ano Sichaina near Patras, Greece, August 14, 2025. REUTERS/Louiza Vradi

    Solutions to this already exist and are proven to have an impact. Following devastating wildfires year-on-year, Portugal shifted its approach to wildfire management, increasing prevention spending within its national rural fire management system from around 20 percent in 2017 to approximately 60 percent in 2022. While many countries remain locked in a reactive cycle of disaster response, public policy can shift investment upstream and make resilience a priority before fires occur.

    Indigenous communities have long used proactive land stewardship to reduce wildfire risk while supporting healthy and productive landscapes. For example, the Cheslatta Carrier Nation in British Columbia traditionally managed fuels through cultural fire practices but now implements mechanised fuel removal methods under commercial agreements. By combining Indigenous stewardship with sustainable forest management, Cheslatta is generating community benefits while also boosting wildfire prevention.

    Resilience can also be strengthened through finance and technology. FireSat, a partnership led by Earth Fire Alliance with Google.org, the Gordon and Betty Moore Foundation and Muon, is a satellite constellation designed for rapid wildfire detection. Scanning every 20 minutes, it can detect fires 400 times smaller than current systems and track them through smoke and darkness in almost real time. In California alone, FireSat could prevent up to 350,000 acres from burning each year. It has recently received significant new investments allowing it to expand towards a constellation of more than 50 satellites that will monitor every point on Earth every 20 minutes or less.

    In Brazil’s Pantanal, the Embrace the Forest initiative uses AI-powered detection towers across 2.5 million hectares to support earlier intervention and faster response. During the severe 2024 fire season, the initiative contributed to a 40 percent reduction in burned area compared to 2020.

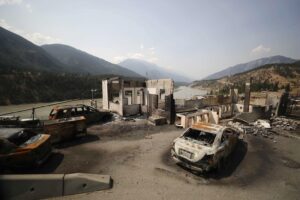
    A drone view shows burnt cars following a wildfire in Dymi, near Patras, Greece August 14, 2025. REUTERS/Louiza Vradi

    A drone view shows burnt cars following a wildfire in Dymi, near Patras, Greece August 14, 2025. REUTERS/Louiza Vradi

    These examples illustrate what is possible when resilience is treated as an investment priority rather than a recovery cost. But we must ensure funding for these measures is scaled before disaster strikes. Initiatives like the Global Wildfire Leadership Network (GWLN) are key, bringing together corporate decision-makers, investors, insurers, governments and Indigenous leaders to direct investment towards prevention and align finance, technology and stewardship to protect nature, safeguard communities and strengthen future economic stability. With a goal of doing more together than the sum of our parts, the network focuses on Forest Future Alliance GWLN Solutions Labs – where partners sign up with the intent to collaborate.

    Rewarding prevention

    Financial incentives must be created that reward prevention. This can be done by scaling public-private partnerships, supporting long-term landscape stewardship, investing in community capacity including Indigenous wisdom and technology. Ultimately, our terrestrial natural reserves are critical infrastructure that support resilient economies and thriving communities.

    One in three people are dependent on forest services, goods and economic opportunities for survival, so it’s in all our interests to protect what we have. Forests support cooling, water and food security – and are a very cost-effective way of removing carbon dioxide from the atmosphere, where done appropriately.

    UN chief warns climate crisis “in overdrive” as El Niño threatens to fuel the fire

    No sector can solve this challenge alone. The benefits of wildfire resilience are shared across communities, governments, insurers, investors, utilities and businesses. A single intervention can protect homes and livelihoods, reduce insurance claims, secure water supplies and lower future public costs. Because the benefits are shared, the solutions must be too. Coalitions of actors can take proven approaches further than any one individual or organisation could alone.

    As wildfires continue to burn at an unprecedented scale, the opportunity now is to roll out solutions, shift investment upstream and build a future where resilience, rather than recovery, becomes the foundation of thriving economies.

    The post From firefighting to future-proofing: Preventing wildfires must be the priority appeared first on Climate Home News.

    From firefighting to future-proofing: Preventing wildfires must be the priority

    Continue Reading

    Climate Change

    Guest post: Why tough methane cuts are crucial for keeping warming ‘well-below’ 2C

    Published

    on

    Methane is a powerful greenhouse gas and the second-largest contributor to global warming after carbon dioxide (CO2).

    Methane traps heat in the atmosphere more efficiently than CO2, but has a significantly shorter lifespan, fading after just a few decades.

    Therefore, reducing emissions of methane – a gas primarily produced by agriculture, fossil fuels and waste management – is a powerful option for limiting global warming in the near-term.

    Yet climate strategies and models often only focus on CO2, or combine all greenhouse gases into one metric known as “CO2 equivalent”.

    The latter approach makes reducing methane emissions dependent on modelling choices and assumptions about the “equivalence” of methane and CO2.

    It hides the opportunities and challenges linked to methane’s high warming and short lifetime.

    In a new study, published in Communications Earth & Environment, we offer a different perspective that “decouples” CO2 and methane reduction and takes global warming limits as a starting point for determining the required level of methane cuts.

    We show that, even under the most ambitious existing national net-zero targets, an absence of methane reduction leads to peak warming that exceeds 1.85C above pre-industrial levels.

    The study highlights that, to limit peak warming to well-below 2C, net-zero CO2 targets must be complemented by stringent methane emissions cuts.

    CO2 equivalent

    How much methane corresponds to one tonne of CO2?

    The question is as difficult to answer as: ‘how much spaghetti equals a chicken?’ You could compare the two meals according to their calories, protein content or cost. Each metric can be convenient, but is only valid for that specific comparison – no amount of spaghetti is the same as a chicken.

    The same is true for the conversion of emissions of methane and other gases to CO2-equivalent emissions. It can be convenient, as it allows different gases to be compared or combined into a single number. This is why the metric is used in climate targets or evaluating the effectiveness of different mitigation options.

    But, because methane and CO2 have different atmospheric lifetimes and warming properties, any conversion is only valid for a chosen time horizon and a chosen baseline.

    Depending on the assumptions baked into calculations, methane mitigation can either appear as an immediate priority or framed as almost unnecessary.

    There are a number of metrics that scientists use to convert greenhouse gases – whether methane, hydrofluorocarbons or nitrous oxide – into CO2-equivalent emissions:

    • “GWP20” measures how much heat a greenhouse gas traps in the atmosphere over a 20-year period, relative to CO2. It emphasises urgent methane mitigation but has been criticised for its implicit discounting of future damages.
    • “GWP100” looks at a 100-year timeline. It gives more weight to long-term warming and is used in “integrated assessment models” (IAMs) used by scientists, national emission reporting to the UN and by the GHG Protocol used by companies.
    • GWP*” considers the rate of emissions, rather than warming over a fixed time horizon. Under GWP*, very limited methane reductions bring CO2-equivalent emissions to zero, meaning remaining methane emissions can be designated as causing “no additional warming”. (This interpretation remains controversial as it assumes the continuation of historical levels of warming.)

    IAMs are the tools used to generate future emissions scenarios. Because they combine CO2 and methane emissions, the impact of methane emission cuts alone is difficult to isolate in existing emission scenarios.

    IAM-generated scenarios also assume mitigation decisions driven by costs. Combinations of CO2 and methane emission pathways that are not purely cost-effective are, therefore, not represented, even though climate policy is messy and emission pathways are rarely cost-effective in the real world.

    Only a few countries – including Japan, Mexico and South Korea – specify methane mitigation targets.

    A different approach

    In our study, we separate CO2 and methane emissions and treat them as independent.

    Instead of choosing a conversion method, we suggest that states and organisations set a limit on peak global warming first, then, based on their existing net-zero targets, determine the minimum compatible methane reduction target.

    Companies and countries around the world have set net-zero targets focused on CO2, as well as those that include all greenhouse gases. As a result, our research looks at the necessary methane reductions for both types of goal. We consider scenarios where companies or countries deliver linear – in other words, steady – emissions reductions to reach net-zero.

    Using a simple climate model, we systematically combined methane and CO2 (or greenhouse gas) mitigation pathways starting in 2025 and calculated peak warming.

    The figure below shows how peak warming depends on both the year of reaching net-zero CO2 and the level of methane cuts.

    Peak global warming relative to 1850-1900 reached until 2100 (50% likelihood), for combinations of the year of global net-zero CO2 emissions (x-axis) and the change in global methane (CH4) emissions between 2020 and that year (y-axis), assuming linear trajectories. Black lines are contours of equal peak warming. The three bars on the right show independent estimates of where CH4 emissions could or would land on the same vertical scale: CH4 mitigation available at no net cost (IEA, red), the 2030 mitigation potential (Global methane status report, orange), and the current legislation scenario for 2050 (Global methane status report, purple). Adapted from Weber et al. (2026).

    The blue arrows in the figure show that to limit warming to 1.7C under a 2050 net-zero CO2 scenario, methane emissions would need to fall by at least 69% by 2050, relative to 2020.

    Our research also finds that, if an organisation or country’s 2050 net zero-target covers all greenhouse gases, its methane emissions would need to fall by 63% instead.

    However, under current policies, methane emissions are expected to increase by around 20% by 2050, relative to 2020. We find that this pathway would result in peak warming above 2C by 2050 – even if global CO2 emissions were to reach net-zero by that date (see purple bar on the right-hand side of the figure above).

    The figure also shows how, if methane emissions remained at 2020 levels and net-zero CO2 was delivered by 2040 or later, warming would exceed 1.85C. This level of warming is above what has been argued as consistent with the Paris Agreement’s “well-below” 2C limit.

    Conversely, cutting methane emissions by around one-third – in line with the Global Methane Pledge target for 2030 – could reduce peak warming by 0.15C, of which 0.05C could be delivered by interventions that come at no net cost. These are shown by the orange and red bars, respectively, on the figure above.

    The table below highlights the minimum compatible methane cuts for three different peak warming levels and net-zero CO2 or greenhouse-gas emission targets.

    Peak warming Year of net-zero CO2 emissions Year of net-zero greenhouse-gas emissions
    2050 2060 2100 2050 2060 2100
    1.7C -69% -63%
    1.8C -32% -56% -11% -47%
    2C +8% -8% -83% >50% +33% -78%

    Minimum methane emission reductions between 2020 and the year of net-zero emissions, consistent with peak warming of 1.7C, 1.8C, and 2.0C at 50% likelihood, assuming linear emission trajectories. For some net-zero targets and peak warming levels, there are no compatible methane mitigation targets (indicated by “–”).

    Remaining carbon budget

    The global carbon budget refers to the amount of cumulative CO2 emissions allowable while still meeting a particular global warming threshold.

    The 2021 climate science report from the Intergovernmental Panel on Climate Change (IPCC) and a 2023 Nature study estimated that, by 2025, the remaining carbon budget for holding warming to 2C would be around 1,000-1,150bn tonnes of CO2 (GtCO2).

    We find that these estimates are founded on the assumption of methane reductions of 27-35% by 2050, relative to a 2020 baseline. (A 2024 Communications Earth & Environment study reached similar conclusions.)

    Under the GWP* metric, where methane emissions are only cut to maintain “no additional warming”, the remaining carbon budget would be constrained. The best estimate of a 2C budget shrinks by around 30% to approximately 750GtCO2.

    Finally, if methane emissions are not cut at all in the future, our findings suggest that the remaining carbon budget for 1.7C of global warming has, in effect, already been exhausted.

    Our analysis shows how peak warming depends on both CO2 and methane reduction – and how methane-specific targets can help refine existing net-zero targets.

    Crucially, we show that complementing net-zero CO2 targets with stringent methane cuts is necessary to limit peak warming to well-below 2C.

    Weber, K. et al. (2026) Limiting warming by CO2 and methane mitigation in an expanded scenario space, Communications Earth & Environment, doi:10.1038/s43247-026-03832-1

    The post Guest post: Why tough methane cuts are crucial for keeping warming ‘well-below’ 2C appeared first on Carbon Brief.

    Guest post: Why tough methane cuts are crucial for keeping warming ‘well-below’ 2C

    Continue Reading

    Trending

    Copyright © 2022 BreakingClimateChange.com