
The global shift towards a clean-energy system is much more than just a technological switch – it is a profound transformation of markets, industries and societal behaviours.
This complex undertaking is often characterised by “non-linearity” and “feedback loops”, where small changes can go on to have disproportionately large impacts and where seemingly straightforward paths encounter unexpected roadblocks.
Interventions can be self-amplifying – leading to runaway change, or they can be self-defeating – when progress seems impossible to attain.
Our new policy brief sheds light on these intricate dynamics, which can be overlooked when governments use analytical frameworks based on standard economic thinking.
The brief sets out the most common archetypes of system change and behaviour, as well as the underlying feedback loops that drive them, with the aim of helping policymakers to understand the recurring patterns that can either accelerate or impede progress.
Governments that can recognise these patterns – as well as the ways they can be harnessed or sidestepped – are likely to be better equipped to manage structural change.
This article delves into three key examples from the policy brief, exploring how they are influencing the energy transition and what lessons can be drawn for effective policymaking.
Reinforcing feedback loops
At the heart of the energy transition lies a powerful engine: the reinforcing feedback loops inherent in the development and diffusion of many clean-energy technologies.
This virtuous cycle operates through several mechanisms.
First, “learning by doing”, which means that as more units of a technology, such as solar panels or wind turbines, are produced and deployed, manufacturers and developers become more efficient, processes are refined and costs fall.
Second, economies of scale kick in: as production volumes increase, unit costs decrease due to efficiencies in manufacturing and more developed supply chains.
Finally, wider deployment can trigger network effects and the emergence of complementary innovations. This means that as the adoption of a given technology grows, it can foster an ecosystem of supporting infrastructure, skilled labour and supporting technologies, which can further boost its attractiveness and viability.
Together, these three elements create a powerful reinforcing loop: initial investment drives innovation and cost reduction, which spurs increased demand, attracting further investment.
Solar photovoltaics (PV) and wind turbines are prime examples of this dynamic.
The astonishing growth of solar offers a particularly vivid illustration of the way in which reinforcing feedback loops can blindside experts and policymakers alike.
Solar growth has far exceeded projections made in the early 2000s. Indeed, the world’s actual installed capacity in 2020 was over 700 gigawatts (GW), more than ten times the level expected in outlooks published in 2006, as shown in the figure below.
Global solar deployment has exceeded expectations due to disparate trends and drivers in individual markets that, together, all point in the same direction. China, for instance, met its 2030 target for wind and solar capacity six years ahead of schedule in 2024.
Batteries are also riding this wave, with costs plummeting by around 85% over the past decade as deployment, particularly in road transport, scales up.
However, not all clean-energy technologies benefit from this self-amplifying pattern.
Nuclear power and hydropower, for example, have historically not shown the same rapid cost declines, due to their large, complex and site-specific nature. This contrasts with the smaller, modular and replicable characteristics of technologies, such as solar PV.
This does not negate the potential role of such technologies, but it does mean that they are less likely to see disruptive, exponential and self-reinforcing growth.
There are a number of potential conclusions for policymakers.
Early in the transition, interventions such as feed-in tariffs and public procurement were crucial in kick-starting these reinforcing feedbacks for solar and wind.
As these technologies mature and become cost-competitive, the focus shifts to removing other barriers, such as streamlining permitting processes, investing in grid expansion and reforming markets so they are better able to integrate variable renewable output.
These same principles could now be applied to newly emergent clean-energy technologies. Policies that directly nurture these reinforcing loops, such as deployment subsidies and clean technology mandates, can be expected to be most effective in the initial stages.
Turning again to the example of solar energy, while such initial efforts appeared to be expensive, they paid off over time by unlocking future cost reductions and, thus, kick-starting the self-amplifying feedback loops that are now driving further progress.
This contrasts with the idea that carbon pricing is necessarily the most efficient policy for decarbonisation. It may well be helpful, but as it will not drive rapid early technology adoption, it is less likely to have a self-amplifying effect in the initial stages of the transition.
Renewable ‘cannibalisation’
While the growth of renewable energy is the driving force of the energy transition, another system dynamic, termed “renewable cannibalisation“, can act as a dampening feedback loop. This can potentially slow progress long before full decarbonisation is achieved
This cannibalisation process results in variable renewable energy (VRE) sources, such as solar and wind, receiving decreasing prices for the electricity they generate.
Essentially, the more solar and wind capacity that is connected to the grid, the more they undermine their own revenue. This happens through three main channels.
First, the merit order effect, whereby solar and wind, which have very low operating costs, push more expensive fossil-fuel generators out of the market when supply is abundant.
In markets with marginal pricing, this leads to lower wholesale electricity prices during periods of high renewable output. While this cuts prices for consumers – at least in the short term – these lower prices also reduce revenues for renewable generators, potentially undermining the economic case for further investment.
For example, in California, solar power unit revenues fell by $1.30 per megawatt hour (MWh) for each percentage point increase in solar penetration between 2013 and 2017.
Second, price volatility, where uncertainty over future trends in the generation mix and the balance between supply and demand can make long-term revenues difficult to predict.
This increased uncertainty can raise the cost of capital for new renewable projects, again acting as a brake on investment
The UK, for example, experienced this before the introduction of “contracts for difference” (CfDs), which helped stabilise revenue expectations for renewable developers.
Third, volume risk, where rising VRE capacity increases the likelihood of more frequent curtailment – periods when renewable generation exceeds demand or grid capacity, forcing generators to scale back output and lose potential revenue.
Curtailment in itself is nothing new, but the scale and frequency is changing. Recent analysis by University College London suggests that without significant flexibility or storage, UK renewable generation could exceed demand for more than 50% of the time by 2030.
The analysis found that installed wind and solar capacity is set to surge beyond current levels of electricity demand, as illustrated in the figure below, finding that this could “deter investment” in new projects if no action is taken to address the problem.

These dampening feedback loops illustrate a classic “limits to success” scenario. The very success of renewables, if unmanaged, can create conditions that hinder their continued expansion.
The policy implications here are nuanced. One solution is CfDs, which offer renewable generators a fixed price and have been effective in many countries at mitigating the merit order effect and price volatility, thus maintaining investment.
However, as VRE penetration becomes very high and surplus generation becomes a regular occurrence, other solutions are likely to be needed. This is because existing CfD designs often include clauses that stop payments when market prices drop below zero.
As a result, alternative CfD designs, guaranteeing revenues based on installed capacity or potential – rather than actual – electricity generation might be considered, for example, even though these have other drawbacks.
More fundamentally, our research suggests the solution to this challenge lies in fostering the co-evolution of renewables with technologies such as energy storage and green hydrogen production. These can absorb surplus generation and turn a problem into an opportunity.
Whereas, traditionally, it might be assumed that the market on its own can optimally allocate risk, research suggests that a redesign of market structures may be needed to enable investment and fully realise the cost-saving opportunities of the new technologies.
This is one of several sets of feedbacks discussed in a separate new report published today, looking at the power sector transition in China.
The power of connection
The energy transition is not a series of isolated changes in different sectors. Instead, it is an interconnected system, where progress in one area can catalyse shifts elsewhere. Shared technologies can create reinforcing feedbacks that accelerate decarbonisation across multiple fronts, generating cross-sector synergies.
The relationship between clean power and transport electrification is a powerful example of this. As batteries are deployed at scale in electric vehicles (EVs), their costs fall, enabling ever-wider deployment and further cost declines, as shown in the chart below.
This is due to the learning-by-doing and economies-of-scale feedbacks discussed above.
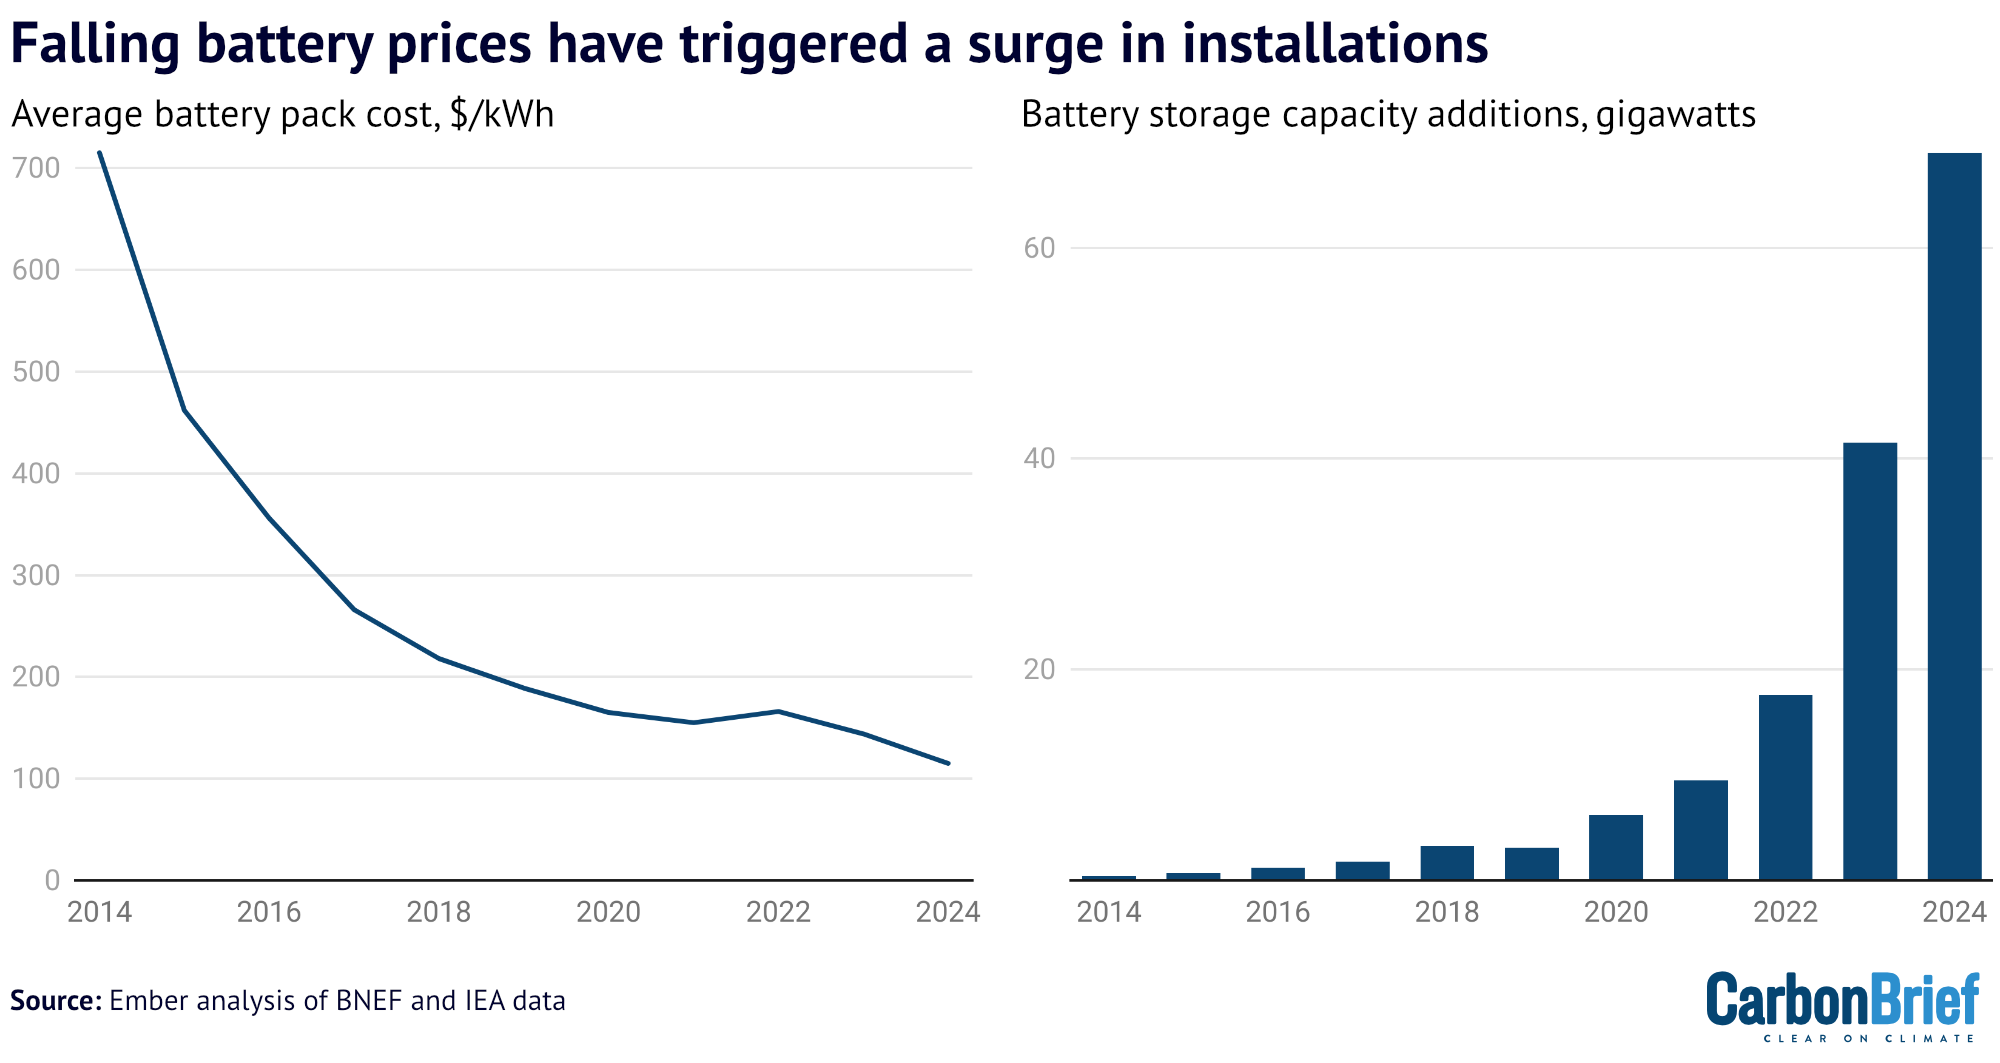
This cost reduction then makes batteries more viable for grid-scale energy storage, which, in tur, helps integrate more low-cost VRE into the power system.
Cheaper, cleaner electricity then further incentivises the electrification of transport, as well as heating and light industry. This increased electrification boosts demand for renewable power, driving further deployment and cost reductions in solar and wind. It also expands the potential for demand-side response, where consumers adjust their electricity use to help balance the grid.
A similar dynamic is anticipated for “green” hydrogen. As deployment in one anchor sector – perhaps fertilisers or refining – drives down the cost of electrolysers, it makes green hydrogen more competitive for other applications, such as shipping or even long-duration energy storage in the power sector.
Each sector’s adoption of green hydrogen contributes to the shared learning and cost reduction, benefiting all.
The policy implications of these cross-sector synergies could be significant. Their existence suggests, for example, that there is no need to wait for decarbonisation of the power sector to advance further, before beginning the electrification of transport, heating or industry.
This is in contrast to the argument that transport should only be electrified after cutting power sector emissions, since increased EV charging will drive up demand for gas- or coal-fired generation.
While there will be a marginal increase in emissions from plugging a new EV into the power grid, the insights described in our brief imply that it is still likely to be more effective to pursue the transition away from fossil fuels in multiple sectors in parallel, because it can activate beneficial cross-sector feedback loops that are greater than the sum of their parts.
As such, our research suggests that policymakers hoping to take advantage of cross-sector synergies could aim to deliberately strengthen technological linkages between different parts of the energy system. Examples include electricity tariffs and market structures that reward “smart” EV charging and vehicle-to-grid (V2G) services, encouraging industrial participation in demand-side response and promoting integrated home energy systems. These interactions can amplify the benefits of early investment in the transition.
Policy insights from system dynamics
Archetypes such as the self-reinforcing growth of clean technologies, the potential for renewable cannibalisation, the accelerating power of cross-sector synergies and seven others described in our new report paint a picture of a transition that is far from linear. Instead, we find that it is governed by complex interdependencies and feedback loops.
Consequently, our research suggests that policymakers will be much better equipped to manage and steer the transition, if they adopt a systems thinking approach.
Recognising these recurring patterns allows for the design of more robust and effective policies that anticipate challenges and leverage opportunities.
For instance, understanding the power of reinforcing feedback loops in technology diffusion underscores the value of early-stage support for nascent clean-energy technologies.
Conversely, anticipating the dampening effects of renewable cannibalisation highlights the likely benefits of combining renewable buildout with evolving market designs and strategic investments in flexibility solutions, such as storage and demand-side response.
Policymakers that understand and work with these dynamics are likely to be in a better position to spark self-amplifying changes – achieving maximum value for minimum effort – and to avoid self-defeating interventions that go nowhere.


The post Guest post: How ‘feedback loops’ and ‘non-linear thinking’ can inform climate policy appeared first on Carbon Brief.
Guest post: How ‘feedback loops’ and ‘non-linear thinking’ can inform climate policy
The UK has abandoned projects worth tens of millions of pounds that were meant to help protect Congo rainforests and support local people.
Together, these initiatives would have made up around half of the £200m that the UK pledged to support conservation in the Congo basin – the world’s second-largest rainforest.
When it hosted COP26 in Glasgow, the UK led a new initiative to end forest loss, which included a collective pledge by 12 donors of “at least” $1.5bn (£1.1bn) for Congo rainforest nations by 2025.
Development minister Jenny Chapman revealed last week that, as of 2024, the UK had only provided £39.8m towards this goal.
Alongside the US and much of Europe, the UK has significantly cut its aid budget in recent years, leading to much of its Congo rainforest spending being cancelled or reappraised.
The government says it still plans to “prioritise” rainforest regions, including the Congo basin, but civil society groups and MPs are concerned about the lack of “ring-fenced” forest funding in the UK’s new aid strategy.
COP pledge
At COP26, the UK – led by then prime minister Boris Johnson – launched the “Glasgow leaders’ declaration”, with a goal to “halt and reverse forest loss” by 2030. This was backed by more than 140 nations.
The UK also made various funding pledges, including £200m to protect the Congo basin, £350m for tropical forests in Indonesia and “up to £300m” for the Amazon.
These commitments target the world’s three largest rainforests, all of which face major forest loss due to threats such as agriculture, logging and climate change.
The Congo basin is the planet’s largest forested carbon sink. Yet, its six host nations are among the poorest in the world and face significant funding barriers.
This has global ramifications. An official UK assessment warned that “degradation or collapse” of the Amazon or Congo rainforests “threaten UK national security and prosperity”.
Forest cuts
Following successive aid cuts introduced by both the Conservative and then Labour governments – tracking a global trend – the UK’s Congo funding is under threat.
The Congo basin forest action programme (CBFA) was launched by the UK at COP27. It was explicitly set up to provide “roughly half” of the UK’s £200m Congo pledge.
CBFA set out to “empower central African nations”, such as the Democratic Republic of the Congo (DRC), with support for “community forests” and other measures to curb forest loss.
Now, after reporting delays, the UK has slashed the CBFA as part of the Labour government’s recent aid cuts, intended to free up money for defence spending.
Its original £90m budget has now been reduced to £18.8m. Government data shows that £15m of this has already been spent.
This is not the only Congo project that has been dropped due to this latest round of aid cuts.
The Congo part of the biodiverse landscapes fund – championed by the previous government and worth at least £12.3m – has been closed, just two years into its seven-year schedule.
Government documents reveal more Congo forest funding is at risk as the UK scales back its aid budget, including the UK’s two largest remaining projects in the region.
One initiative, intended to “incubate forest-friendly enterprises” in DRC, faces “reduc[ed] budgets”. Officials working on the other, while more optimistic, reported that the project may be forced to operate in fewer countries as the cuts set in.
Documents also reveal the difficulties that come when operating in the Congo, including “complex political economies” and, in Gabon, a military coup – which “complicated matters”.
‘Breaking promises’
Damian Fleming, a senior director of forests at WWF International tells Carbon Brief:
“Tropical forest countries are making long-term policy and development choices in expectation that international partners will honour their commitments.”
In a series of recent parliamentary responses, Chapman revealed that the UK had only spent £39.8m on Congo forest finance, as of 2024. (She declined to provide any information on the Indonesia and Amazon regional goals.)
Despite being presented as the UK’s “contribution” to the £1.1bn-by-2025 global goal agreed at COP26, the £200m target has a deadline of 2029.
Therefore, while the collective goal has been met, the UK’s contribution so far has been relatively small.
Zac Goldsmith, a former Conservative minister who oversaw the forest targets at COP26, tells Carbon Brief that, in his view, the UK has “discarded” its regional pledges:
“We have gone from being perhaps the leader on protecting nature internationally to breaking promises to countries around the world for whom the environment is an existential issue.”
Future targets
The Labour government says it has met the five-year “climate finance” target of £11.6bn that expires this year.
Ministers also say the government has met “and exceeded” the £3bn and £1.5bn sub-goals for “preserving nature” and forests, respectively, within the £11.6bn. These are the funding streams that include support for the Congo basin and other rainforests.
The UK has funded a variety of projects in line with its forest goals, including mangrove restoration in Indonesia, support for carbon-offsetting projects in Brazil and promoting “forest stewardship” among farmers in Cameroon.
Chapman has stated that the UK will continue to “prioritise” the Congo rainforest, in line with its new plan for aid spending in Africa. The UK even helped to launch a new “call to action” for Congo basin funding at COP30 last year.
The UK government also says it supported the creation of Brazil’s flagship “Tropical Forest Forever Facility” (TFFF). However, so far it has not provided any funding for the facility.
When the government announced a new climate finance pledge for 2026 onwards, it stressed that nature would still be a “focus” and said it would also generate billions in “climate and nature positive investments”. Nevertheless, it dropped the “ring-fenced” amounts for nature and forests that had appeared in its previous pledge.
The UK, alongside other developed countries, has pledged to provide biodiversity finance to developing countries, under the Kunming-Montreal Global Biodiversity Framework (GBF) – a non-binding global pact to halt and reverse nature loss by 2030.
Sarah Champion, chair of the international development committee of MPs, says “sub-pledges” for nature and forests are a “cost-effective and impactful” way to ensure this finance is provided, alongside climate finance. She tells Carbon Brief that she was “concerned” about the move away from this approach:
“When the minister recently appeared before the international development committee, I was concerned to hear her characterise this shift as a ‘gamble’.”
A government spokesperson tells Carbon Brief:
“We remain committed to providing finance for forests, including in the Congo basin, as a core element of our overall climate funding.”
A shorter version of this article was first published in Cropped, Carbon Brief’s fortnightly newsletter that provides a digest of food, land and nature news, on 15 July 2026. Subscribe for free.


The post UK withdraws millions in funding from world’s second-largest rainforest in Congo appeared first on Carbon Brief.
UK withdraws millions in funding from world’s second-largest rainforest in Congo
Climate Change
Cropped 15 July 2026: Uganda starves | Trump opens endangered habitats | UK cuts rainforest aid
We handpick and explain the most important stories at the intersection of climate, land, food and nature over the past fortnight.
This is an online version of Carbon Brief’s fortnightly Cropped email newsletter.
Subscribe for free here.
Key developments
Global drought and heat
DRY THEN WET: A recent heatwave and months of low rainfall has led to a prolonged drought for Uganda, resulting in at least 16 deaths from hunger and significant crop losses, reported BBC News. Bastille Post Global suggested that “a developing El Niño later this year could bring heavier rainfall to parts of the region, raising the risk of flooding in areas now struggling with drought”.
FUNDING FOOD: The UN Food and Agriculture Organization (FAO) and the World Food Programme (WFP) have appealed for $200m in funding to help African nations deal with the impact of El Niño, stated Deutsche Welle. This would target 22 high-risk countries with measures, including “cash transfers, climate-resilient seeds, livestock protection and flood control.” The Guardian explained how El Niño could still “cause a severe shock to global food prices lasting into 2028”.
FARMING FEARS: Extreme weather has devastated agriculture across the world. India saw its driest June in 12 years, reported BBC News, and France has had a “double-digit production” decline, according to Le Monde. The Financial Times reported that farmers in the UK are mitigating the impacts of extreme heat by eliminating “chemicals and intensive ploughing to improve soil quality so it retains water”.
EURO FIRES: Wildfires have spread across Europe, with Spain reporting at least 12 deaths so far, according to the Guardian, and France experiencing road closures, said Reuters. Wildfire Today reported that the most extreme conditions are “across France, Spain and northern Portugal, the Alpine arc extending into northern Italy, the south of the UK and south-east Ireland”. CNN explained how “the climate crisis is driving hotter, drier weather, which is setting the stage for fiercer fire seasons”.
Endangering species
REDEFINING HARM: The Trump administration “reversed decades of longstanding environmental law protecting endangered species…opening up sensitive habitats…to drilling, mining, farming and real estate development”, reported CNN. According to the story, the change “redefines what constitutes ‘harm’” to endangered species, which historically prohibited habitat modification or degradation. Agence France-Presse reported that US environmental groups sued the Trump government over the move, arguing that it had violated “common sense, biological science and federal law”.
OPEN SEASON: Reuters reported that the change “limits the reach of the 50-year-old Endangered Species Act” (ESA), which is a “key regulatory consideration” when granting permits for “oil and gas, mining, electric transmission and other operations on federal lands and water”. Legal scholars told the New York Times the US government “was acting without conducting scientific research into the impact” of the change, while the National Mining Association “applauded the announcement”.
News and views
- INTERNATIONAL WATERS: After a significant delay, the UK ratified the Biodiversity Beyond National Jurisdiction Agreement (BBNJ), also known as the High Seas Treaty. Oceanographic detailed how this will allow for “marine protected areas across international waters for the first time”, but also stressed that the “hard part” starts now.
- SCOPE-FREE: The world’s largest meat supplier JBS “scrapped a key climate goal” in its net-zero plan that accounts for its suppliers’ emissions, “which make up the vast bulk of the company’s environmental footprint”, reported the Financial Times. The company told the paper it was difficult to control these “indirect” emissions.
- DEEP TROUBLE: Pacific gray whales are facing a “catastrophic die-off” as sea-ice loss threatens their food sources, said the Guardian. Separately, conservationists warned that more than half of all molluscs that “cluster around underwater vents” could face extinction from deep-sea mining, reported Reuters.
- ETHANOL PUSHBACK: India’s new rules to promote 100% ethanol fuel and make ethanol-blended fuel mandatory at pumps “triggered a political row”, reported the Times of India. While the Indian government defended the push to automobile owners, a Hindu editorial and an Indian Express comment warned against incentivising fuels made from “water-intensive” sugarcane and rice.
- AMAZON ACTION: Deforestation in the Brazilian Amazon fell to its lowest level in a decade, but president Lula’s plans to “end illegal deforestation by 2030” could be hampered if he is not re-elected, reported Al Jazeera. Meanwhile, Colombia’s outgoing environment minister warned of greater environmental and climate risk under the incoming government, said the Associated Press.
- WAR WORRIES: The International Energy Agency (IEA) warned of the impact of the Iran war on Africa’s clean cooking efforts as disruption in the strait of Hormuz has stunted supplies and increased prices of liquefied petroleum gas (LPG), explained Climate Home News.
Spotlight
UK ‘discards’ Congo rainforest funding
Amid worldwide cuts to aid spending, Carbon Brief explores how the UK is backtracking on funding for the Congo basin – the world’s second-largest rainforest.
The UK has abandoned projects worth tens of millions of pounds that were meant to help protect Congo rainforests and support local people.
Together, these initiatives would have made up half of the £200m that the UK pledged to support forest conservation in the Congo basin.
When it hosted COP26 in Glasgow, the UK led a new initiative to end forest loss, which included a collective pledge of “at least” $1.5bn (£1.1bn) for Congo rainforest nations by 2025.
Development minister Jenny Chapman revealed last week that, as of 2024, the UK had only provided £39.8m towards this goal.
COP pledge
At COP26, the UK – led by then prime minister Boris Johnson – launched the “Glasgow leaders’ declaration”, with a goal to “halt and reverse forest loss” by 2030.
The UK also made various regional funding pledges, including £200m for the Congo basin, £350m for tropical forests in Indonesia and “up to £300m” for the Amazon.
All of these rainforests face major forest loss. The Congo basin is the planet’s largest forested carbon sink, but its six host nations are among the poorest in the world and face significant funding barriers.
This has global ramifications. An official UK assessment warned that “degradation or collapse” of the Amazon or Congo rainforests “threaten UK national security and prosperity”.

Forest cuts
Following successive aid cuts introduced by both Conservative and Labour governments – tracking a global trend – the UK’s Congo funding is under threat.
The Congo basin forest action programme (CBFA) was explicitly set up to provide “roughly half” of the UK’s £200m Congo pledge.
Now, after reporting delays, the UK has slashed the CBFA as part of the Labour government’s aid cuts. Its £90m budget has been “quietly reduced by 79% to £18.8m”, according to the Times.
This is not the only Congo project that has been dropped due to aid cuts. The Congo part of the biodiverse landscapes fund – worth at least £12.3m – has closed five years early.
Official documents reveal more Congo forest funding is at risk, including the UK’s two largest remaining projects in the region. One initiative, intended to “incubate forest-friendly enterprises” in DRC, faces “reduc[ed] budgets”.
Documents also show the difficulties operating in the Congo, including “complex political economies” and, in Gabon, a military coup – which “complicated matters”.
‘Breaking promises’
Damian Fleming, a senior forests director at WWF International told Carbon Brief:
“Tropical forest countries are making long-term policy and development choices in expectation that international partners will honour their commitments.”
In a parliamentary response, Chapman said that the UK had spent £39.8m towards its £200m Congo target, as of 2024.
Despite being described as the UK’s contribution to the £1.1bn-by-2025 global goal agreed at COP26, the £200m target has a deadline of 2029. Therefore, while the collective goal has been met, the UK’s contribution was relatively small.
Zac Goldsmith, a former Conservative minister who oversaw the forest targets at COP26, told Carbon Brief that, in his view, the UK has “discarded” its regional pledges:
“We have gone from being perhaps the leader on protecting nature internationally to breaking promises to countries around the world.”
The Labour government says it has met its overarching “climate finance” goals and still intends to “prioritise” the Congo rainforest.
However, civil society groups and MPs are concerned about the lack of “ring-fenced” forest funding in the UK’s new aid strategy.
Watch, read, listen
TOXIC TROUBLES: DeSmog unpacked a new report that said Northern Ireland is being turned into a “toxic” pig and poultry farming “sacrifice zone” to satiate the UK’s meat appetite.
NEED TO NOAA: Laid-off scientists from the US’s National Oceanic and Atmospheric Administration (NOAA) launched Climate.Us – an independent, public-backed version of the climate information website shut down by Trump last year.
DRY FRUIT: A Dialogue Earth long read looked at how climate change is impacting apricot harvests in the “stark, high-altitude desert” region of Ladakh, India.
READING ALOUD: A London Review of Books podcast discussed Robin Wall Kimmerer’s influential book “Braiding Sweetgrass”, weighing its compelling themes and where it veers into “scientific overreach”.
New science
- Climate change could cause Indigenous peoples in the Amazon to lose 28-34% of their plant species and 18-23% of their associated services | Nature
- Biodiversity in forests can act as a “buffer” against compound extreme weather events | Nature Communications
- Zero-deforestation commitments in Indonesia’s palm oil sector have had “no additional impacts” on reducing forest loss | Proceedings of the National Academy of Sciences
In the diary
- 7-15 July: High-level political forum on sustainable development | New York City
- 13-31 July: Meeting of the International Seabed Authority assembly and council | Kingston, Jamaica
- 16 July: International Energy Agency critical minerals outlook 2026, online
- 27 July-1 August: Scientific and technical subsidiary body meeting of the UN Convention on Biological Diversity | Nairobi, Kenya
This edition of Cropped was written by Jess Milligan, Josh Gabbatiss and Aruna Chandrasekhar. Cropped is edited by Dr Giuliana Viglione. This edition was edited by Daisy Dunne. Please send tips and feedback to cropped@carbonbrief.org.

The post Cropped 15 July 2026: Uganda starves | Trump opens endangered habitats | UK cuts rainforest aid appeared first on Carbon Brief.
Cropped 15 July 2026: Uganda starves | Trump opens endangered habitats | UK cuts rainforest aid
Climate Change
Campaigners oppose Dangote’s planned Kenya refinery over climate and ecological risks
Climate and environment campaigners have urged the Kenyan government to halt plans for a proposed 700,000-barrel-per-day oil refinery backed by Africa’s richest man, Aliko Dangote, warning the project threatens one of East Africa’s most ecologically sensitive coastlines.
The refinery, which is planned to be situated in Lamu County on Kenya’s northern coast, will be East Africa’s largest refining project and is expected to take up to three years to build. Once finished, it would supply refined petroleum products to Kenya, Uganda, Tanzania and Rwanda, among others, helping to reduce the region’s dependence on imported fuels.
Campaigners are questioning the viability of such a large refinery at a time when renewable energy and electric transportation are expanding rapidly.
Mohamed Adow, director of a Kenya-based climate and energy think-tank Power Shift Africa, said the decision to give Dangote the green light for the refinery is “an extraordinary act of environmental recklessness and economic short-sightedness”, arguing it would tie Kenya to “yesterday’s energy system” just as global demand for petroleum products faces increasing uncertainty.
-
Nigeria gives fossil gas a bigger role as “transition fuel” in climate plan
Officials say the country needs time and money to ramp up renewables, but critics say betting on gas is a risky strategy that could prolong the “oil curse” -
Gas flaring soars in Niger Delta post-Shell, afflicting communities
Since the multinational sold its assets in Nigeria’s oil hub, data analysis for Climate Home News shows flaring has risen, harming locals and the climate


Campaigners argue the refinery risks coming online just as transport – the largest market for petrol and diesel – is beginning to electrify across the continent.
Kenya launched a National Electric Mobility Policy earlier this year to speed up the uptake of electric vehicles (EVs) and reduce the country’s roughly $5 billion annual fuel import bill. Ethiopia has already banned imports of non-electric vehicles and now has more than 100,000 EVs on its roads, while Rwanda is expanding its electric mobility programme with plans to convert its fleet of around 100,000 motorcycles to electric.
Adow said the project risks billions of dollars in investment in infrastructure that could become obsolete as the world moves away from oil.
“Building a refinery today assumes decades of robust demand for fuels that much of the world is actively trying to phase out,” he said in a statement.
Ecological concerns
Lamu – the proposed site for the project – is home to the UNESCO World Heritage-listed Lamu Old Town and an archipelago containing extensive mangrove forests, coral reefs and seagrass beds that support fisheries, tourism and coastal livelihoods.
Locating the refinery in Lamu would “place one of Africa’s largest fossil fuel developments in one of the continent’s most ecologically sensitive and culturally significant coastal regions,” Power Shift Africa said.
Major emitting countries knew of climate risks decades earlier than claimed
Sherelee Odayar, oil and gas campaigner at Greenpeace Africa, warned that a refinery of this scale could increase the risk of habitat destruction, marine pollution, oil spills and air pollution in one of East Africa’s most fragile coastal ecosystems.
She said the risks stem not only from the refinery itself – including storage tanks, pipelines and fuel handling facilities – but also from the large volumes of crude oil that would need to be shipped into Lamu and refined products exported by sea. Increased tanker traffic and fuel transfers, she said, would raise the likelihood of accidents in ecologically sensitive coastal waters.
Odayar added that Lamu’s low-lying, flood-prone coastline could compound those risks by damaging infrastructure and carrying contaminants from storage facilities into nearby fishing grounds and marine ecosystems.
“Lamu’s mangroves, coral reefs and seagrass beds are not expendable; they support fisheries, livelihoods and coastal protection,” Odayar added.
She said Kenyan authorities should suspend any approvals until an independent environmental and social impact assessment is completed, with genuine public participation and transparent scrutiny of the long-term economic, health and ecological risks.
“Any review must assess cumulative impacts on Lamu’s mangroves, coral reefs, seagrass beds and fishing livelihoods, alongside the wider economic risk of locking Kenya into costly fossil fuel infrastructure as the global energy transition accelerates”.
Dangote Group declined to answer questions from Climate Home News when contacted by phone.
Technological change threaten project’s future
The Kenya refinery would replicate Dangote’s 650,000-barrel-per-day refinery in Lagos, currently Africa’s largest, which has plans to more than double capacity to 1.4 million barrels per day by 2028.
Adow of Power Shift Africa said projects like this represent “a breathtaking failure to recognise where the global economy is heading”, pointing out that the East African refinery risks arriving when Africa is experiencing an unprecedented clean energy boom.
Referencing Africa’s solar boom, global electric vehicles uptake and the International Energy Agency’s projection that global oil demand is set to enter a decline later this decade, the think-tank founder said African governments risk anchoring the continent’s future to an industry facing mounting economic uncertainty.
Loss and damage fund delays first project approvals as needs dwarf resources
The organisation said the project faces a bigger threat aside from environmental opposition and that is technological change. “The danger is not simply that the refinery will pollute, it is that it will become obsolete long before it has paid for itself,” he added.
Kenyan President William Ruto said the project will create about 60,000 jobs for Kenyans and supply refined fuel to eight East and Central African countries.
GreenPeace Africa’s Odayar said the promise of ‘thousands of jobs’ cannot be used to hide the true cost of the investment which is that large fossil fuel projects often create temporary jobs while undermining existing livelihoods in fishing, tourism and small-scale local economies.
“The enormous capital required for a project of this scale could instead help accelerate Kenya’s renewable energy future through solar, wind, geothermal, storage and better energy access,” she added.
The post Campaigners oppose Dangote’s planned Kenya refinery over climate and ecological risks appeared first on Climate Home News.
Campaigners oppose Dangote’s planned Kenya refinery over climate and ecological risks


-
Climate Change11 months ago
Guest post: Why China is still building new coal – and when it might stop
-
Greenhouse Gases11 months ago
Guest post: Why China is still building new coal – and when it might stop
-

 Greenhouse Gases2 years ago
嘉宾来稿:满足中国增长的用电需求 光伏加储能“比新建煤电更实惠”
-

 Climate Change2 years ago
嘉宾来稿:满足中国增长的用电需求 光伏加储能“比新建煤电更实惠”
-
Climate Change2 years ago
Bill Discounting Climate Change in Florida’s Energy Policy Awaits DeSantis’ Approval
-

 Renewable Energy9 months ago
Sending Progressive Philanthropist George Soros to Prison?
-

 Carbon Footprint2 years ago
US SEC’s Climate Disclosure Rules Spur Renewed Interest in Carbon Credits
-
Greenhouse Gases1 year ago
嘉宾来稿:探究火山喷发如何影响气候预测