The overlapping crises of extreme heat and Covid-19 “severely stretched” an already overwhelmed healthcare system in the UK with “deadly consequences”, a new study finds.
The research, published in Nature Climate Change, estimates the number of heat- and cold-related deaths in England and Wales before and during the Covid-19 pandemic.
The study finds that pressure on the health system during heatwaves was as much as three times higher for the pandemic years than it was in the previous decade. The authors find a similar result during cold periods.
The number of heat-related deaths “shifted higher” in the Covid-19 years, the study says, suggesting that Covid “may have impacted temperature-related mortality during extreme weather events”.
The authors warn that “if health services are already operating at capacity because of one crisis, the additional health burden from another crisis can break the system entirely, endangering the lives of many people”.
One expert not involved in the study tells Carbon Brief that any future pandemic is likely to be a “syndemic”, where its impacts intertwine with those of a changing climate.
And as similar groups tend to be most vulnerable to both major disease outbreaks and extreme weather, anticipating and preparing for the co-occurrence of such events “would be lifesaving”, the study authors conclude.
Heat, cold and Covid
Extreme weather events and pandemics are among the most serious risks facing the UK, according to the UK National Risk Register. Since 2020, both have claimed thousands of lives in the UK.
Between the UK’s first documented Covid-19 case on 30 January 2020 and the end of 2022, around 190,000 people in England and Wales died of the virus, according to death certificates.
Over this two-year study period, the UK has also seen extreme hot and cold temperatures – from the coldest UK temperature in more than 20 years during February 2021 to the country’s first recorded instance of 40C heat in July 2022.
To assess the link between temperature and mortality, the authors produced “epidemiological models” that analyse exposure to different temperatures and human mortality in different regions of the UK.
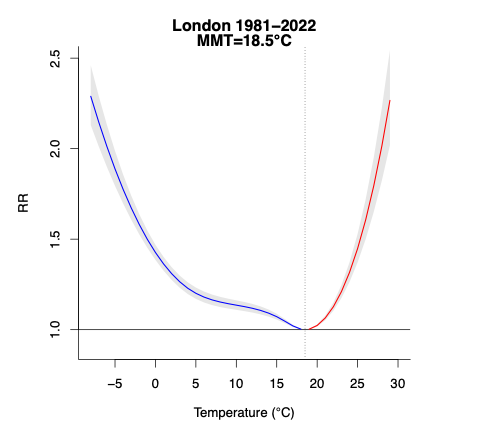
Dr Eunice Lo is a research fellow in climate change and health at the University of Bristol and lead author on the study. She tells Carbon Brief that “heatstroke and heat exhaustion can occur quite rapidly” and that, in her models, “we expect the mortality outcome to be within three days of exposure to heat”. In contrast, it takes longer for cold snaps to cause mortality, she adds.
The plot below illustrates the example of London. The lowest point on the curve – indicated by a “relative risk” level of one – shows the optimum temperature, when people are at lowest risk of physiological harm from temperature extremes.
If the temperature rises above (red) or falls below (blue) the optimum temperature, the risk of temperature-related mortality increases. This is indicated by a relative risk level greater than one.
Cumulative relative risk of death in London for the overall population, using data from 1981-2022. Source: Lo et al (2024).
The authors developed a series of models for locations across England and Wales. The study estimates that, over the study period, almost 8,500 excess deaths were attributable to high temperatures and more than 125,000 deaths to cold.
The study points out that cold-related deaths are more common in the UK as “most days of the year are considered moderately cold”. As the planet continues to warm, heat-related deaths are expected to rise, while cold-related deaths will likely fall.
Lo tells Carbon Brief that factors including age and socioeconomic status also affect temperature-related mortality, but these were not included in the model.
Extreme temperatures
The chart below, from the study, shows a timeseries of daily deaths attributable to heat (red), cold (blue) and Covid-19 (purple) in England and Wales over the study period. The black line shows deaths in the UK from all causes. The right-hand section of the chart focuses on the July 2022 heatwave, when daily heat-related mortality peaked at 580 deaths – higher than at any time of over the previous decade.
Daily deaths attributable to heat (red), cold (blue) and Covid-19 (purple) between 30 January 2020 to 31 December 2022 in England and Wales. The black line shows deaths in the UK from all causes. Source: Lo et al (2024).
Annual “all-cause mortality” in England and Wales was higher during the pandemic than it was in the preceding decade, as Covid-19 drove up mortality rates, the study finds.
The authors note that cold-related mortality “dominated” heat-related mortality in all months other than July, August and September – adding that spikes in cold-related mortality often coincided with spikes in deaths due to Covid.
There are a range of reasons for this. For example, low humidity in winter allows droplets containing the virus to spread further. And peoples’ immune systems are weaker in the winter due to a lack of vitamin D, making them more vulnerable to the virus.
The study also notes that, over the whole study period, “cumulative temperature-related deaths exceeded cumulative Covid-19 deaths by 8% in south-west England”. And while total temperature-related deaths did not exceed those from Covid in other regions, they did amount to 58% (East Midlands) to 75% (London) of Covid-19 deaths by the end of 2022.
The approach used in the study assumes that deaths caused by Covid-19 and temperature extremes are independent of each other. In other words, individuals are assumed to die either due to Covid or as a result of extreme temperature exposure, but not a combination of the two.
Nonetheless, the findings suggest that Covid “may have impacted temperature-related mortality during extreme weather events”, the study says. For example, “heat-related mortality shifted higher in the Covid-19 years”, compared to extreme events that were not affected by the disease, the authors note.
At the same time, “extreme heat may have exacerbated Covid-19 mortality”, the authors note, pointing out that on 19 July 2022 – the day that 40C heat was recorded – Covid caused 91 more deaths than the daily average over 10-25 July.
The results “highlight the complex interplay between extreme temperatures and the Covid-19 pandemic, as well as its implications on population health and health services capacity”, the study says.
Mapped
The study maps out Covid- and temperature-related deaths to see how they vary regionally.
The authors select 70 heatwave days and 70 cold days from the 30 January 2020 to 31 December 2022 study period. They then calculate regional mortality rates due to Covid, heat and cold during these days.
The maps below show the ratio of temperature-related deaths to Covid-driven deaths over the full study period (left), heatwave period (middle) and cold period (right). Numbers below zero, shown in grey, indicate that Covid-related deaths are higher than temperature-related deaths. Numbers above zero, shown in blue and purple, indicate that temperature-related deaths are higher.
Ratio of temperature-related deaths to deaths due to Covid over the study period (left), heatwave period (middle) and cold period (right). Source: Lo et al (2024).
During heatwaves, heat-related deaths far exceed deaths due to Covid-19 in almost all the regions studied. The study finds that the ratio of temperature to Covid-related deaths was highest in London at 2.7, where temperatures tend to be higher.
(This is likely due, in part, to the urban heat island effect – in which a combination of factors, such as buildings, reduced vegetation and high domestic energy use, cause urban areas to become hotter than more rural regions.)
This finding shows that “that even during the Covid-19 pandemic, heatwaves posed a serious threat to public health”, the study says.
Meanwhile, during cold snaps – when both cold-related mortality and deaths due to Covid spiked – Covid-related mortality was higher. The ratio ranges from 0.4 in east of England to 0.8 in south-west England.
The authors suggest that this is mainly due to “large surges in Covid-19 mortality following the first emergence of the coronavirus and the domination of the Alpha variant, both of which occurred in winter”.
The authors then performed the same heatwave and cold snap calculations for the decade preceding the pandemic, to provide a 2010-19 pre-Covid baseline.
The maps below show the ratio of average annual deaths per 100,000 people during the Covid study period to that during the preceding decade, during heatwaves (left) and cold snaps (right). Lighter green indicates that mortality rates in the Covid and pre-Covid periods were similar, while darker colours indicate that deaths during the Covid study period were higher.
The ratio of average annual deaths during the Covid study period per 100,000 people to that during the preceding decade, during heatwaves (left) and cold snaps (right). Source: Lo et al (2024).
The authors find that during pre-Covid heatwave days, heat-related deaths ranged from six to 14 people per 100,000. They add that during the Covid-19 study period, deaths due to heat and Covid-19 together range from 19 to 24 deaths per 100,000 people.
The authors assume that mortality broadly links to regional demand on health services. As such, they estimate that demand on regional health services was between 1.6 (London) and 3.2 (north-west England) times higher during the pandemic than in the previous decade.
By carrying out the same analysis, the authors find that during cold snaps, demand on health services was between 2.0 (south-west England) and 3.4 (east of England) times higher during Covid than in the previous decade.
The paper highlights “the deadly consequences of an already overwhelmed NHS severely stretched to function through the compound crises of extreme weather and Covid-19”, the authors say, adding:
“If health services are already operating at capacity because of one crisis, the additional health burden from another crisis can break the system entirely, endangering the lives of many people.”
Dahl tells Carbon Brief that the results of this study highlight the need for “amplified public messaging to increase awareness of temperature-related risks”, for “stronger policies and protections around extreme weather”, and to “more adequately prepare public health systems for the co-occurrence of hazards”.
Co-occurring hazards
Despite the study treating temperature- and Covid-related deaths as independent, Lo tells Carbon Brief that “there is certainly a two-way interaction” between the two.
She explains that “a lot of vulnerabilities to temperatures and Covid-10 are shared”, noting that elderly people and those with pre-existing conditions are vulnerable to both extreme temperatures and viruses. This means that one could exacerbate the other, she warns.
She adds that many measures taken to reduce the spread of Covid may have contributed to a rise in temperature-related death. For example, closing social spaces, such as swimming pools and air-conditioned buildings, meant that many people “didn’t have as much of an escape” from the high temperatures in their homes, she says.
Carlson, who studies the relationship between global climate change, biodiversity loss and emerging infectious diseases, tells Carbon Brief that “for the last two decades, we’ve been operating in a very limited framework with how we think about climate change and infectious disease”.
He adds that “going forward, every pandemic will probably be a ‘syndemic’ with a few climate change-related components”.
Lo notes that while this study focuses on the relationship between Covid-19 and extreme temperatures, it speaks to a larger point about the link between climate-related extremes and other hazards, as co-occurring crises can threaten healthcare and other key systems.
Similarly, Dahl warns:
“As climate-related extremes become more frequent, the likelihood that they will intersect with other crises – whether related to public health, social or political unrest, or other environmental problems – will increase.”
China has released its “15th five-year plan for the development of renewable energy”, outlining key targets and policies for the sector in 2026-2030.
A key focus of the plan is boosting renewable generation and consumption as a share of China’s overall energy mix.
It calls for continued capacity additions of wind and solar – albeit at lower levels than previous years – as well as hydropower, biomass and other clean-energy sources.
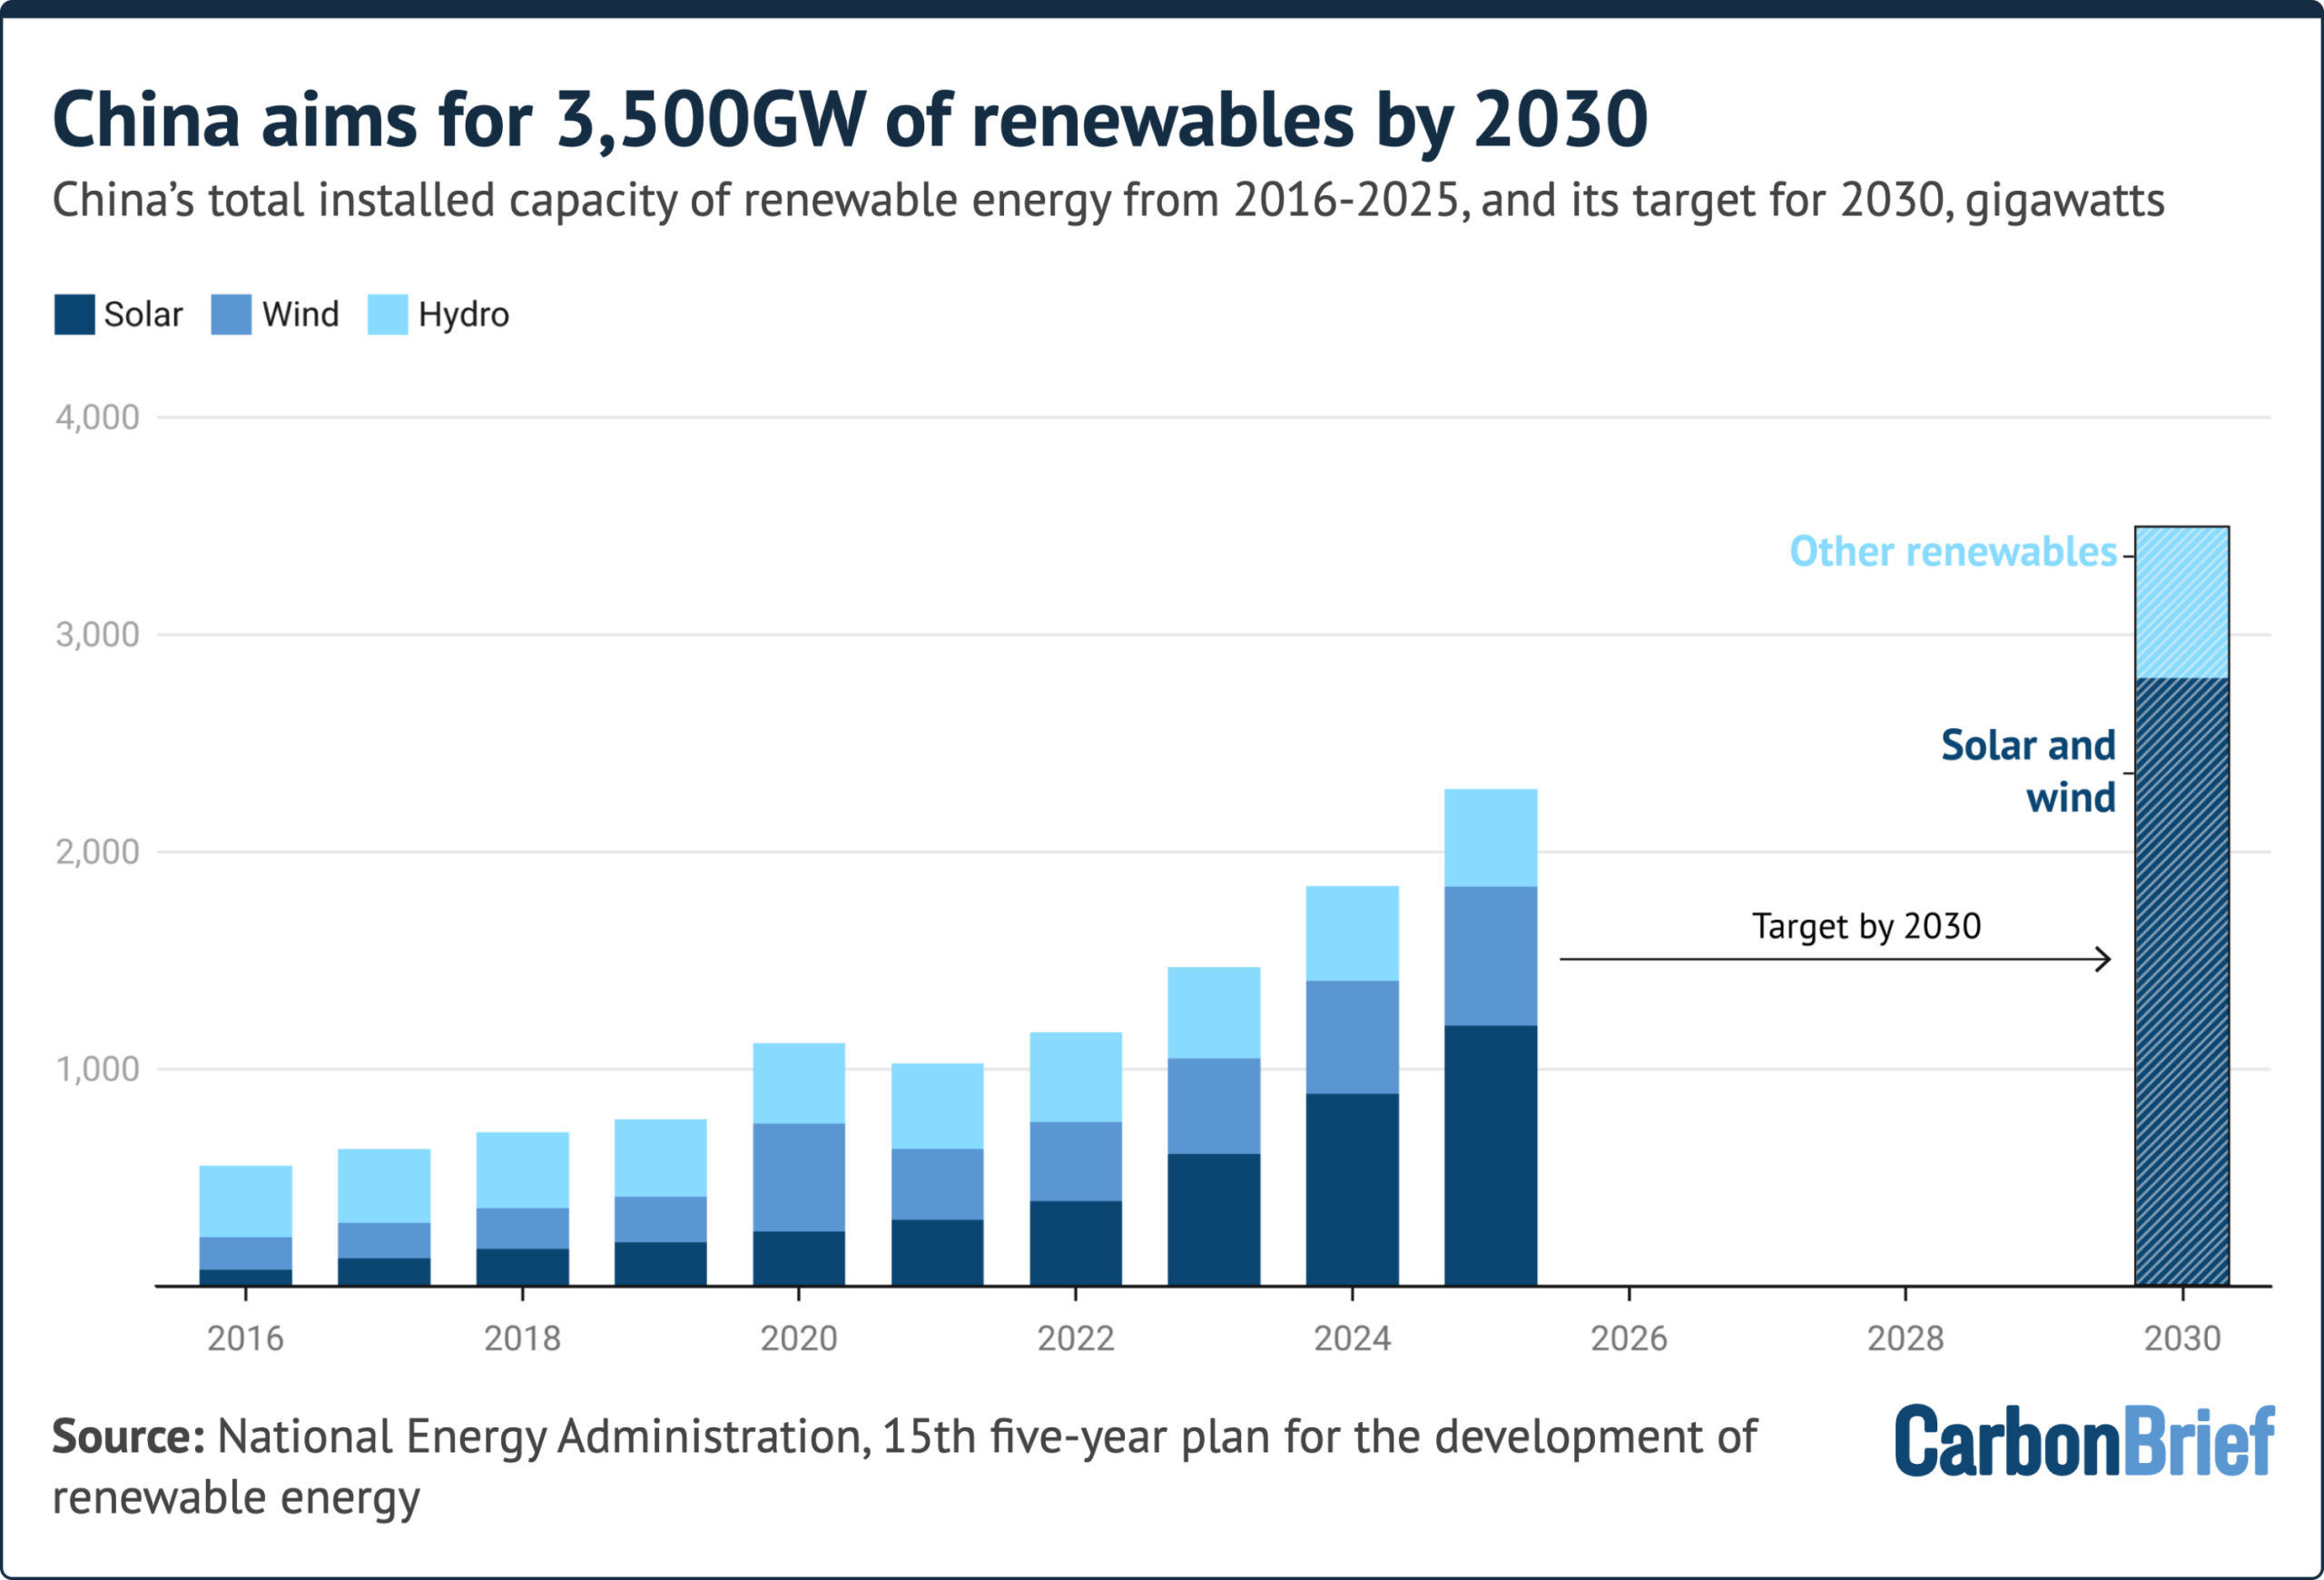
Specifically, China will aim to install 3,500 gigawatts (GW) of renewables capacity by 2030, 2,800GW will be wind and solar.
The country had previously pledged to install 1,200GW of wind and solar by 2030, a goal that China met six years early.
Another major theme is the provision of wind and solar supply that is “dependable” and “grid-friendly”.
Setting a target for “dependable output” from wind and solar could help to entrench their role as a provider of “energy security”, according to analysts.
The government also aims to boost renewables consumption by developing non-power uses of renewable energy, in sectors such as steel and chemicals.
Below, Carbon Brief examines the key targets and policies outlined in the five-year plan and what they mean for China’s energy transition.
Five-year plans are key to China’s political system. An overarching plan, covering all socioeconomic issues of importance to policy leaders, is published at the beginning of each five-year cycle.
The plan for the 15th five-year period (2026-2030) was published in March 2026.
It includes what the government considers to be the most important targets and policy signals for climate and energy. For example, binding targets for carbon intensity, the share of non-fossil energy in total energy consumption and total energy production capacity.
Following this overarching document, five-year plans focused on specific sectors or themes are then published over the course of the five-year plan period.
This year, the government has already published several five-year plans related to energy and climate change. One covers the development of the “new-type” energy sector more broadly. Another wraps climate goals together with other environmental targets under the “Beautiful China” programme.
By contrast, the renewables five-year plan focuses specifically on the development of hydropower, wind, solar, biomass, geothermal and wave energy.
It covers topics including capacity and generation targets, as well as efforts to increase integration and reliability of wind and solar. It also has policies to encourage “non-power use” of renewable energy and ways to strengthen innovation of clean-energy technologies.
What overarching renewables targets are in the plan?
China will aim to install 3,500 gigawatts (GW) of renewables capacity by 2030, according to the five-year plan.
Of this, 2,800GW will be wind and solar – a pledge reiterated from China’s action plan for peaking carbon emissions, which was released earlier this month.
The goal more than doubles a previous 2030 target for wind and solar to reach 1,200GW, which China met six years early.
As of June 2026, the country has installed just under 2,000GW of wind and solar capacity, as well as 454GW of hydropower. Biomass, geothermal and wave energy hold very small shares of the overall energy mix.
As such, China would need to build 160GW of wind and solar each year – and just under 220GW of renewable capacity in total – to meet the targets.
The country installed 277GW of new solar alone in 2024 – and 315GW in 2025.
China’s total installed capacity of renewable energy from 2016-2025, and its target for 2030. Source: National Energy Administration, Carbon Brief.
A key part of meeting the targets will be the development of large-scale clean-energy bases in China’s northern regions. These will generate power to be exported elsewhere via ultra-high voltage lines. The plan also encourages greater “local consumption” and installations of distributed energy (see below).
The plan says that further research will be directed at increasing the renewable share of electricity generated by these large-scale energy bases to 100%.
A recent report by the thinktank Global Energy Monitor (GEM) finds that output from these bases “continues to be paired with coal-fired generation in the name of balancing and system flexibility”. It says that currently, coal generates 42% of the power transmitted to the rest of the country from these bases.
China will also add more hydropower, says the plan, with capacity rising from 448GW in 2025 to 570GW in 2030. Some 160GW of this will be pumped-storage hydropower.
Meanwhile, the plan sets a target for renewable power generation to reach 6,000 terawatt-hours (TWh), 4,000TWh of which would come from wind and solar.
This would be a 50% increase in five years as renewables generated just under 4,000TWh of electricity in 2025, according to the National Energy Administration.
By 2030, the plan says that total consumption of renewable energy will stand at 1.8bn tonnes of coal equivalent (Gtce).
This would be up from 1.2Gtce in 2025, which represented about one-fifth of China’s total energy consumption of 6.2Gtce that year.
The renewable targets in the plan are lower than those suggested in a recent study by high-profile Chinese scholars.
The study, from the department of energy and power engineering and the Institute of Climate Change and Sustainable Development at Tsinghua University in Beijing, assessed the “likelihood of China attaining its carbon peak” under different pathways.
It found that, in order to meet its climate commitments, China would need to either install more than 4,000GW of “non-fossil energy capacity” before 2030, or to “maintain a total energy consumption” below 6.5Gtce.
The table below outlines some of the key renewables targets for 2030, as specified in the plan.
Key targets for 2030, adapted from 15th five-year plan for renewable energy
Type
2025
2030
Percentage change
Renewable energy use
1.2Gtce
1.8Gtce
53%
Total renewables capacity
2,340GW
3,500GW
50%
Wind and solar capacity
1,840GW
More than 2,800GW
52%
Of which: Solar thermal
1.8GW
15GW
733%
Hydro capacity
450GW
570GW
27%
Of which: Pumped storage hydropower
66GW
160GW
142%
Wave energy
–
0.4GW
–
Renewable generation
4,000TWh
6,000TWh
50%
Of which: Wind and solar
2,300TWh
4,000TWh
74%
Non-electricity use
60Mtce
150Mtce
150%
Renewable hydrogen
0.25Mt
2Mt
700%
Why does the plan focus on ‘firm capacity’ for renewables?
As well as increasing the overall size of China’s renewable power supply, the country must also maintain an “uninterrupted and reliable power supply”, officials from the NDRC and NEA told state news agency Xinhua in coverage of the new plan.
To support this goal, the plan says that the development of renewables will “enter a new stage”. This will mean that “improving quality and serving as a reliable alternative” to fossil fuels will be as important as “expanding scale”.
The plan, therefore, proposes targets for the “firm capacity” from wind and solar (置信出力). This is the amount plants or grids can be relied on to produce during critical supply periods, in conjunction with on-site storage.
The target for wind is a firm capacity of at least 11% of total installed capacity by 2030, while the equivalent goal for solar is 6%.
Wind and solar will also be expected to supply more than 20% of total demand in peak periods during the summer and winter evenings, says the plan. It expects “reliable peak-shaving capacity from renewable sources” to reach more than 300GW.
The new targets are a “positive move”, says Yao Zhe, global policy advisor at Greenpeace East Asia, as it “only applies during peak load and critical supply periods, when coal power is typically used to stabilise the power supply”.
She adds that this could, theoretically, “prevent the construction of new coal-fired power projects that are proposed and approved for the reason of meeting peak demand”.
The new metrics mark a change in focus, says Lyu Wenbin, director general of the Energy Research Institute – a state thinktank under the NDRC – in an “explanatory reading” posted on BJX News. He says it “marks a shift in renewable energy development from the mere pursuit of installed capacity to…also taking into account system support capabilities”.
The plan pledges to “accelerate the construction of grid-friendly wind and solar power stations”. It says this will enhance “reliable peak-load generation” and strengthen renewables’ ability to ensure “safe and stable operation” of the grid.
It says this will particularly be a focus in the energy-hungry east, central and south areas of China.
It sets out a slightly different focus for areas that already have a high share of renewables in their power mix, such as north-west China. Here, the aim will be to develop wind and solar parks that are “capable of providing voltage, frequency and inertia support”.
“This is a real challenge”, says James Norman, research analyst at GEM. He says these challenges are particularly acute in some circumstances:
“[For example], when the share of wind and solar is very high, relatively few synchronous generators (like coal) are online or large volumes of electricity are being transferred through high voltage DC lines.”
The plan mentions many technological solutions to address the problem, he tells Carbon Brief. However, he adds, there are no quantitative details for the issue. For example, he notes there is no target for “how many gigawatts of wind and solar must gain grid-forming capability”. This is in contrast to the goals for overall renewables capacity or generation.
Norman was a co-author on the recent GEM report, which identified further barriers to renewable uptake. It said these include transmission bottlenecks, alongside systemic features such as dispatching and power-contract mechanisms.
As a result, said the report, renewable power – especially solar – is increasingly being “curtailed”, particularly in north-western and northern provinces.
Yao also notes that the plan does not “spell out specific measures to address systemic constraints” around the electricity grid and the role of coal in the power sector.
“I interpret this as evidence that the vested interests are still strong in the policy debate,” she adds.
What does the plan say about ‘distributed’ energy?
Alongside gigawatt-scale clean-energy megabases, China also aims to expand construction of “distributed” energy. This means smaller-scale installations, such as rooftop solar.
More than 300GW of “distributed new energy” is to be added over 2026-30, some 60GW per year.
The plan aims for distributed new energy to be adopted in sectors such as industry, transport, buildings and agriculture.
Applications include the use of distributed solar and wind in industrial parks, coal mines and oilfields, as well as encouraging residents to install solar panels on buildings and developing rural clean-energy grids.
In some regions, distributed solar and wind is “likely to meet a large proportion of local demand”, says Prof Pan Jiahua at the Hong Kong University of Science and Technology (Guangzhou). He tells Carbon Brief that micro- and mini-grids using such resources will be particularly important in central and coastal China.
The 60GW annual target for new distributed energy is not “overly ambitious”, says Isadora Wang, head of China at the thinktank Transition Asia. She tells Carbon Brief that distributed solar additions, alone, exceeded 100GW in both 2024 and 2025.
Cosimo Ries, analyst at the consultancy Trivium China, agrees that the target is reachable. The biggest question mark, he tells Carbon Brief, is whether it will continue to make sense for industry and utilities to build distributed power at the volumes seen during the 14th five-year plan period.
He adds that market conditions for distributed solar have deteriorated sharply over the past two years. He says a range of factors have hit investor confidence:
“[Distributed solar faces] growing exposure to market trading, worsening returns in spot markets, growing risks of curtailment and new policies limiting or forbidding the selling of power back to the grid.”
What does the plan say about non-electricity use of renewables?
The plan also sets goals for renewable energy’s role in “non-electricity use”.
This means using renewable energy for purposes other than generating electricity, through converting it to other forms, such as heat or mechanical energy.
The government is aiming for non-power use to nearly triple from 60m tonnes of coal equivalent (Mtce) in 2025 to 150Mtce in 2030.
Ries tells Carbon Brief that he thinks this target is “one of the main highlights” of the plan. However, he notes that limited available data means it is hard to assess the level of its ambition. He adds that, given the relative conservatism of China’s other recent clean-energy targets, this one may also be met relatively easily.
Key applications for non-power use of renewables include “green hydrogen, ammonia and methanol”, says the plan. It also points to using wind and solar for heat, as well as to biomass and geothermal for heating and cooling.
Green hydrogen, ammonia and methanol are the “centrepiece” of the non-power push, according to state-owned newspaper Economic Information Daily.
For hydrogen alone, China plans to scale up renewable hydrogen production to 2m tonnes in 2030, up from 250,000 tonnes in 2025.
Today, non-power use of renewables accounts for only around 1% of China’s total energy consumption, NEA and NDRC officials said in a Q&A. They added that there is “considerable room for growth” in sectors such as industry, transport and buildings.
Potential new applications include the use of wind and solar for heat. This could see the use of centralised wind and solar heating stations in the chemicals, textiles, pharmaceuticals, papermaking and food sectors.
New projects in the steel and cement sectors should use locally-generated wind and solar to power electric-arc furnaces and kilns, adds the plan.
Wang tells Carbon Brief that she believes the naming of individual sectors is a “clear indication” that they will be included in China’s renewable consumption quotas. These already cover aluminium and other heavy industry sectors.
She adds that power and heat demand from the named sectors may help absorb distributed renewable energy. It will also serve as a testing ground for matching demand with supply through increased grid flexibility and power price reforms.
To Ries, the growing focus on non-power use signals that China’s decarbonisation efforts are “now entering deeper waters”. That means regulators are turning from easier-to-abate sectors, such as aluminium, to more challenging industries, such as steel.
The plan could create a “second growth curve” for the new-energy industry, says He Zhao, in a commentary for China Power News Net. He, the vice-president of the China Electric Power Planning and Engineering Institute (EPPEI). says this might begin with non-power use, before shifting to fuel, feedstock and heat substitution.
What does the plan say about China’s cleantech dominance?
The next five years is a prime opportunity for China to “consolidate our leading position across the entire industrial chain” for clean-energy technologies, says the plan.
It adds that the government will “strengthen technological innovation” and accelerate the roll-out of new applications of artificial intelligence in China’s renewable-energy system.
A particular focus for new R&D will be “cutting-edge, original and disruptive technologies”. It also points to technologies that “enhance the reliability of renewable energy” as a substitute for fossil fuels.
The plan names technologies for further development. For wind power, these include “reliable and low-cost” blades, ultra-tall towers and new types of floating platforms. It also mentions the development of “high-altitude wind power”. For solar, it points to the development of perovskite and other “high efficiency” solar cells, as well as space-solar technologies.
The plan also pledges to develop a power market that supports the “full entry” of renewable-energy companies. It underscores that companies should plan for an increasingly market-based and competitive environment.
Meanwhile, the government will also deepen cooperation with other countries on clean energy and “advance” global climate cooperation, it says.
A priority will be “strengthening” international coordination on investment and development in “green energy projects”. Another is “actively promoting the free circulation of China’s high-quality green technologies and products in global markets”.
Chinese exports of clean-energy technologies have been surging, especially since the closure of the strait of Hormuz.
At the same time, Chinese investment in clean-energy projects in Belt and Road Initiative member states totalled $20bn in the first half of 2026. This is also driven by the crisis.
The US, EU and others have launched tariffs and pricing mechanisms to curb imports of Chinese cleantech. This has contributed to pushback from China, against what it and others refer to as “unilateral trade measures”.
China is transitioning from a “major energy nation” (能源大国) to an “energy powerhouse” (能源强国), writes the Energy Research Institute’s Lyu in his explanatory reading. He says this will enable China to increasingly shift to building “systemic” advantages in developing clean-energy technologies.
He continues that, from 2026-2030, China will “move to the very forefront of the global stage” on clean energy, “venturing into uncharted territory”. This will create both “major new challenges and significant opportunities” for the country, he adds.
Interview: Dr Sun Yixian on his new database tracking Chinese climate ‘leadership’
SYDNEY/KINGSTON, Wednesday 29 July — The future of deep sea mining will be a focus for world leaders this week as the International Seabed Authority (ISA) Assembly takes place in Kingston, Jamaica.
Country delegates and members from Pacific Civil Society have come together to discuss a deep sea mining code, while the call for a moratorium grows. It follows the ISA’s contentious decision last week to extend The Metals Company subsidiary Nauru Ocean Resources Inc’s (NORI) exploration contract, despite its support for the pursuit of unlawful deep sea mining via US unilateralism.
The Assembly’s agenda was agreed to yesterday, with a science item put forward by Vanuatu to be heard on Thursday local time. Overnight, Mozambique and Mauritius joined the call for a global moratorium.
Rae Bainteiti, Pacific Political Coordinator at Greenpeace Australia Pacific, said from the ISA in Kingston:
“As we move into the General Assembly this week, the fundamental issue remains that there is not enough science to guarantee the safety and protection of the ocean in a world where deep sea mining is allowed. As trustees of the ocean, the common heritage of humankind, our Pacific governments must stand firm against corporate interests that are pushing to move ahead with deep-sea mining outside the ISA framework. If deep sea mining goes ahead, Pacific communities will suffer the economic, cultural and social consequences. We continue to call on all States to support a moratorium as the principled and responsible pathway to protect the ocean.”
Currently, 45 countries, including seven Pacific nations, support a moratorium or precautionary pause on deep sea mining. Last week, Australia’s Labor National Conference committed to supporting a moratorium, but the government has yet to make an official comment.
More of Germany’s electricity came from wind and solar power than fossil fuels for the first time ever in 2025.
Together, wind and solar power generated 225 terawatt hours (TWh) of electricity – accounting for 44% of the total in 2025 – with just 217TWh (43%) coming from fossil fuels.
Solar and onshore wind have grown rapidly under Germany’s “Energiewende” strategy over the past two decades, as the nation transitions away from both coal and nuclear power.
Renewables have recently faced mounting opposition from the far-right Alternative for Germany (AfD) party and the current coalition government has been trying to develop new gas-power plants.
Nevertheless, Carbon Brief analysis of Energy Institute data – shown in the chart below – illustrates how wind and solar have continued growing, emerging as the nation’s largest power source.
The success of renewables in Germany mirrors the EU as a whole, which also saw wind and solar overtake fossil-fuel power generation in 2025 for the first time.
“Other renewables” includes hydropower, bioenergy, geothermal and other renewable sources not otherwise stated. Source: Energy Institute Statistical Review of World Energy, 2026.
Germany has various targets in place that require a rapid expansion of wind and solar power, including cutting economy-wide emissions to net-zero by 2045.
The nation is also aiming to increase renewables’ share of electricity consumption to 80% by 2030 to achieve a “largely climate neutral” power system by 2035. It aims to decarbonise its electricity entirely once coal power has been phased out, which has a deadline of “no later than” 2038.
(The renewables targets also include electricity generated from hydropower and bioenergy. The latter produces a relatively large share of Germany’s power – roughly a tenth in 2025.)
Germany has to rely on renewables more than neighbours, such as France and the UK, to achieve its climate goals. This is due to its phaseout of nuclear power, which is a key part of the “Energiewende” strategy.
Nuclear power has long faced widespread public opposition in Germany. This year, the centre-right chancellor Friedrich Merz described the nuclear phaseout as a “strategic mistake”, but the government has ruled out a return to conventional nuclear power.
The country has an official coal phaseout date of 2038, but experts say the country is on track to eliminate coal from its power supply years earlier. This is despite some pressure to temporarily slow the transition away from coal during the recent energy crisis.
(Very few outside the AfD are calling to scrap the coal phaseout altogether, but the government will publish a review of the timelines in August.)
While coal generation has fallen quickly, even as nuclear was being phased out, some argue that coal could have been cut more quickly if nuclear had remained.
Gas-power expansion has also been framed by the government in recent years as an essential component of Germany’s transition away from coal and nuclear power, to support a renewables-heavy grid.
The current government under Merz has tried to boost gas and recently adopted a law to provide state support for new gas-fired power plants. The plan is for these plants to be converted to run on “green hydrogen” by 2045, in order to meet the climate-neutrality goal.
Germany aims to install 115 gigawatts (GW) of onshore wind by 2030 and approved a record 20.8GW of new capacity in 2025.
Meanwhile, solar generation has reached unprecedented levels during the hot summer of 2026.
However, the government’s planned grid reforms have been criticised by the renewables industry for risking slowing down the energy transition. Under the proposals, renewables developers would only be granted automatic grid connections in areas with limited grid capacity if they waive compensation for future curtailed generation.
Interview: COP31 president says electrification is ‘surest way to protect citizens’