

After a slight delay of the Maria S. Merian caused by late-arriving containers our research cruise MSM142 finally got underway. By last Tuesday (24.03.2026), the full scientific team had arrived in Nuuk, the capital of Greenland, and the ship reached port on Wednesday (25.03.2026) morning. That same day, scientists and technicians moved on board and immediately began preparations, assembling and testing our instruments. Although the mornings on Wednesday and Thursday were grey and overcast, the afternoons cleared up beautifully. This gave us valuable time to organize equipment on deck and store empty boxes back into the containers before departure.
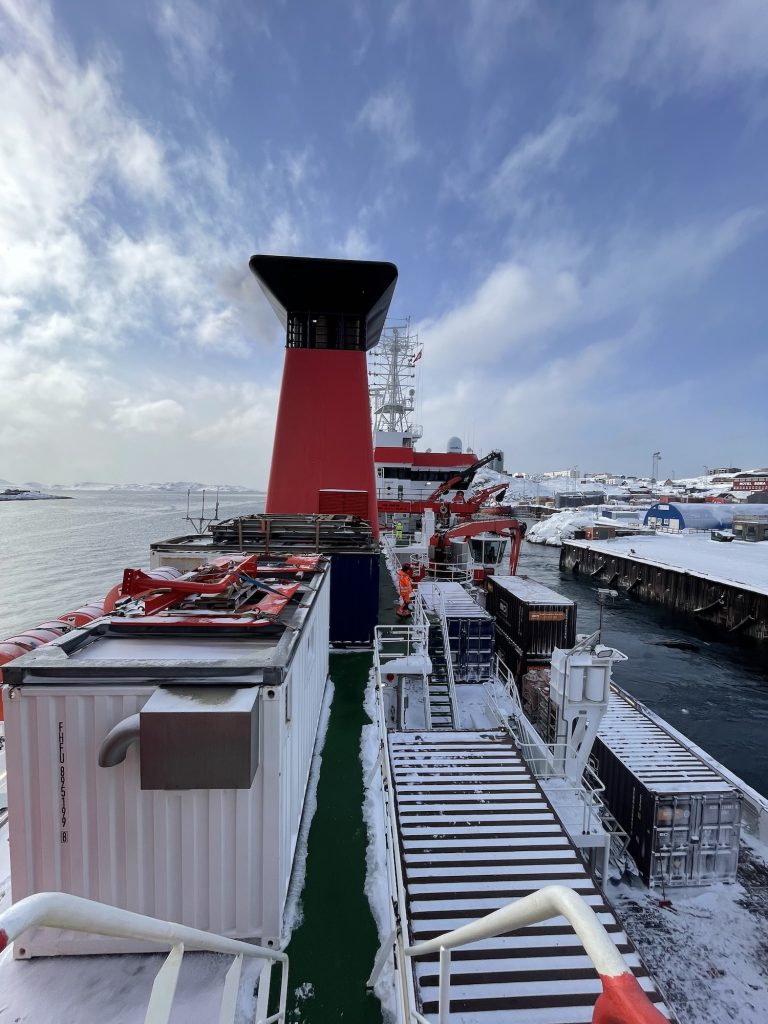
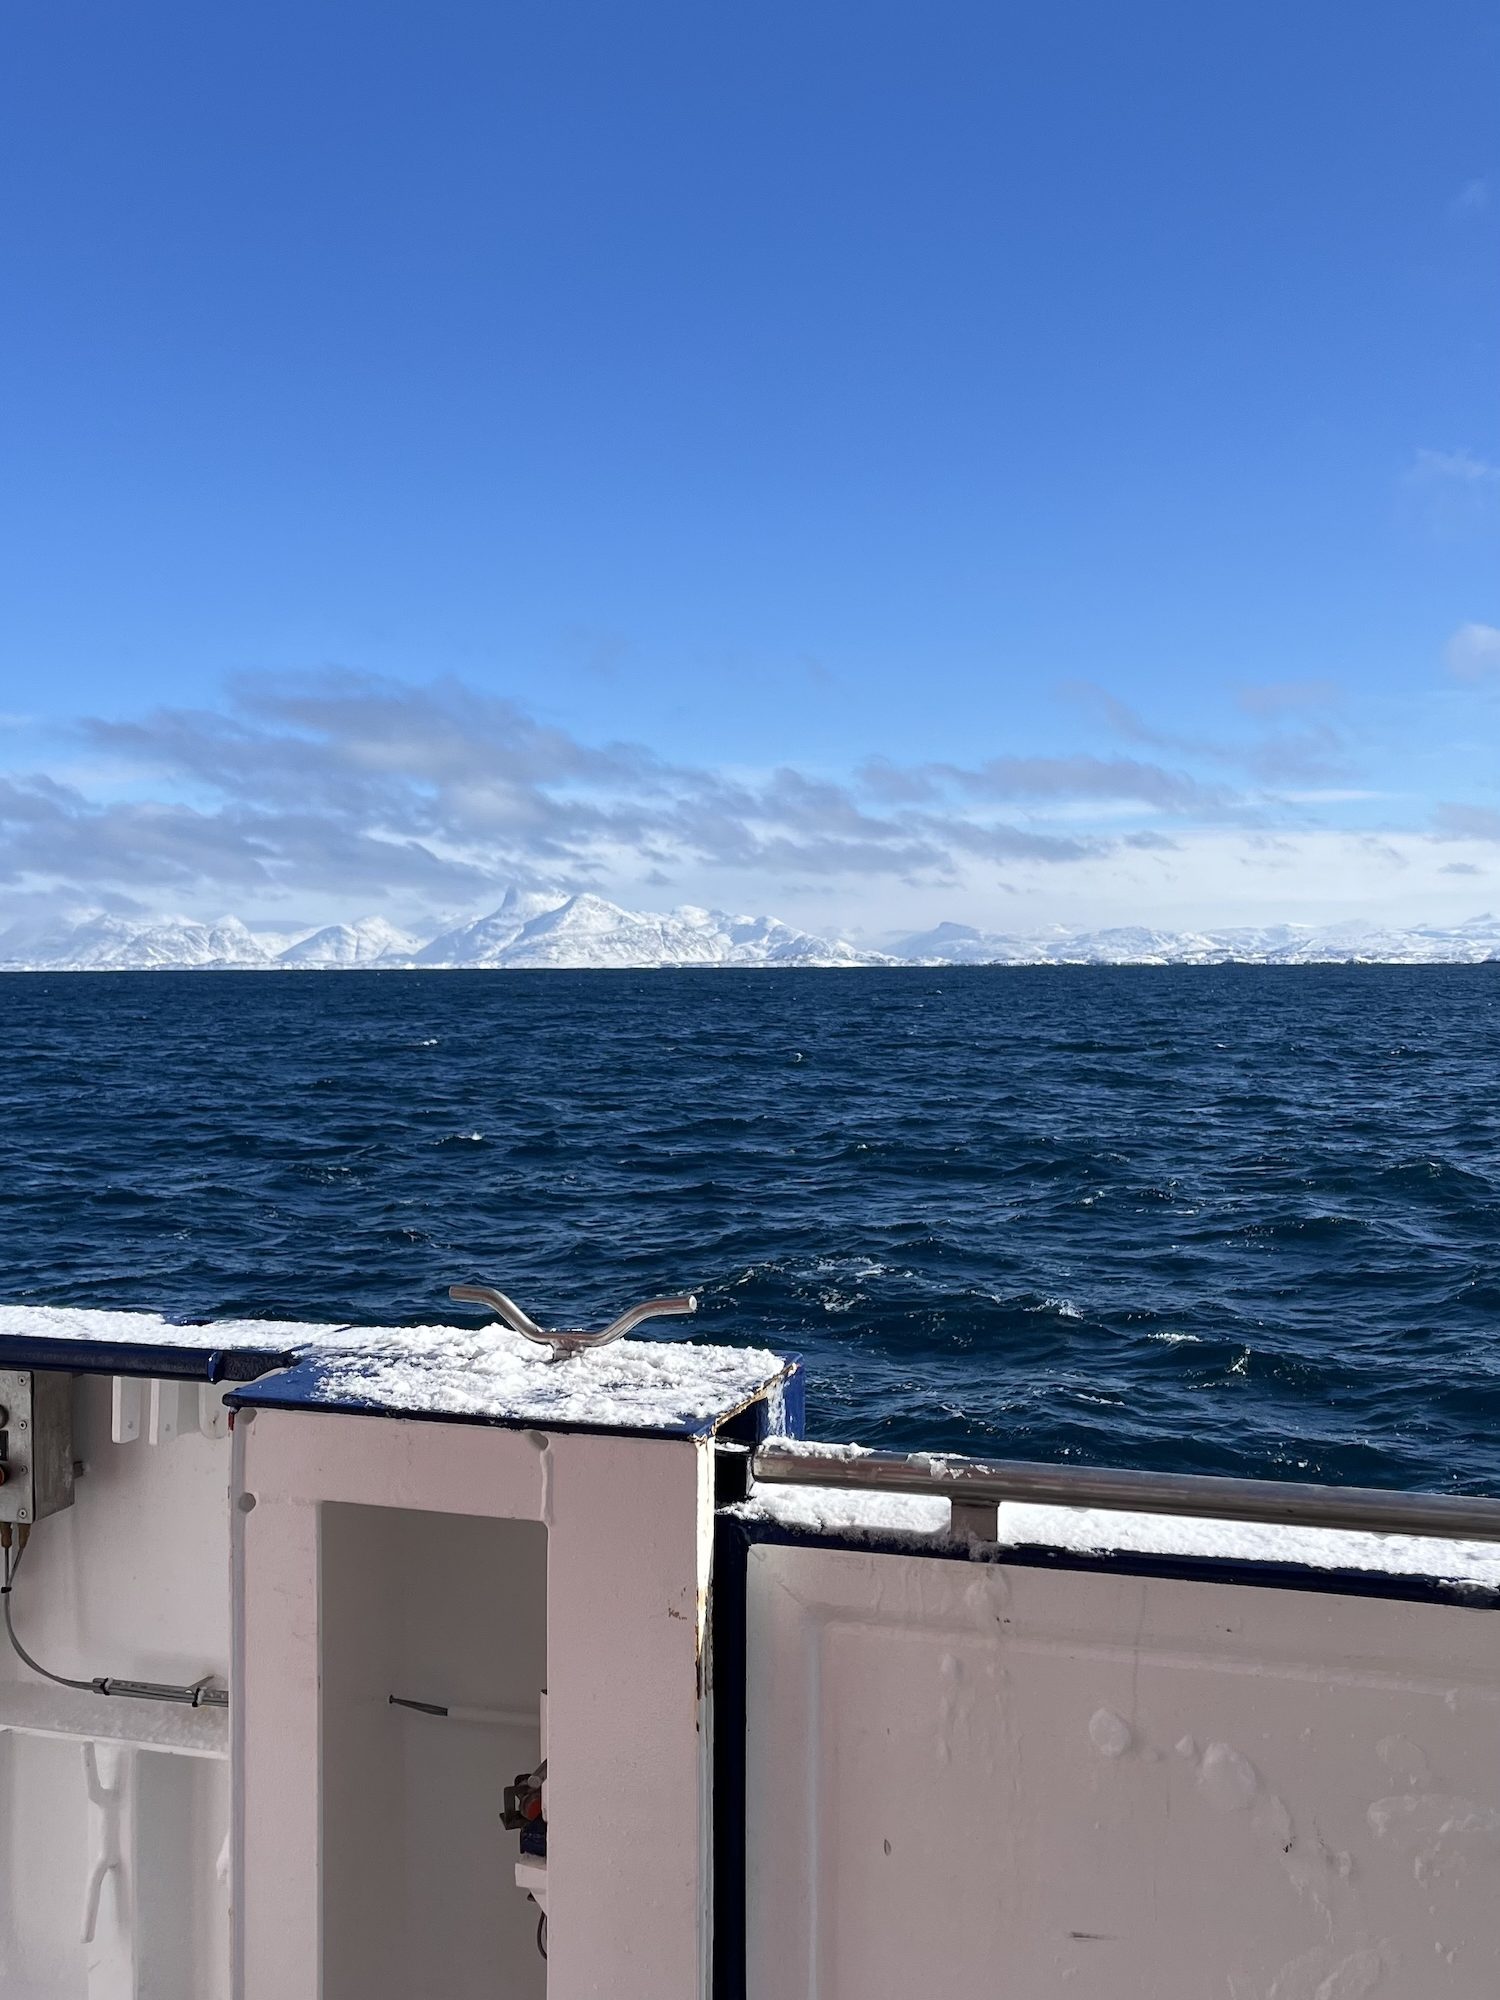
Given the forecast of harsh conditions outside the fjord, we carried out the mandatory safety drill while still in harbour. This included practicing emergency procedures and boarding the lifeboat. After completing border control, we were finally ready to leave Nuuk. We set sail on March 27th, heading into the Labrador Sea to begin our mission. Even before starting scientific operations, we tested the setup for deploying our gliders without releasing them during the transit out of the fjord. Once we reached open waters, we were met by high waves the following morning. For some on board, this was their first experience under such rough sea conditions. Seasickness quickly became a challenge for a few, while scientific work had to be temporarily postponed due to the strong winds and sea conditions. Together with the crew, we discussed how best to adapt our measurement plans to the given weather conditions. On March 29th, we were finally able to begin our scientific program with the first CTD deployment. A CTD is an instrument used to measure conductivity, temperature, and depth, which are key parameters for understanding ocean structure.
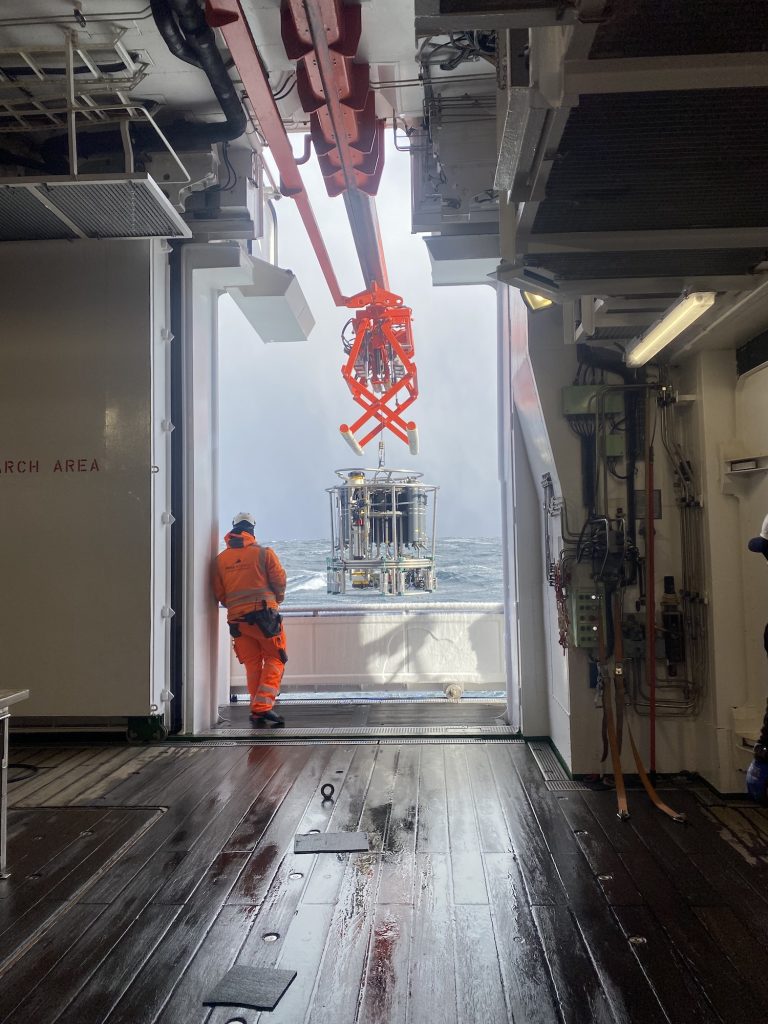
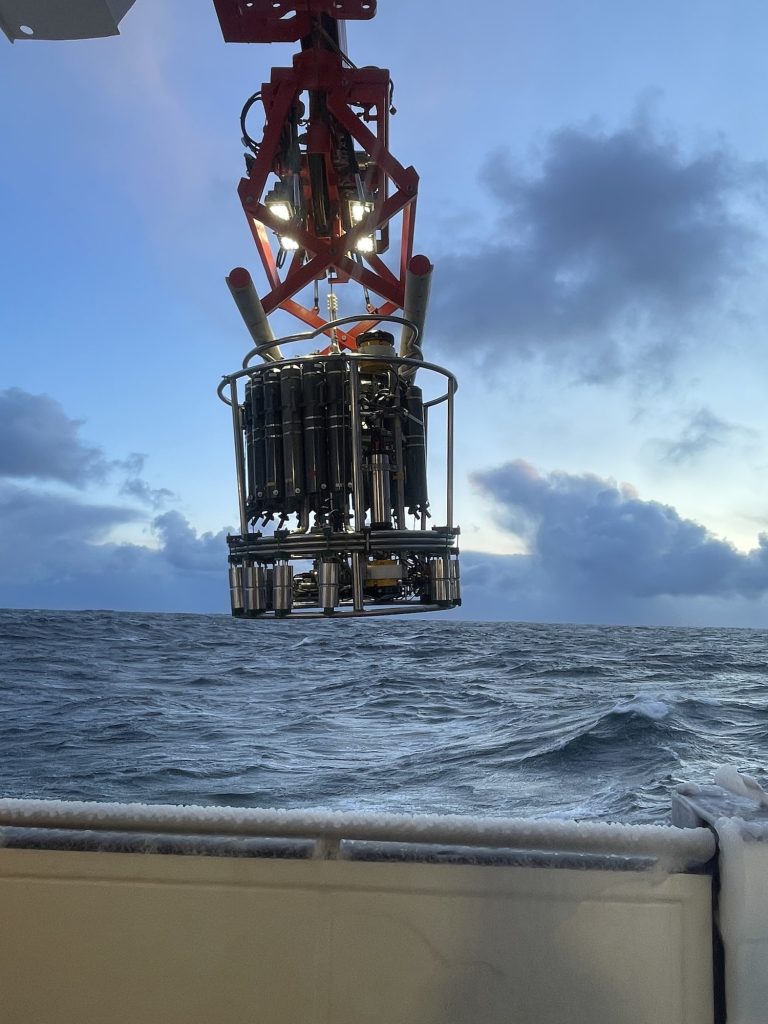
During the following night, we continued with additional CTD stations and successfully recovered two moorings: DSOW 3 and DSOW 4, located south of Greenland. These moorings carry instruments at various depths that measure velocity, temperature, and salinity. DSOW 4 was redeployed on the same day, while DSOW 3 followed the next day. In addition, the bottles attached to the CTD’s rosette can be used to collect water samples from any desired depth. These samples can be used, for example, to determine the oxygen content, nutrient levels, and organic matter.
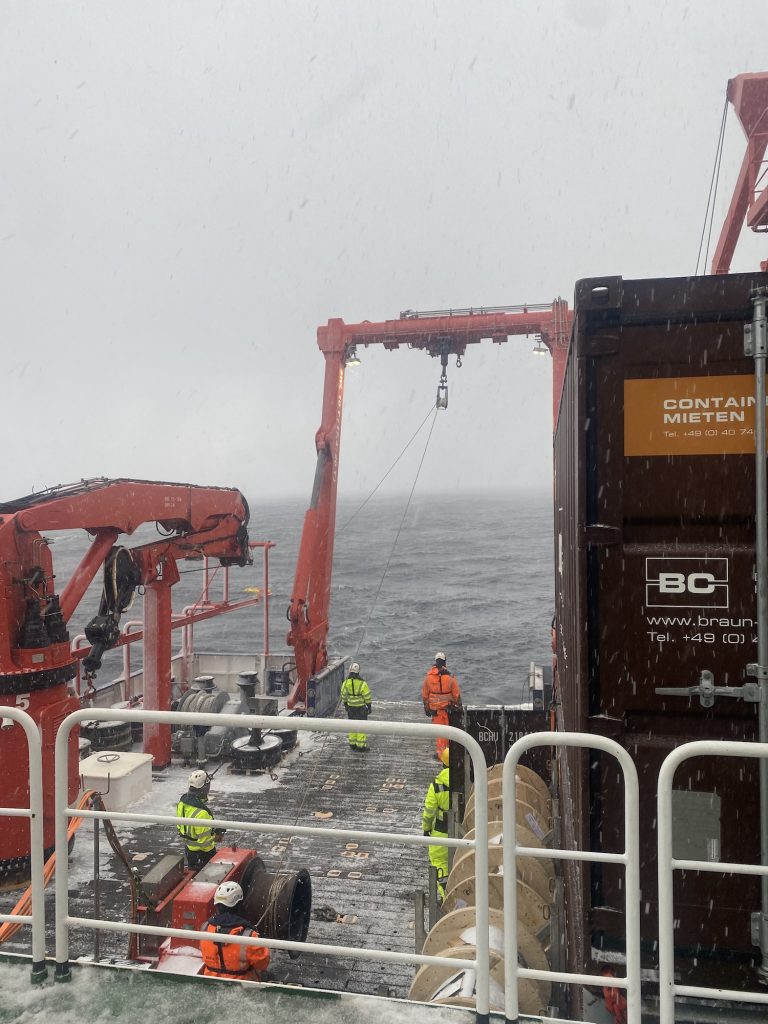
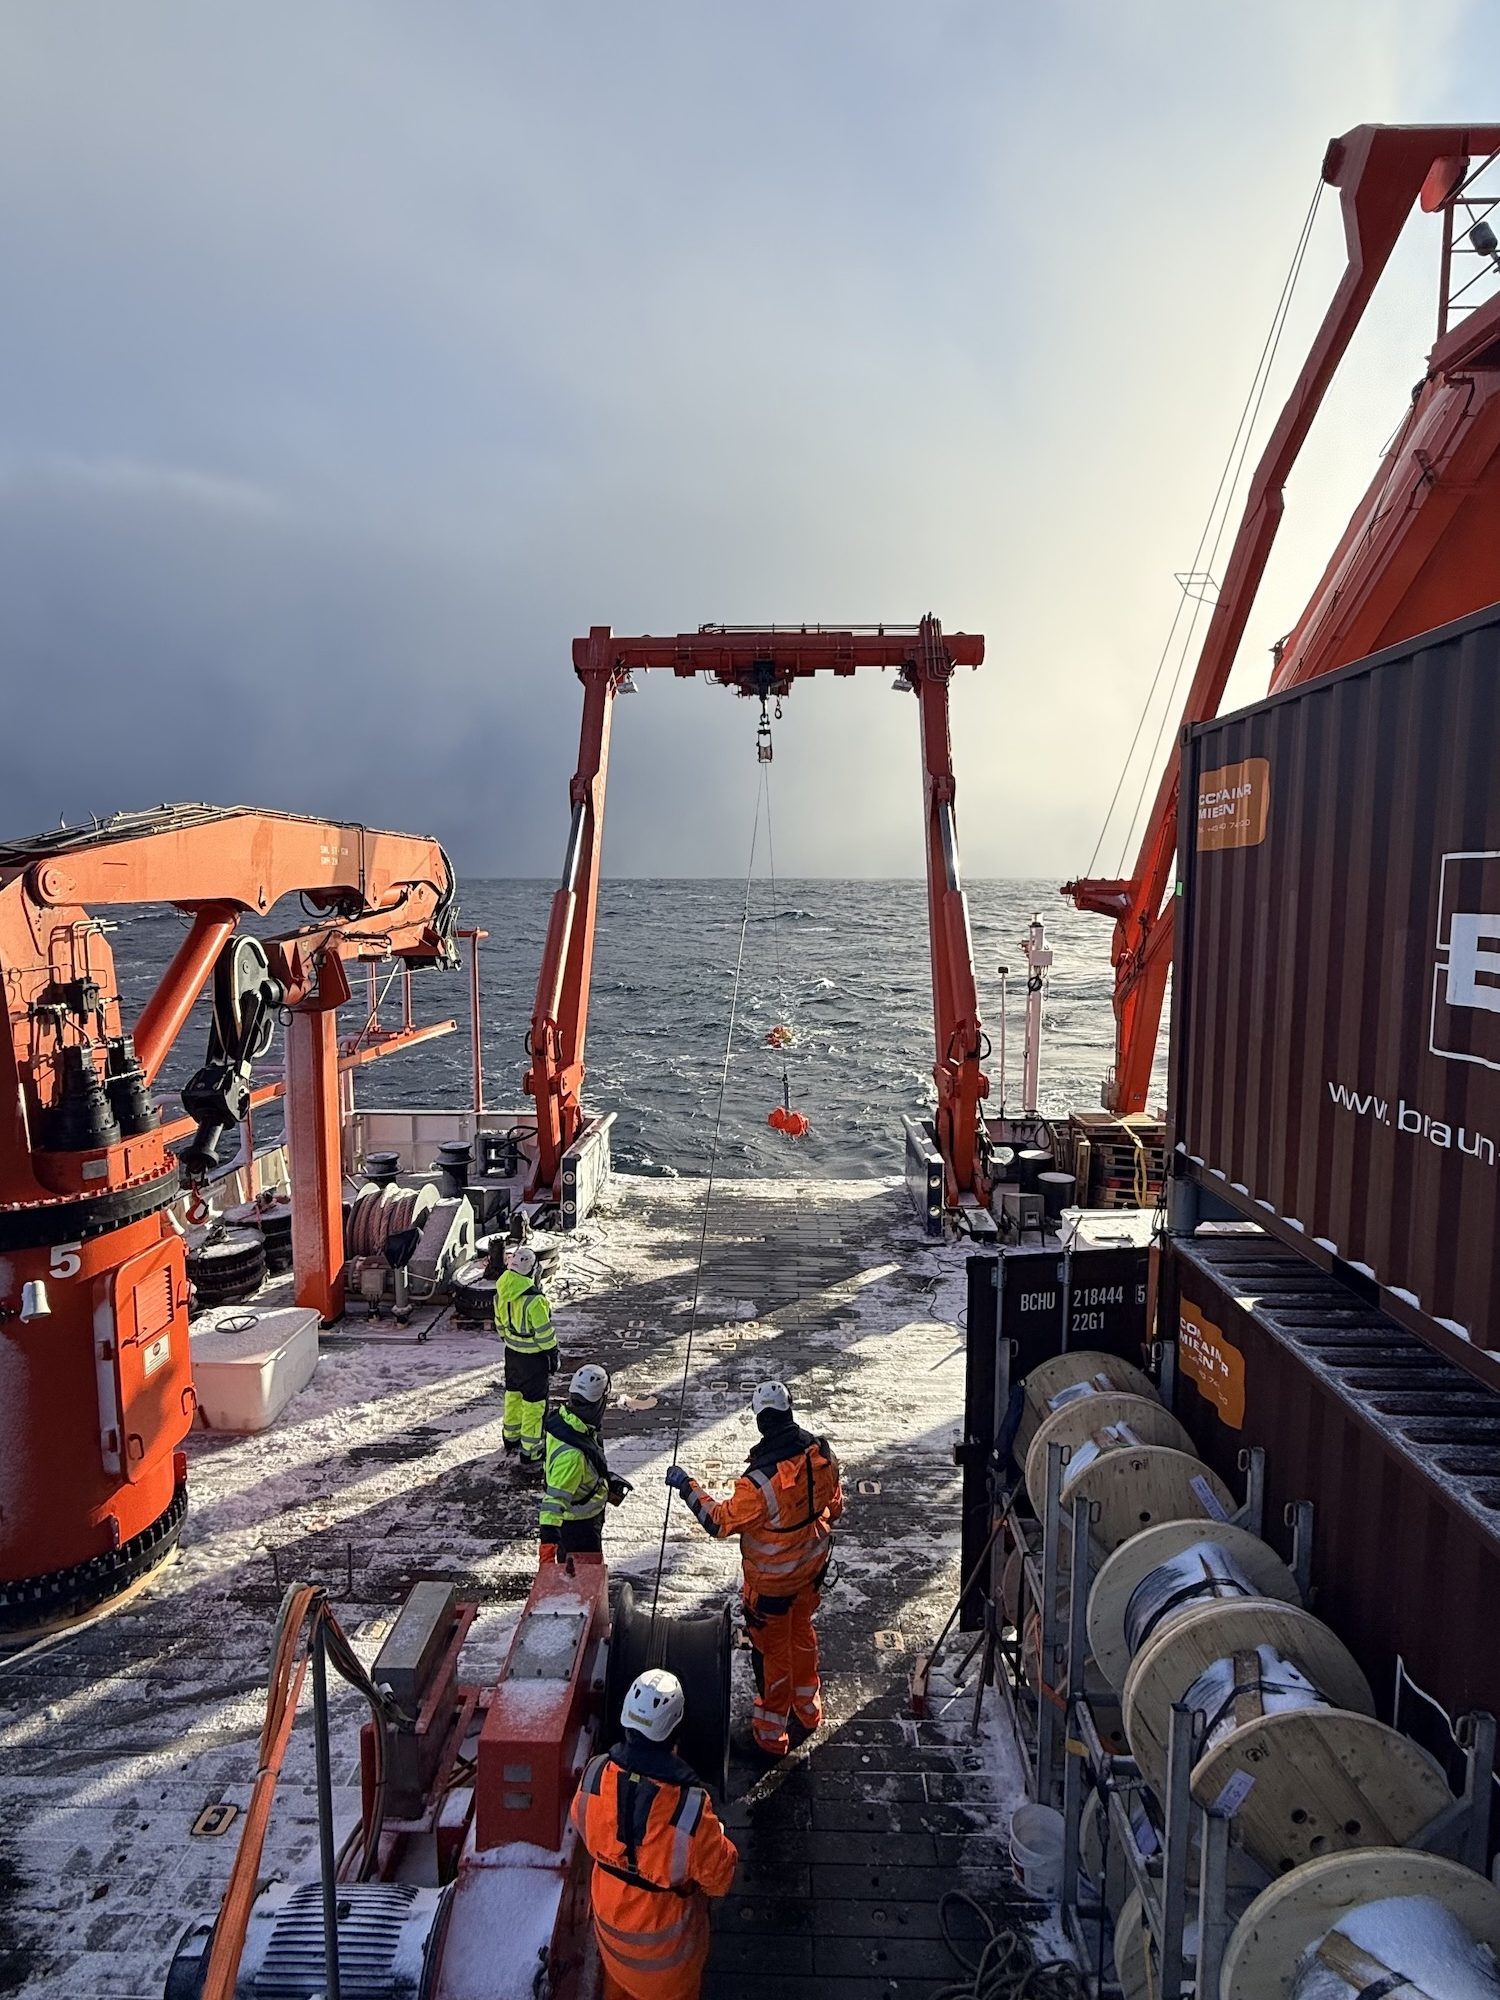
Both are part of the OSNAP array, a network of moorings spanning the subpolar North Atlantic. On these moorings are a few instruments, for example microcats which measure temperature, pressure and salinity.
We then conducted around 25 CTD stations spaced approximately 3 nautical miles apart across an Irminger ring identified from satellite data. This high-resolution sampling was necessary to capture the structure of an Irminger Ring, which had a radius of about 12 km wide.
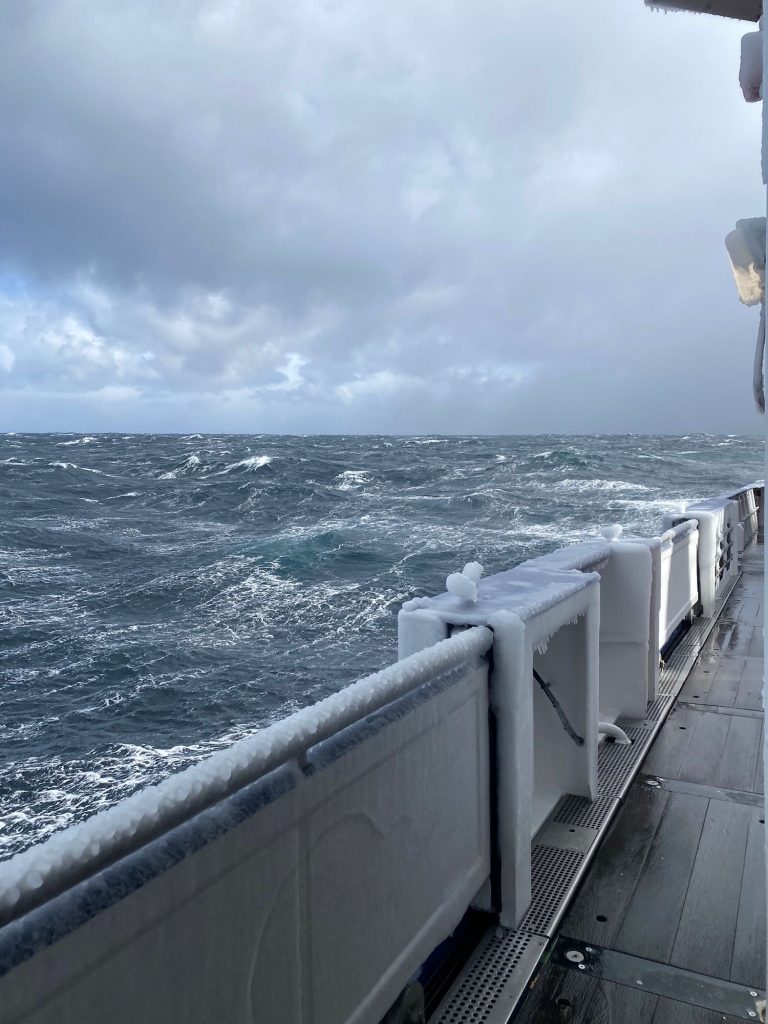
The days leading up to April 2nd were marked by very rough weather conditions. Life on board became both challenging and, at times, unintentionally entertaining sliding chairs were not uncommon. During the night from April 1st to April 2nd, winds reached 11 Beaufort with gusts up to 65 knots, forcing us to pause our measurements. Fortunately, conditions improved by morning, allowing us to resume our work. As well as with the help of the crew we had to adapt to the harsh weather conditions to continue our scientific work. On the 3rd of April, we were able to deploy a few gliders and one float. An ocean glider is an autonomous underwater Vehicle, which you can steer remotely and send to different locations, while it is measuring oceanographic key parameters.
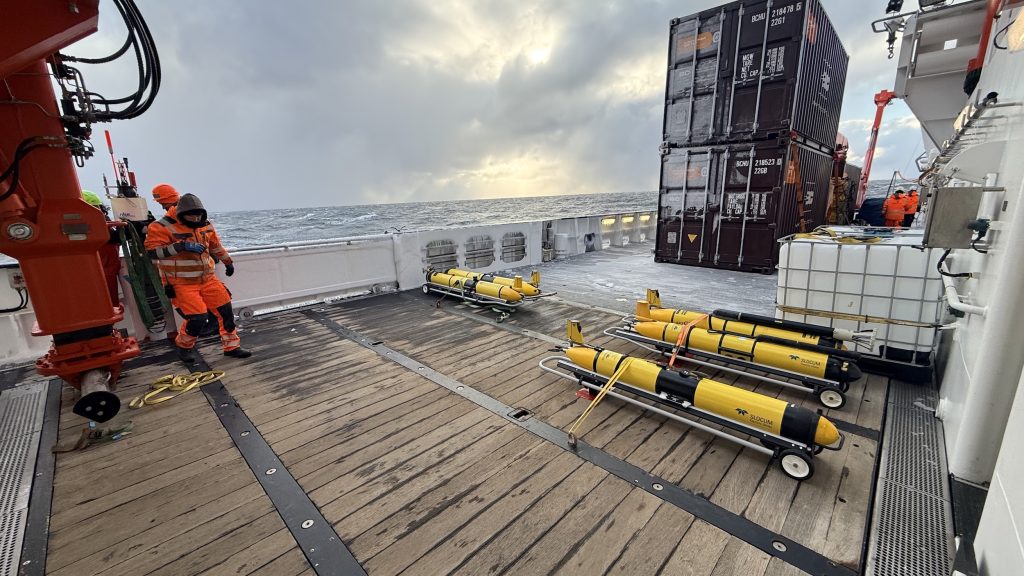
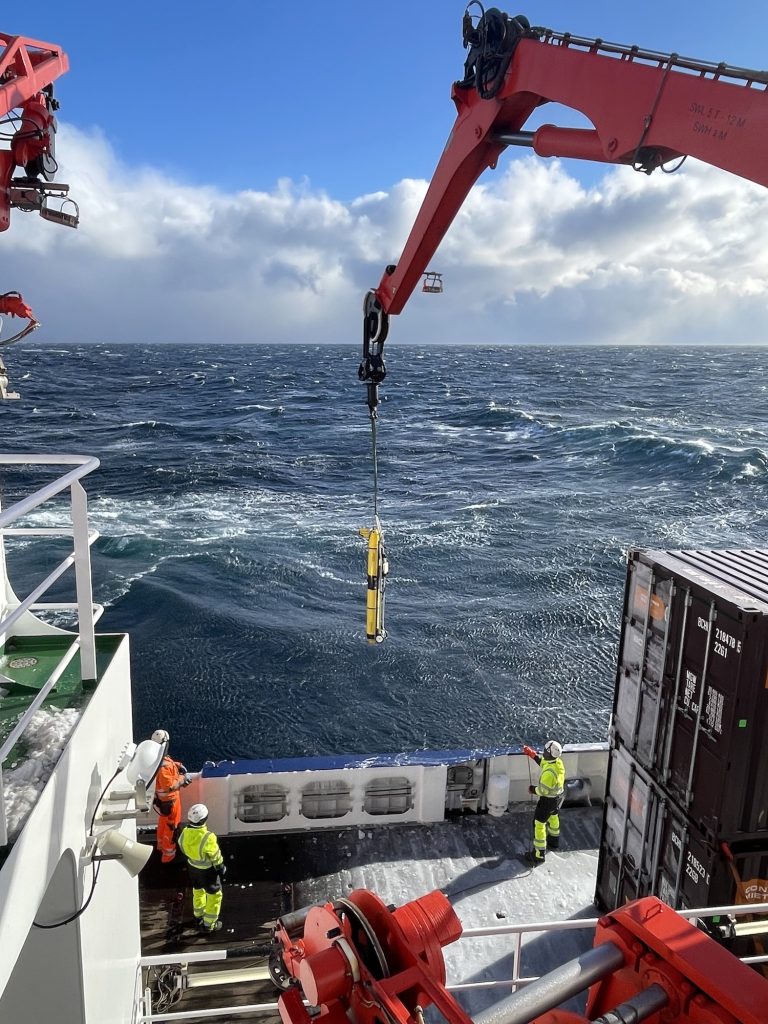
This research cruise focuses on understanding small-scale processes in the ocean and their connection to the spring bloom, an essential phase in marine ecosystem in subpolar regions. Despite the challenging start, we have already gathered valuable data and look forward to the weeks ahead in the Labrador Sea.




If you’ve ever joined a beach cleanup, you’ve almost certainly picked up a plastic bottle. During Ocean Conservancy’s 2025 International Coastal Cleanup® (ICC), plastic beverage bottles were the top item collected by volunteers around the world. Plastic bottles have been among the top 10 items collected throughout the ICC’s entire 41-year history.
But where do those bottles really come from? We know rivers carry plastics of all shapes and sizes from inland communities to coasts and the ocean. What we know far less about is what makes plastic bottles move within rivers, what speeds them up or slows them down and how likely they are to reach the coast and become ocean pollution. Research on river plastics is growing worldwide, but studies in North America lag behind other regions.
Ocean Conservancy scientists, alongside a team of collaborators from 10 research institutions around the United States and Canada, set out to help close some of these pressing knowledge gaps.
How do you track a plastic bottle?
… with a little help from GPS! We modeled our research after a 2021 project in the Toronto Harbor conducted by our University of Toronto colleagues. Like the Toronto project, our research team outfitted floating plastic bottles with GPS tags that reported each bottle’s location at regular intervals. That let us calculate how far and how fast every bottle traveled. Over a two-year period, we released about 300 GPS-tagged bottles into 30 stretches of river in Los Angeles, California; California’s San Francisco Bay Area; Chicago, Illinois; Washington, D.C.; Miami, Florida; Boston, Massachusetts; and Toronto, Canada.
We chose each of these places on purpose.
The locations were selected to represent varied watershed types (ranging from temperate to subtropical climates and mountainous to flat terrain) and development intensity (suburban to densely urban). We followed the bottles for about three months each, through changing seasons, storms and rainfall before locating and retrieving them. And while the plan was always to recover the bottles at the end of the experiment, we also conducted cleanups in each watershed beforehand to make sure we were leaving things a little cleaner than we started.
What did we find?
Our bottles went on quite a journey! On average, each bottle traveled 3.8 miles, but distance traveled actually spanned a huge range depending on the bottle and location. For example, one of our bottles barely budged, moving just 240 feet over the deployment period. Another made it further than the length of a marathon, clocking in at 33 miles traveled.
We found river flow was a major driver of how far bottles went, but it wasn’t the only factor—the landscape around each river mattered too. Patterns in bottle movement revealed:
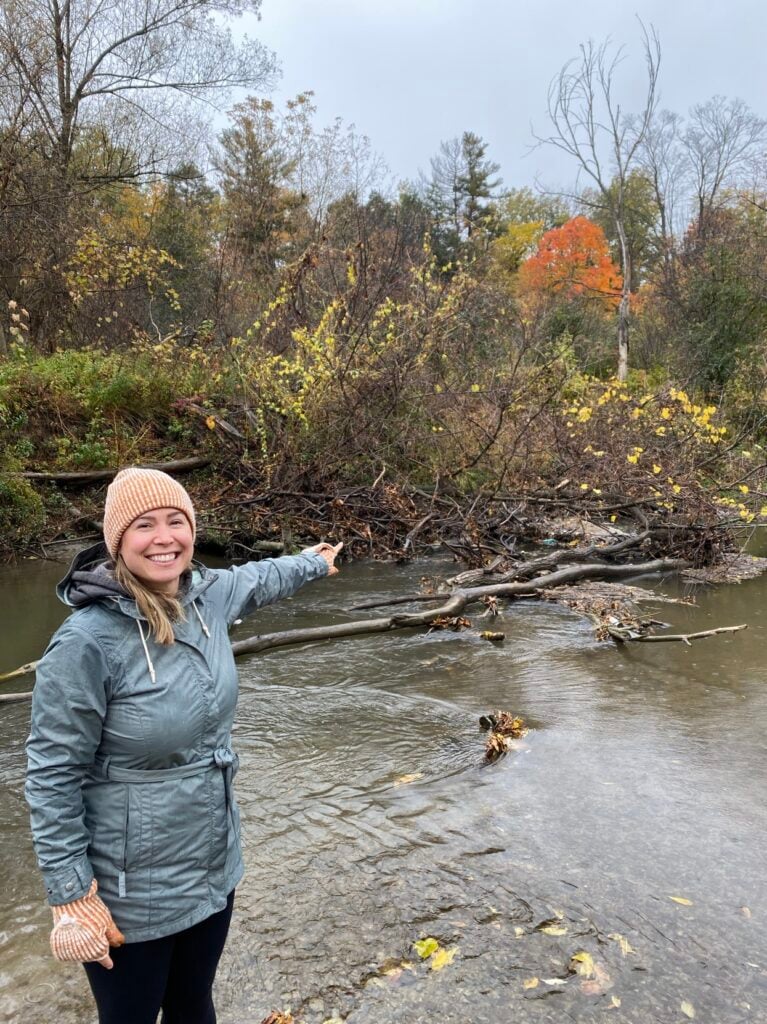
- Forest and vegetation in rivers slowed bottles down. The more forest cover upstream, the less likely a bottle was to reach the coast, because it got snagged in brush, branches and other natural obstructions.
- More urbanized stretches sped them up. Bottles moved farther and faster in more urbanized stretches of river, where there was typically less vegetation to catch them.
Using thousands of GPS points, as well as data about the river systems and watersheds we studied, we built a model to estimate where bottles reaching the coast or the Great Lakes may be coming from. It showed that within a one-year period, about half originate quite close to shore (within seven miles). The other half come from much farther inland, up to 120 miles away!
Why does this matter for our ocean?
Plastic bottles aren’t just unsightly. Ocean Conservancy’s recent, award-winning research found they can be deadly to marine life—either as whole items or after they break up into sharp fragments. There have been documented instances of seabirds like albatross dying after swallowing a plastic bottle whole.
Plastic bottles are among the most prolific plastic pollutants we see out there, and now we understand that many of those we find on beaches or in the ocean may be coming from far upstream.
That has big implications for how we tackle the problem. If half of the bottles reaching the ocean around North America or Great Lakes can start their trip more than 100 miles inland, prevention must happen upstream. Pollution-prevention models, like laws that incentivize the collection and recycling of plastic bottles before they end up in the environment, should be implemented more broadly to prevent plastic from becoming pollution in the first place. Cleanups and other efforts in coastal communities also remain critical. If we want to capture floating plastics like bottles before they reach the coast and eventually our ocean, communities within 120 miles from the ocean or Great Lakes should plan to do those cleanups on an annual basis, or even more frequently.
How can I help keep plastic bottles out of rivers and the ocean?
No matter where you live, the choices you make can help keep plastic out of the ocean:
- Support policies, like those Ocean Conservancy advocates, to stop plastic pollution at the source.
- Join a cleanup along your local river, creek or lakeshore. Every bottle picked up inland is one less that can wash out to sea.
- Choose reusables instead of single-use plastic bottles whenever you can.
We want to extend a huge thank-you to our amazing collaborators on this project at the University of New Hampshire, University of Toronto, Loyola University of Chicago, Smithsonian Environmental Research Center, Florida International University, Moore Institute for Plastic Pollution Research, San Francisco Estuary Institute, University of Waterloo, University of Southern California and University of New Mexico.
Our study, “GPS-Tracked Bottles in North American Rivers Show Marine Plastic Pollution Can Originate from Far Upstream,” was published in the November 13 issue of the scientific journal Environmental Science & Technology-Water. Read the full paper here.
This blog was co-written with Hannah De Frond. Hannah works with Ocean Conservancy and the University of Toronto Trash Team to manage the International Trash Trap Network (ITTN), a global network of local groups using trash traps to increase cleanup efforts, engage communities and inform upstream solutions.
Get Ocean Updates in Your Inbox
Sign up with your email and never miss an update.
The post How Far Does a Plastic Bottle Really Travel in a Year? appeared first on Ocean Conservancy.
If you’ve ever joined a beach cleanup, you’ve almost certainly picked up a plastic bottle. During Ocean Conservancy’s 2025 International Coastal Cleanup® (ICC), plastic beverage bottles were the top item collected by volunteers around the world. Plastic bottles have been among the top 10 items collected throughout the ICC’s entire 41-year history.
But where do those bottles really come from? We know rivers carry plastics of all shapes and sizes from inland communities to coasts and the ocean. What we know far less about is what makes plastic bottles move within rivers, what speeds them up or slows them down and how likely they are to reach the coast and become ocean pollution. Research on river plastics is growing worldwide, but studies in North America lag behind other regions.
Ocean Conservancy scientists, alongside a team of collaborators from 10 research institutions around the United States and Canada, set out to help close some of these pressing knowledge gaps.
How do you track a plastic bottle?
… with a little help from GPS! We modeled our research after a 2021 project in the Toronto Harbor conducted by our University of Toronto colleagues. Like the Toronto project, our research team outfitted floating plastic bottles with GPS tags that reported each bottle’s location at regular intervals. That let us calculate how far and how fast every bottle traveled. Over a two-year period, we released about 300 GPS-tagged bottles into 30 stretches of river in Los Angeles, California; California’s San Francisco Bay Area; Chicago, Illinois; Washington, D.C.; Miami, Florida; Boston, Massachusetts; and Toronto, Canada.
We chose each of these places on purpose.
The locations were selected to represent varied watershed types (ranging from temperate to subtropical climates and mountainous to flat terrain) and development intensity (suburban to densely urban). We followed the bottles for about three months each, t