
Welcome to Carbon Brief’s China Briefing.
China Briefing handpicks and explains the most important climate and energy stories from China over the past fortnight. Subscribe for free here.
Key developments
China’s first-ever pledge to cut emissions
NEW CLIMATE TARGETS: In a video address to the UN last week, China’s president Xi Jinping personally pledged to cut his nation’s economy-wide greenhouse gas emissions to 7-10% below peak levels by 2035, while “striving to do better”, reported state broadcaster CCTV. Sky News called it a “landmark moment”, saying that this marked the first time China “made a commitment to cut its greenhouse gas emissions”. The announced target, along with other commitments such as expanding wind and solar power capacity to more than six times 2020 levels, will be included in China’s 2035 “nationally determined contribution” (NDC) under the Paris Agreement, which has not yet been submitted, reported BBC News. Carbon Brief published a detailed analysis of the announcement and hosted a webinar with climate policy experts to discuss their assessments. More details of the webinar can be found below.

AMBITION CRITICISM: In an article for Just Security, Sue Biniaz, former US principal deputy special envoy for climate, wrote that “at and around the UN event, the chatter regarding the announcement was generally negative”, adding that the announced target was “even lower than expected”. EU climate chief Wopke Hoekstra described China’s new climate pledge as falling “well short of what we believe is both achievable and necessary”, reported Reuters. In response, China accused the EU of “being slow to act on its own climate targets”, according to another Reuters report. The outlet said that Hoekstra’s “criticism of China’s new climate pledges shows ‘double standards and selective blindness’, China’s foreign ministry said on Friday”.
-
Sign up to Carbon Brief’s free “China Briefing” email newsletter. All you need to know about the latest developments relating to China and climate change. Sent to your inbox every Thursday.
MEDIA REACTION: Media outlets including the Guardian and the Times raised questions about the ambition of the target. Similarly, Bloomberg said it was “seen as too modest to put the nation on a path to net-zero and galvanise global climate action”. An editorial in state-run newspaper China Daily, however, called the target a “milestone in the nation’s long-term road map toward green, low-carbon development”. Li Shuo, director of the China Climate Hub at the Asia Society Policy Institute, wrote in a comment for the New York Times that China’s targets “may seem tepid”, but “beneath them is a bold wager: that steady action, powered by industrial strength and vision shielded from political volatility, will ultimately do more to contribute to the global climate effort than lofty, fickle promises ever could”.
Electricity demand growth slowed
PRESSURE DROP: The rate of growth in China’s electricity demand slowed in August, with “cooler” weather helping to “take some pressure off the grid”, reported Bloomberg, citing official data. The outlet added that electricity consumption rose 5% in August, compared with 8.6% in July and 5.4% in June. Still, China’s electricity demand in both July and August exceeded 1,000 terawatt hours – the first time this happened globally, said Chinese finance media outlet Cailianpress. According to a report by the China Electricity Council, China’s “electrification rate” has already surpassed that of “major developed economies in Europe and the US”, wrote China Energy Net.
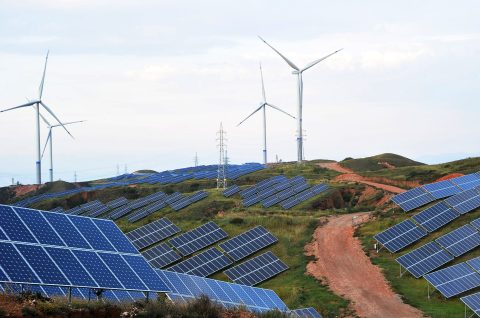
MARKET PRICE: Two coastal provinces, Guangdong and Shandong, have used China’s new market-based pricing system for renewables to “steer clean-energy investment to the areas that suit them best, reported Bloomberg. According to the outlet, Guangdong, which is “surrounded by relatively shallow waters”, offered “generous rates to offshore wind”. In Shandong, the pricing system was used to “correct course and reduce a glut of solar power that has built up over the years”, added the outlet.
Steel to face new controls
CAPACITY CURBS: China has released a work plan for 2025-26 to “ban new steel capacity and reduce production, in the latest move to help balance supply and demand”, reported Bloomberg. The plan came after Beijing promised to cut steel output at the Two Sessions in March, according to the outlet. It also called for “significantly enhancing green, low-carbon and digital development levels” of the country’s steel sector, according to the industry news outlet BJX News. Financial media outlet Caixin said “more than 80% of China’s crude steel production capacity has completed ultra-low-emission retrofits, according to the China Iron and Steel Association”.
ETS EXPANSION: Meanwhile, the Ministry of Ecology and Environment issued draft allowance plans for the steel, cement and aluminium sectors for 2024 and 2025 in its national emissions trading scheme (ETS), reported Cailian Press. (The ETS was expanded to these sectors from 2024 in a draft policy, published late last year and covered by Carbon Brief. The expansion, which means that the ETS covers 60% of China’s emissions, rather than 40% previously, was confirmed in March.) Meanwhile, a report published by the State Council said that a total of 189m tonnes of carbon dioxide was traded on the ETS in 2024, according to Xinhua.
Typhoon Ragasa
DAMAGES IN ASIA: Nearly two million people in southern China had to be “relocated” after Typhoon Ragasa made landfall in Guangdong province last Wednesday, reported state news agency Xinhua. BBC News described the typhoon as the “world’s strongest storm this year” and said “a month’s worth of rain” was expected in the city of Zhuhai in one day. In the wider Asia-Pacific region, dozens of people were killed, while flights as well as businesses were also strongly affected, said the Financial Times.
CLIMATE CHANGE: Ragasa was intensified by “unusually hot oceans”, which can be linked to climate change, according to “preliminary studies” covered by the Hong Kong Free Press. “Rapid attribution” analysis by the French research group ClimaMeter concluded that cyclones such as Ragasa are around 10% wetter than they would have been in the past, added the outlet. Benjamin Horton, dean of the school of energy and environment at City University of Hong Kong, also linked Ragasa to climate change, saying extreme weather events “should not be happening at such regularity, so late in the season, of such intensity, of such high winds and of such big storm surges”, according to the SCMP.
40%
The share of China’s total solar capacity in 2024 made up by distributed photovoltaics – typically installed on rooftops – according to a report from the International Energy Agency, which said the share was up from 30% four years earlier. The report added that the “stock of electric cars grew by more than 650% over the same period”.
Spotlight
Experts: What China’s new climate pledge means for the world
Last week, president Xi Jinping announced several new pledges that will be included in China’s upcoming 2035 nationally determined contribution (NDC).
Carbon Brief held a webinar with several experts on what the new announcement means for China’s climate trajectory and the global energy transition. Below are the highlights of their answers. A recording of the webinar is available on the Carbon Brief website.
Ryna Cui, associate director and associate research professor at the University of Maryland Center for Global Sustainability
Our assessment of a plausible high ambition pathway for China [showed it] delivering a 27-31% reduction in total greenhouse gas emissions by 2035…In addition, we also model[led] a current policy pathway for China, which…also achieve[d] a 10-14% reduction…Both scenarios suggest a larger reduction compared to the 7-10% overall emission reduction target.
…
Under our current policy scenario for 2035, wind and solar total installed capacity is over 4,000 gigawatt (GW). It is over 4,700 gigawatt under a high ambition [scenario]. [The target announced by Xi is for 3,600GW by 2035.]
…
The non-fossil share of total primary energy…is 40% [under current policies] and 48% [under high ambition], compared to the 30% target announced [by Xi].
Lauri Myllyvirta, lead analyst and co-founder at the Centre for Research on Energy and Clean Air
At [China’s] rate of clean-energy growth, there is no more space for…coal, in general, to grow. So if you were to announce targets of 20-30% reduction in carbon dioxide, then you have to recognise that there’s going to be a major downsizing of the coal industry.
That seems to be a decision that China’s leadership is still postponing. Are you going to put reins on this clean-energy boom, or are you going to accept that the coal industry has to start downsizing in a big way?
…
These targets really, to me, show that the leadership was not prepared to resolve that conflict and say that coal is the one that has to give.
Anika Patel, China analyst at Carbon Brief
[In terms of what’s next,] one of the big signals…is COP30. What else will be announced that could signal China’s relative level of climate ambition?
Will there be quantitative targets placed on things like climate finance?…Will there be more announcements around south-south cooperation? What will China’s signaling on fossil fuels – especially coal – in the final COP30 outcome be?
…
At the same time, we’ve got the 15th five-year plan coming up…We’re expecting a new set of overarching targets for 2026-2030, and traditionally there have always been a couple of climate targets [among the plan’s headline targets]. From that, we can expect to start seeing signals about what the level of climate ambition for the next five years will be.
Li Shuo, director of the China Climate Hub at the Asia Society Policy Institute
There has been a very strong alignment now in the Chinese system between its decarbonisation goals and its economic development agenda…I think that strong alignment is what will propel the country to cut more carbon over time.
I also think that when you begin to realise [that]…you will then begin to realise it is not necessarily just the [state-level] EU-China climate relationship…[or] COPs that we should pay attention to. New actors are emerging.
We need to pay attention to BYD [and] CATL. We need to pay attention to [low-carbon commercial and investment activity in] Brazil…[and] Indonesia. Those factors and actors, over the next ten years or so, will begin to drive carbon-emission reduction in a more significant and meaningful way than countries’ NDCs.
Watch, read, listen
‘NEW ENERGY’: A comment on the “high-quality development” of China’s “new energy” sector was published by the Communist party’s Study Times – an official newspaper edited by the central school of the Chinese Communist party – under the byline of Wang Hongzhi, head of the National Energy Administration.
HIGH-LEVEL COMMENT: The Communist party-affiliated newspaper People’s Daily published an article under the byline Zhong Caiwen, used to indicate party leaders’ views on economic affairs, saying “green development is the defining feature of China’s high-quality economic growth”.
EXTREME WEATHER: Chinese media outlet 21st Century Business Herald conducted an interview with Xu Xiaofeng, former deputy director of the China Meteorological Administration and president of the China Meteorological Service Association, who talked about the “high intensity of extreme weather events” under climate change.
CARBON MARKETS: Ma Aimin, former deputy director of the National Centre for Climate Change Strategy and International Cooperation, told Jiemian that China’s carbon market (ETS) needed to enhance its “trading activity” and that the next two years will be a “critical period” for voluntary carbon trading (CCERs).
New science
Development policy affects coastal flood exposure in China more than sea-level rise
Nature Climate Change
Exposure to coastal flooding in China over the 21st century will depend more on “policy decisions” than the rate of sea-level rise, according to new research. The authors combined simulations of population and land use changes with flood models that incorporate factors such as sea level rise and storm surges. They said their paper offers a “more nuanced understanding of coastal risks” than other existing assessments.
Spatiotemporal patterns and drivers of wildfire CO2 emissions in China from 2001 to 2022
Atmospheric Chemistry and Physics
Annual CO2 emissions from forest and shrub fires in China decreased over 2001-22, but increased for cropland fires, a new study found. The analysis noted that the upward trend in cropland fire emissions is primarily in the country’s north-east and is “closely linked to region-specific straw-burning policies”. The researchers found that emissions from grassland fires remained relatively stable over the two decades assessed.
China Briefing is compiled by Wanyuan Song and Anika Patel. It is edited by Wanyuan Song and Dr Simon Evans. Please send tips and feedback to china@carbonbrief.org

The post China Briefing 2 October 2025: China’s new pledge; electricity demand slows; steel overcapacity appeared first on Carbon Brief.
China Briefing 2 October 2025: China’s new pledge; electricity demand slows; steel overcapacity
Andreas Sieber is head of political strategy at 350.0g. Cat Abreu is director of the International Climate Politics Hub.
From the US abduction of Venezuela’s president at the start of this year to the Iran war which rumbles on, disruption is the new normal for global geopolitics, more often than not linked to conflict over supplies of oil and gas.
Events so far in 2026 – driven largely by the desire of the Trump administration to grab control of fossil fuels around the world – show that the climate community’s approach to energy diplomacy will have to evolve if we are to operate effectively and push for climate action in such a volatile landscape.
Today’s climate and energy governance must be able to cope with trade wars, genocide, fascism, spiralling inequality and challenges to multilateralism. The increasingly dominant paradigms of economic competitiveness, energy security and green industrialisation can help drive the transition but they also challenge our collective mission to deliver an equitable green shift.
US-China rivalry dominates
Longer-term geopolitical trends that are seeing power move from West to East and North to South have fuelled a US–China “superpower rivalry”, which is pulling the global economy apart and reining in trade.
A key question will be how the fracture “lines” are drawn: by the US and China, or also by other countries or blocs? Many governments will try to remain “in the middle” between the two giants to capture economic gains from both sides. Yet despite the language of “strategic autonomy”, Washington and Beijing may be in a position to force choices via market access, export controls and sanctions.
-
Top maritime court rejects bid to halt UN deep-sea mining inquiry
Two subsidiaries of The Metals Company sought to block the probe into potential contract breaches launched after the firm’s application for US-sponsored permits

At first glance, this may not seem particularly relevant for climate and energy politics. But Huawei’s exclusion from 5G operations across the political West and India following the so-called Clean Network Campaign by the US government serves as a warning of what could happen to climate green tech.
And the recent debate to cut out Chinese inverters from European markets follows the same pattern – US security forces perceive a risk and start encouraging their allies to drop Chinese technology.
The new drivers: competition and security
Despite this fracturing geopolitical and economic context, energy transition is still happening. To ensure it is effective and equitable, we need to understand what is driving it and how to adapt climate politics so that it better responds to these drivers.
Put simply, China is supplying the world with low-cost renewables (roughly 60% of critical wind and 80% of solar components), batteries, EVs and other key elements. Other countries now also want their piece of the green tech pie and are forming industrial policies to get it.
It is this new competitiveness-driven logic that will shape the quest for decarbonisation, which has shifted from cooperating around the cost of tackling climate change to rivalry for the benefits of climate action.
Over 90% of new renewables projects are now cheaper than fossil alternatives. Gas-fired power is 3–4 times more expensive than solar and wind. In 2015, most decarbonisation policies were “traditional” emissions-cutting strategies like carbon pricing or net zero dates, whereas green industrial policies now underpin the majority.
Iran war could boost fossil fuel phase-out push, says Colombian minister
Meanwhile, security has become a central driver of energy politics. We are living through the second major fossil fuel crisis in just four years. Elevated oil and gas prices will impose up to $1 trillion in additional costs on the global economy by the end of the year if disruption continues in the Strait of Hormuz. Fossil fuel supply chains have exposed countries to conflict, coercion and brutal price shocks.
Fossil fuel volatility destabilises whole economies – higher fuel costs drive up food prices, increase political instability, and push millions into poverty and hunger. This incentivises governments to shield themselves from global shocks, especially in countries that are net fossil fuel importers and home to roughly three-quarters of the world’s population.
Yet security fears can cut both ways. The same instability that makes fossil fuel dependence untenable is also sharpening concern over China’s dominance of critical clean technologies and supply chains.
Equity, cooperation and the opportunity for change
Developing countries benefit from the rapid uptake of renewables enabled by low-cost Chinese technologies. But significant fiscal space and public investment is needed for the electricity grids and infrastructure required to fully unleash the energy transition, as well as for green industrialisation to diversify revenue streams.
Despite this, industrial-scale domestic production and ownership often remain out of reach for too many countries that lack the fiscal space to allow green supply chains to flourish and compete with their traditional industrial base. But more just and diversified green tech supply chains could be achieved with concomitant support.
Can giant batteries unlock Africa’s green industrial future?
For the first time in decades, the international order is being substantially reshaped. If within this context, decarbonisation is increasingly driven by green industrial policy, energy security and competitiveness, the climate policy community must better anticipate where these debates are moving. We must speak the same language, and enter the forums where decisions are made, including security, trade and bilateral or trilateral spaces.
We should build on an enlightened self interest recognising that cooperation remains essential and beneficial. This includes using the UN climate process differently: less as an ever-expanding negotiation machine, and more as a space for norm-setting, political alignment and deal-making. In an age of fragmentation, effective cooperation must not only be framed as necessary but thought of as a strategically compelling source of resilience and shared advantage.
The post Energy transition policymaking must evolve to fit an age of rupture appeared first on Climate Home News.
Energy transition policymaking must evolve to fit an age of rupture
Low-income Indian workers, many of them migrants from rural areas hit by climate change, are paying for worsening extreme heat through lost working days and health complications, with the cost equivalent to 2% of national GDP per year, new research shows.
The International Institute of Environment and Development (IIED), a London-based think-tank, worked with local organisations to survey around 540 households of informal workers in three Indian cities: Ajmer, Delhi and Agra. Most had migrated from rural areas to find work in industries such as construction, brick-making, garment manufacturing and food packaging.
The survey found them struggling through long working days with little access to shade, cooling, rest or water, as well as few toilets for women. And even when they go home, many live in makeshift shelters or airless cramped rooms with barely a single fan, bringing almost no respite.
Outdoor workers are losing about 24 days of work a year due to heat, costing them nearly a tenth of their annual earnings, while indoor workers sacrifice roughly 15 days. On top of losing income, they are also bearing the cost of health problems like heat exhaustion, psychological stress and kidney damage brought on by repeated dehydration.
If the survey’s findings are extrapolated to a national level, the IIED researchers estimate that the decline in productivity and effects of kidney disease combined add up to lost wages of $78 billion each year.
-
Top maritime court rejects bid to halt UN deep-sea mining inquiry
Two subsidiaries of The Metals Company sought to block the probe into potential contract breaches launched after the firm’s application for US-sponsored permits -
Most “zombie credits” locked out of new UN carbon market after China and India snub
Fears of a flood of environmentally-dubious carbon credits have faded, with most old projects not able to transition to new UN market

Vishram Meena, 45, from Alwar in Rajasthan, has worked on construction sites in Ajmer for more than a decade, toiling for 10 to 12 hours a day carrying materials and mixing cement in the full sun.
In May 2024, on one of the hottest days, he collapsed after feeling dizzy and suffering a nosebleed. His wife and colleagues managed to get him to hospital where he was diagnosed with heat stroke. He has since returned to the same building work because the family needs the money.
“I went back because what else could I do? We are not machines. We are human beings. The heat is killing us slowly,” he was quoted as saying in a report on the survey’s findings.
“Victorian-era” conditions
Ritu Bharadwaj, IIED’s director of climate resilience, finance and loss and damage, described some of the stories from workers about their experiences of extreme heat as “genuinely horrifying”.
Kusum, a tailor at a garment manufacturing and export unit in Kapashera, Delhi, recounted how the machines for ironing finished garments are in the same tiny room where workers are making the clothes, with steam and hot air building up through her shift.
Fans are too far apart to move the air and nothing has changed in over a decade, she said, adding that “in summer, the unit feels like a furnace”.
“These are Victorian-era working conditions and they’re completely unacceptable in the 21st century,” said Bharadwaj. She called for stepped-up social protection from the government to pay people for days they are unable work due to heat, as well as micro-insurance schemes with payouts triggered by temperature measurements.
This money would help families buy food and pay medical bills when their income dips if they fall ill or cannot work their usual hours due to soaring temperatures.
Climate change-driven heatwaves hit Delhi’s Red Fort market traders
The aim of the IIED study, Bharadwaj added, is to get policy-makers’ attention by showing the scale of damage extreme heat is doing to India’s GDP in an economy whose growth relies on service-led industries. “If the workers within them start falling sick, you know it’s the economic growth which is going to get impacted,” she told a webinar to present the research.
“Whether [policymakers] care about the workers or not, at least they would care about the GDP, and therefore then invest in their care,” she explained.
Labour code leaves out heat
However, Bharadwaj noted that a 2026 reform to India’s labour law bringing a range of regulations together in one code does not include heat-related protections for workers and only applies to businesses above a certain size. She urged the government to introduce a temperature threshold above which all workers would be able to stop their activities.
IIED and its partners have also carried out a similar study in Bangladesh which will be published later this month, showing that extreme heat is costing its workforce the equivalent of nearly 1.4% of GDP.
Shakirul Islam, chairperson of the Ovibashi Karmi Unnayan Program (OKUP) in Bangladesh, said the government had introduced stricter safety policies for garment-making companies after the Rana Plaza complex collapsed in 2013. But, he said, these rules are rarely followed by manufacturers, especially at the level of smaller subcontractors.
The workers’ welfare centres that do exist are open mainly during work hours so they are difficult to visit. Some companies also make saline water available for heat stress, which is no good for those with high blood pressure, he noted.
For Indian women workers, a just transition means surviving climate impacts with dignity
Archana Shukla Mukherjee, CEO of India’s Change Alliance, which also partnered with IIED on the survey, said it was time to hold both the government and businesses accountable for finding solutions to the intensifying problem of extreme heat’s effects on workers.
She said that employee state insurance schemes should identify heat stroke as an occupational disease while companies along the whole supply chain should start putting in place heat protection measures, including for informal workers and migrants.
If the tools and mechanisms available to help workers do not reach the most vulnerable and marginalised people, “then I think we are not doing something right,” she said.
The post Extreme heat costing India’s poorest workers 2% of GDP, survey finds appeared first on Climate Home News.
Extreme heat costing India’s poorest workers 2% of GDP, survey finds
A United Nations investigation into deep-sea mining firms will continue after the world’s top maritime court rejected their bid to suspend the inquiry triggered by a US-backed push to extract critical minerals from the ocean floor.
In two orders issued on Saturday, the International Tribunal for the Law of the Sea (ITLOS) declined to halt an inquiry launched by the International Seabed Authority (ISA) into whether permit holders, including Tonga Offshore Mining Ltd (TOML) and Nauru Ocean Resources Inc (NORI), have breached their obligations under UN exploration contracts.
The two companies are subsidiaries of Canadian firm The Metals Company (TMC), which earlier this year sought permits from the United States to commercially mine the deep seabed in an area already covered by its UN exploration licences, bypassing the ISA’s regulatory process.
The inquiry was opened after TMC’s move raised questions over whether its subsidiaries had complied with their contractual obligations to the ISA, which regulates mining in international waters under the UN Convention on the Law of the Sea. TOML and NORI sued the ISA last June for allegedly targeting them “in breach of due process” and without “good faith”.
-
UN seabed regulator defends authority as mining firms seek to halt inquiry
Campaigners accused deep-sea mining frontrunner The Metals Company of obstructing an inquiry into its subsidiaries. The firm says it is being targeted without procedural basis -
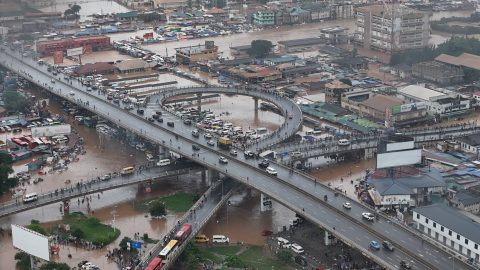
Flood deaths in West African cities raise fraught issue of slum evictions
Deadly floods expose poor urban planning, over-population and spread of informal settlements on disaster-prone land – a problem authorities are struggling to manage -
Most “zombie credits” locked out of new UN carbon market after China and India snub
Fears of a flood of environmentally-dubious carbon credits have faded, with most old projects not able to transition to new UN market


While allowing the inquiry to proceed, the court ordered the ISA to ensure the companies receive due process. Judges said the regulator must explain the factual and legal basis of its inquiry, clarify the procedures being followed and provide TOML and NORI with a meaningful opportunity to respond.
The companies seeks to mine an area called the Clarion-Clipperton Zone, which holds vast reserves of critical minerals like nickel, manganese and rare earths but is also home to a little-studied deep ocean ecosystem with thousands of unnamed species.
In response to the court’s ruling, the ISA welcomed the decision, saying the inquiry “remains in effect” and would continue “with due regard to all applicable legal requirements”.
Last week, during an annual meeting of its member governments, ISA secretary-general Leticia Carvalho said the resources in the ocean floor are “the common heritage of humankind” and upheld the agency’s role as “more important than ever”.
TMC also welcomed the court decision in a statement and claimed that judges ruled to “protect the rights of TMC subsidiaries”.
“Contractors like NORI and TOML, who have together spent hundreds of millions of dollars on the promise of a fair regulatory framework, should be informed of the factual and legal basis of any non-compliance inquiries, understand the procedure being applied, and receive a meaningful opportunity to respond,” said Gerard Barron, CEO of The Metals Company.

Environmental groups said the ruling allows scrutiny of the companies’ actions to continue.
Louisa Casson, deep-sea mining campaigner with Greenpeace, said the “entire litigation has been an egregious waste of time and money”, which was part of the industry’s “textbook distraction tactic” meant to delay the consequences of the inquiry.
“If the inquiry confirms that TMC’s subsidiaries are breaching their contracts, governments must send the strongest possible signal that complicity in unlawful deep sea mining will not be tolerated,” she said.
While investigation is still ongoing, NORI’s contract is set to expire this week and is up for review. Governments asked the ISA to report back and make “make appropriate recommendations” by the next ISA assembly, its main decision-making body set to take place next week from July 27 to 31.
The court ordered both the ISA and TMC to submit a report on how they complied with the ruling by August 31, and called on both to “cooperate and refrain from any action that might lead to
aggravating the dispute”.
The post Top maritime court rejects bid to halt UN deep-sea mining inquiry appeared first on Climate Home News.
Top maritime court rejects bid to halt UN deep-sea mining inquiry


-
Climate Change11 months ago
Guest post: Why China is still building new coal – and when it might stop
-
Greenhouse Gases11 months ago
Guest post: Why China is still building new coal – and when it might stop
-

 Greenhouse Gases2 years ago
嘉宾来稿:满足中国增长的用电需求 光伏加储能“比新建煤电更实惠”
-

 Climate Change2 years ago
嘉宾来稿:满足中国增长的用电需求 光伏加储能“比新建煤电更实惠”
-
Climate Change2 years ago
Bill Discounting Climate Change in Florida’s Energy Policy Awaits DeSantis’ Approval
-

 Renewable Energy9 months ago
Sending Progressive Philanthropist George Soros to Prison?
-

 Carbon Footprint2 years ago
US SEC’s Climate Disclosure Rules Spur Renewed Interest in Carbon Credits
-
Greenhouse Gases1 year ago
嘉宾来稿:探究火山喷发如何影响气候预测