
CCL Monterey was one of many chapters who planned or participated in a special ‘Sun Day’ outreach event in September 2025.
Celebrating clean power and community outreach on Sun Day
By Flannery Winchester
CCL chapters around the country have been busy with outreach this fall. Lots of this outreach rode the wave of public enthusiasm for “Sun Day” — a nationwide day of action celebrating and educating people about the power of clean energy.
Our volunteers’ creativity and enthusiasm shined as brightly as ever at these local events.
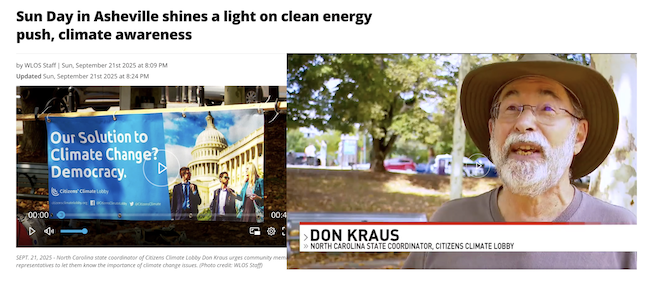
Rally gets TV time in Asheville
Twelve CCL volunteers from CCL’s Western North Carolina chapter tabled and clipboarded at the Asheville Rally for Clean Energy at the local Pack Square Pavilion. “We had a great day!” says Don Kraus, WNC chapter leader and CCL State Coordinator for North Carolina. “We collected 84 constituent comment forms with 19 new members joining.”
Don gave a 7-minute speech at the event and even had the opportunity to give a short TV interview to Asheville’s WLOS. “This was a case of ‘right place, right time’ — and being willing to say hello to the camera man!” Don jokes. “Since I had just done my speech, I had my talking points down.”
Climate community turned out in Monterey
CCL’s Monterey chapter in California felt so inspired by the Sun Day concept that they organized their own event for their community.
 “We had 12 different groups join us on Monterey’s Window on the Bay park, including solar contractors, heat pump installers, environmental groups, advocacy groups and a church,” said chapter co-leader David Prina. “We had a good turn out with kids activities, music, a choral performance and face painter.”
A local TV station, KSBW, attended and interviewed David and chapter member Sandy Hoag, who was quoted in the broadcast speaking about the steadily decreasing prices for solar energy. David said on air, “Sun Day is a day of support for a healthier, more affordable future where solar and renewables are a big part of the grid.”
“We’re glad we did it!” David said. “We had a great time organizing this in a very short two months, and we felt like the community here in Monterey showed up in support.”
Palouse plugs in
CCL Palouse, which serves a region stretching into Idaho and Washington, hosted an Electric Transportation Fair on Sun Day.

Chloe and Aspen
“Local dealerships and our members brought a range of EVs and hybrids, and a bike shop brought a wide selection of electric bikes to share with the public,” shares chapter co-leader Judy Meuth. “We provided information about the vehicles and about the federal tax credits immediately available. Live music, food trucks, and kids activities rounded out the event. A couple hundred people showed up to learn and play!”
From Sun Day to the district office

Betsy and Nancy
CCL Reno tabled at their local Sun Day Solar Festival, where chapter members Chloe, Aspen, Brian, Janet, Betsy and Michelle greeted festival-goers with a smile and gathered 29 constituent letters. Chloe is a recent graduate from University of Nevada – Reno who has attended several of CCL’s events on Capitol Hill in D.C., and Aspen is one of CCL Reno’s newest members.
At their monthly chapter meeting, CCL Reno gathered three more letters, for a total of 32. Chapter members Betsy and Nancy then delivered the letters to the district office of Rep. Mark Amodei (R-NV-02). (Shout out to Betsy for founding CCL’s Reno chapter nearly 10 years ago!)
This is one of the key ingredients in CCL’s secret sauce — in addition to building all of these community connections around climate change, we also bring those community voices directly to lawmakers, building more and more support for positive change.
The post Celebrating clean power and community outreach on Sun Day appeared first on Citizens' Climate Lobby.
Greenhouse Gases
DeBriefed 12 December: EU under ‘pressure’; ‘Unusual warmth’ explained; Rise of climate boardgames
Welcome to Carbon Brief’s DeBriefed.
An essential guide to the week’s key developments relating to climate change.
This week
EU sets 2040 goal
CUT CRUNCHED: The EU agreed on a legally binding target to reduce greenhouse gas emissions by 90% from 1990 levels by 2040, reported the EU Observer. The publication said that this agreement is “weaker” than the European Commission’s original proposal as it allows for up to five percentage points of a country’s cuts to be achieved by the use of foreign carbon credits. Even in its weakened form, the goal is “more ambitious than most other major economies’ pledges”, according to Reuters.
PETROL CAR U-TURN: Commission president Ursula von der Leyen has agreed to “roll back an imminent ban on the sale of new internal combustion-engined cars and vans after late-night negotiations with the leader of the conservative European People’s Party,” reported Euractiv. Car makers will be able to continue selling models with internal combustion engines as long as they reduce emissions on average by 90% by 2035, down from a previously mandated 100% cut. Bloomberg reported that the EU is “weighing a five-year reprieve” to “allow an extension of the use of the combustion engine until 2040 in plug-in hybrids and electric vehicles that include a fuel-powered range extender”.
CORPORATE PRESSURE: Reuters reported that EU countries and the European parliament struck a deal to “cut corporate sustainability laws, after months of pressure from companies and governments”. It noted that the changes exempt businesses with fewer than 1,000 employees from reporting their environmental and social impact under the corporate sustainability reporting directive. The Guardian wrote that the commission is also considering a rollback of environment rules that could see datacentres, artificial intelligence (AI) gigafactories and affordable housing become exempt from mandatory environmental impact assessments.
Around the world
- EXXON BACKPEDALS: The Financial Times reported on ExxonMobil’s plans to “slash low-carbon spending by a third”, amounting to a reduction of $10bn over the next 5 years.
- VERY HOT: 2025 is “virtually certain” to be the second or third-hottest year on record, according to data from the EU’s Copernicus Climate Change Service, covered by the Guardian. It reported that global temperatures from January-November were, on average, 1.48C hotter than preindustrial levels.
- WEBSITE WIPE: Grist reported that the US Environmental Protection Agency has erased references to the human causes of climate change from its website, focusing instead on “natural processes”, such as variations in the Earth’s orbit. On BlueSky, Carbon Brief contributing editor Dr Zack Labe described the removal as “absolutely awful”.
- UN REPORT: The latest global environment outlook, a largest-of-its-kind UN environment report, “calls for a new approach to jointly tackle the most pressing environmental issues including climate change and biodiversity loss”, according to the Associated Press. However, report co-chair Sir Robert Watson told BBC News that a “small number of countries…hijacked the process”, diluting its potential impact.
$80bn
The amount that Chinese firms have committed to clean technology investments overseas in the past year, according to Reuters.
Latest climate research
- Increases in heavy rainfall and flooding driven by fossil-fuelled climate change worsened recent floods in Asia | World Weather Attribution
- Human-caused climate change played a “substantial role” in driving wildfires and subsequent smoke concentrations in the western US between 1992-2020 | Proceedings of the National Academy of Sciences
- Thousands of land vertebrate species over the coming decades will face extreme heat and “unsuitable habitats” throughout “most, or even all” of their current ranges | Global Change Biology
(For more, see Carbon Brief’s in-depth daily summaries of the top climate news stories on Monday, Tuesday, Wednesday, Thursday and Friday.)
Captured
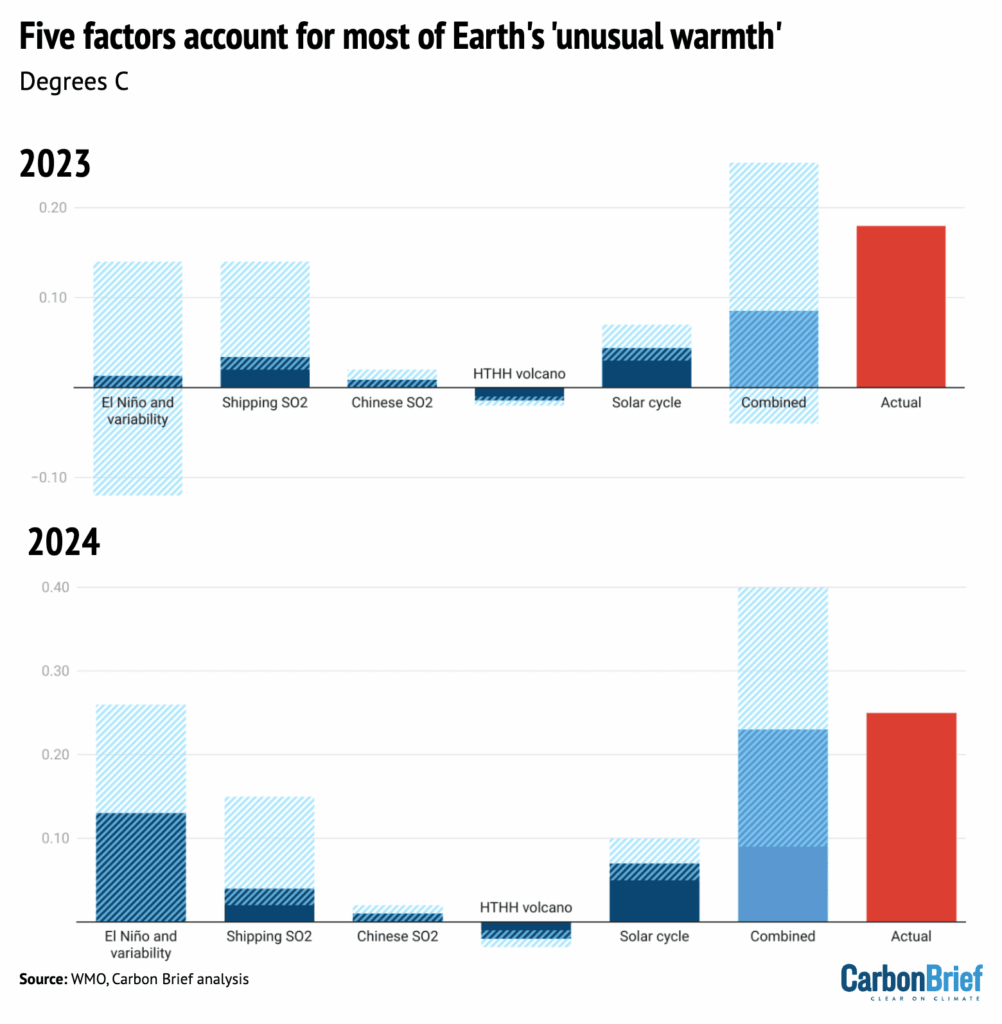
The years 2023 and 2024 were the warmest on record – and 2025 looks set to join them in the top three. The causes of this apparent acceleration in global warming have been subject to a lot of attention in both the media and the scientific community. The charts above, drawn from a new Carbon Brief analysis, show how the natural weather phenomenon El Niño, sulphur dioxide (SO2) emissions from shipping, Chinese SO2, an eruption from the Hunga Tonga-Hunga Ha’apai volcano and solar cycle changes account for most of the “unusual warmth” of recent years. Dark blue bars represent the contribution of individual factors and their uncertainties (hatched areas), the light blue bar shows the combined effects and combination of uncertainties and the red bar shows the actual warming, compared with expectations.
Spotlight
Climate change boardgames
This week, Carbon Brief reports on the rise of climate boardgames.
Boardgames have always made political arguments. Perhaps the most notorious example is the Landlord’s Game published by US game designer and writer Lizzie Magie in 1906, which was designed to persuade people of the need for a land tax.
This game was later “adapted” by US salesman Charles Darrow into the game Monopoly, which articulates a very different set of values.
In this century, game designers have turned to the challenge of climate change.
Best-selling boardgame franchise Catan has spawned a New Energies edition, where players may choose to “invest in clean energy resources or opt for cheaper fossil fuels, potentially causing disastrous effects for the island”.
But perhaps the most notable recent release is 2024’s Daybreak, which won the prestigious Kennerspiel des Jahre award (the boardgaming world’s equivalent of the Oscars).
Rolling the dice
Designed by gamemakers Matteo Menapace and Matt Leacock, Daybreak sees four players take on the role of global powers: China, the US, Europe and “the majority world”, each with their own strengths and weaknesses.
Through playing cards representing policy decisions and technologies, players attempt to reach “drawdown”, a state where they are collectively producing less CO2 than they are removing from the atmosphere.
“Games are good at modelling systems and the climate crisis is a systemic crisis,” Daybreak co-designer Menapace told Carbon Brief.
In his view, boardgames can be a powerful tool for getting people to think about climate change. He said:
“In a video game, the rules are often hidden or opaque and strictly enforced by the machine’s code. In contrast, a boardgame requires players to collectively learn, understand and constantly negotiate the rules. The players are the ‘game engine’. While videogames tend to operate on a subconscious level through immersion, boardgames maintain a conscious distance between players and the material objects they manipulate.
“Whereas videogames often involve atomised or heavily mediated social interactions, boardgames are inherently social experiences. This suggests that playing boardgames may be more conducive to the exploration of conscious, collective, systemic action in response to the climate crisis.”
Daybreak to Dawn
Menapace added that he is currently developing “Dawn”, a successor to Daybreak, building on lessons he learned from developing the first game, telling Carbon Brief:
“I want the next game to be more accessible, especially for schools. We learned that there’s a lot of interest in using Daybreak in an educational context, but it’s often difficult to bring it to a classroom because it takes quite some time to set up and to learn and to play.
“Something that can be set up quickly and that can be played in half the time, 30 to 45 minutes rather than an hour [to] an hour and a half, is what I’m currently aiming for.”
Dawn might also introduce a new twist that explores whether countries are truly willing to cooperate on solving climate change – and whether “rogue” actors are capable of derailing progress, he continued:
“Daybreak makes this big assumption that the world powers are cooperating, or at least they’re not competing, when it comes to climate action. [And] that there are no other forces that get in the way. So, with Dawn, I’m trying to explore that a bit more.
“Once the core game is working, I’d like to build on top of that some tensions, maybe not perfect cooperation, [with] some rogue players.”
Watch, read, listen
WELL WATCHERS: Mother Jones reported on TikTok creators helping to hold oil companies to account for cleaning up abandoned oil wells in Texas.
RUNNING SHORT: Wired chronicled the failure of carbon removal startup Running Tide, which was backed by Microsoft and other tech giants.
PARIS IS 10: To mark the 10th anniversary of the Paris Agreement, climate scientist Prof Piers Forster explained in Climate Home News “why it worked” and “what it needs to do to survive”.
Coming up
- 15-19 December: American Geophysical Union (AGU) annual meeting, New Orleans
- 15-19 December: 70th Meeting of the Global Environment Facility (Gef) Council, online
- 16 December: International Energy Agency: Future of electricity in the Middle East and North Africa webinar, online
Pick of the jobs
- Natural Resources Wales, senior strategic environmental policy specialist | Salary: Unknown. Location: Wales (hybrid)
- The Nature Conservancy, director of conservation – Mata Atlântica | Salary: Unknown. Location: São Paulo, Belo Horizonte, Rio de Janeiro and nearby cities, Brazil
- Barcelona Supercomputing Centre, postdoctoral researcher – downscaling for climate services | Salary: Unknown. Location: Barcelona, Spain
DeBriefed is edited by Daisy Dunne. Please send any tips or feedback to debriefed@carbonbrief.org.
This is an online version of Carbon Brief’s weekly DeBriefed email newsletter. Subscribe for free here.
The post DeBriefed 12 December: EU under ‘pressure’; ‘Unusual warmth’ explained; Rise of climate boardgames appeared first on Carbon Brief.
DeBriefed 12 December: EU under ‘pressure’; ‘Unusual warmth’ explained; Rise of climate boardgames
Greenhouse Gases
‘Cali Fund’ aiming to raise billions for nature receives first donation – of just $1,000
A major biodiversity fund – which could, in theory, generate billions of dollars annually for conservation – received its first donation of just $1,000 in November.
The Cali Fund was created under the UN Convention on Biological Diversity (CBD) at the COP16 nature negotiations in Cali, Colombia, last year.
On 19 November, nine months after the fund officially launched, UK start-up TierraViva AI put forward the first contribution.
The $1,000 payment is an “ice-breaker”, the company’s chief executive tells Carbon Brief, aimed at encouraging others “who may be hesitating” to pay in.
The fund is designed to be a way for companies that rely on nature’s genetic resources to share some of their earnings with the developing, biodiverse countries where many of the original resources are found.
Companies use genetic data from these materials to develop products, such as vaccines and skin cream.
One expert describes the $1,000 as a good “first step”, but says it is “time for larger actors to step forward”. Another says it “squarely points the finger to the profit-making enterprises that are not contributing”.
The CBD is “pleased” about the first payment, a spokesperson tells Carbon Brief, adding that “many discussions” are ongoing about future donations.
Funding biodiversity action
Companies all around the world use genetic materials from plants, animals, bacteria and fungi often found in biodiversity-rich, global south countries to develop their products.
There are existing rules in place to secure consent and ensure compensation if companies or researchers travel to a country to physically gather these materials.
Today, however, much of this information is available in online databases – with few rules in place around access. This genetic data is known as digital sequence information (DSI).
The Cali Fund is part of an effort to close this loophole.
The COP16 agreement on the creation of the fund outlined that large companies in several sectors, including pharmaceutical, cosmetic, biotechnology, agribusiness and technology, “should” contribute a cut of the money they earn from the use of these materials. (See: Carbon Brief’s infographic on DSI.)
The money is intended to fund biodiversity action, with 50% of resources going to Indigenous peoples and local communities who protect vast swathes of the world’s nature and biodiversity.
These contributions, however, are voluntary.
The fund officially launched at the resumed COP16 negotiations in Rome in February 2025, where a spokesperson for the CBD said that first contributions could be announced in spring.
However, Carbon Brief reported in August that the fund was still empty.
On 19 November, the first contribution was announced during the COP30 UN climate summit. At $1,000, the amount was significantly lower than the potential millions that larger companies could pay in.
A UK government press release described it as a “major milestone” that will “pav[e] the way for others to do the same and mobilise private sector finance for nature at scale”.
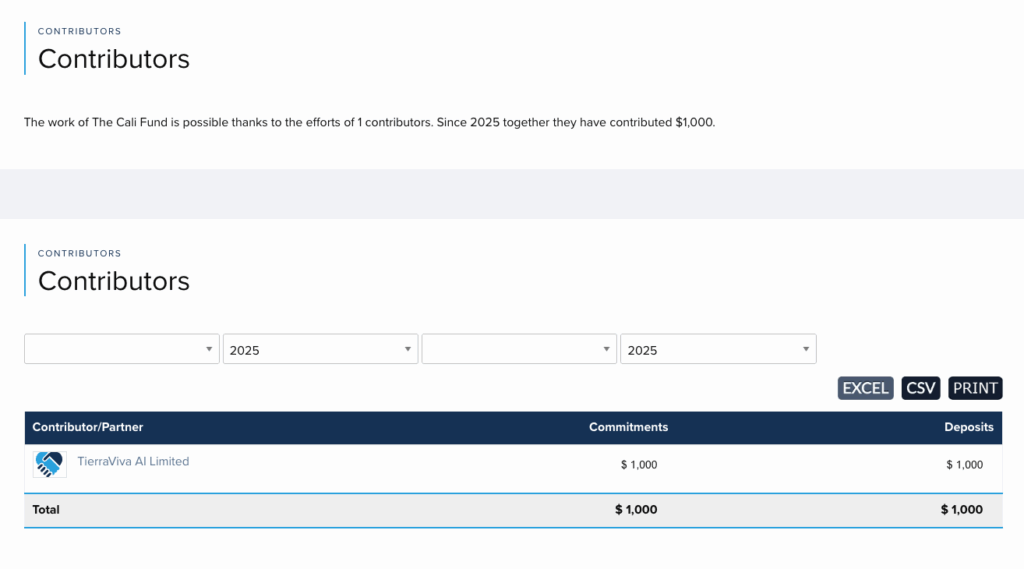
The payment was an “expression of our commitment to the objectives of the Cali Fund”, TierraViva AI chief executive Dr Paul Oldham wrote in a letter to the executive secretary of the CBD, Astrid Schomaker.
The $1,000 is an “initial contribution”, Oldham said, and the company plans to give more “as our business grows”. Based in the UK with a team of programmers in Nairobi, TierraViva AI was set up in 2023 and uses AI to support conservation.
An anthropologist who worked on Indigenous peoples’ rights in the Amazon, Oldham’s research helped inform the list of sectors most likely to “directly or indirectly benefit from the use of DSI”, including “generative biology” and AI companies.
Oldham noted in a speech at the sidelines of COP30 that although the company’s earnings are not large enough to meet the contribution thresholds set out in the Cali Fund agreement, its contribution showed that companies “of any size” can pay in.

He tells Carbon Brief that while “some” companies “are not serious about contributing and are seeking to delay” paying into the fund, others have different concerns, including the “need for a level playing field” and positive incentives to contribute:
“This will be hard-earned company money, so it’s reasonable enough to imagine that one of the first questions companies will want an answer to is: ‘well, what is this actually going to be spent on?’ And: ‘what is the benefit of this to us’, which is likely to vary by sector.
“In my view, the best way forward would be for companies that can to make contributions. That would give everybody, including governments, confidence that there might be constructive ways to address difficult topics.”
Future contributions
A spokesperson for the CBD tells Carbon Brief:
“We are pleased that the Cali Fund is not only ‘open for business’, but that this first contribution also demonstrates it is fully operational. We thank and congratulate TierraViva AI for being the first company to step up.”
“Many discussions” are ongoing around future donations to the fund, the spokesperson says, and the CBD is “hopeful that further announcements can be made soon”, ahead of the next UN biodiversity summit, COP17, in October 2026.
Asked whether the CBD was expecting more contributions at this stage, the spokesperson says the fund was set up in “very short order” and that the first payment shows that companies are “able to contribute”.
US biotechnology company Ginkgo Bioworks was the first to pledge to contribute to the fund earlier this year, but has so far not put forward any money. The company did not respond to Carbon Brief’s request for comment.
Carbon Brief reported earlier this year that at least two companies were contacted by a UK department with opportunities to be involved in the Cali Fund before its launch in February, but no company took up on the offer.
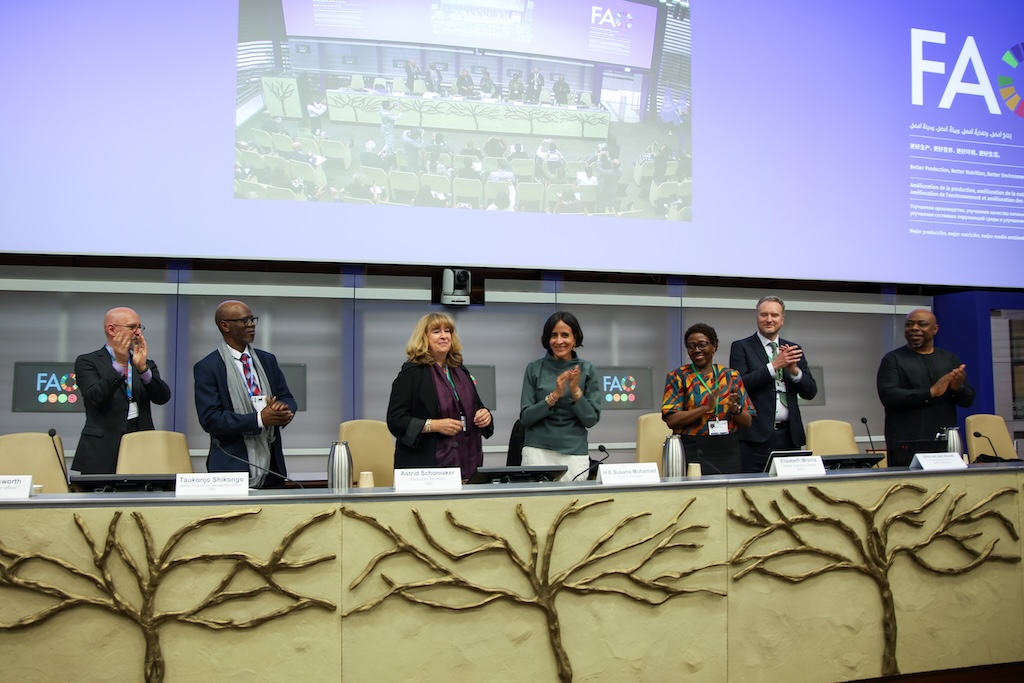
The first contribution coming from a “startup that has just begun operations squarely points the finger to the profit-making enterprises that are not contributing”, Dr Siva Thambisetty, associate professor of law at the London School of Economics, tells Carbon Brief. Thambisetty adds:
“Strident cries of lack of legal certainty, unfairness or stacking obligations [combining responsibilities from different agreements and laws] would be more credible if industry organisations encouraged large firms that use DSI to begin contributing, instead of denying the last 20 years of multilateral [negotiations] that have led to this point.”
Dr June Rubis – Indigenous peoples and local communities (IPLC) lead from Asia on the Cali Fund’s steering committee – welcomes TierraViva AI’s “first step”, but tells Carbon Brief that the “real test lies ahead” and that it is “now time for larger actors to step forward”.
She says the Cali Fund offers “clarity” on how the private sector can directly increase support to UN-backed funds at a time when “states are retreating” from their climate and biodiversity finance obligations:
“It’s not a voluntary offsetting scheme or a…risky or fringe fund; it’s a multilateral mechanism designed to meet the highest fiduciary and equity standards. We invite companies to see this not as philanthropy, but as participation in a globally endorsed system where trust is institutionalised, benefits are traceable and equity is operationalised.
“Contributing to the Cali Fund isn’t just ethical, it’s strategic. [But] It’s about more than funding: it’s about trust, power-sharing and making sure IPLCs are part of the decisions, not just the outcomes.”
The post ‘Cali Fund’ aiming to raise billions for nature receives first donation – of just $1,000 appeared first on Carbon Brief.
‘Cali Fund’ aiming to raise billions for nature receives first donation – of just $1,000
Greenhouse Gases
Net-zero scenario is ‘cheapest option’ for UK, says energy system operator
A scenario that meets the “net-zero by 2050” goal would be the “cheapest” option for the UK, according to modelling by the National Energy System Operator (NESO).
In a new report, the organisation that manages the UK’s energy infrastructure says its “holistic transition” scenario would have the lowest cost over the next 25 years, saving £36bn a year – some 1% of GDP – compared to an alternative scenario that slows climate action.
These savings are from lower fuel costs and reduced climate damages, relative to a scenario where the UK fails to meet its climate goals, known as “falling behind”.
The UK will need to make significant investments to reach net-zero, NESO says, but this would cut fossil-fuel imports, support jobs and boost health, as well as contributing to a safer climate.
Slowing down these efforts would reduce the scale of investments needed, but overall costs would be higher unless the damages from worsening climate change are “ignored”, the report says.
In an illusory world where climate damages do not exist, slowing the UK’s efforts to cut emissions would generate “savings” of £14bn per year on average – some 0.4% of GDP.
NESO says that much of this £14bn could be avoided by reaching net-zero more cheaply and that it includes costs unrelated to climate action, such as a faster rollout of data centres.
Notably, the report appears to include efforts to avoid the widespread misreporting of a previous edition, including in the election manifesto of the hard-right, climate-sceptic Reform UK party.
Overall, NESO warns that, as well as ignoring climate damages, the £14bn figure “does not represent the cost of achieving net-zero” and cannot be compared with comprehensive estimates of this, such as the 0.2% of GDP total from the UK’s Climate Change Committee (CCC).
Net-zero is the ‘cheapest option’
Every year, NESO publishes its “future energy scenarios”, a set of four pathways designed to explore how the nation’s energy system might change over the coming decades.
(Technically the scenarios apply to the island of Great Britain, rather than the whole UK, as Northern Ireland’s electricity system is part of a separate network covering the island of Ireland.)
Published in July, the scenarios test a series of questions, such as what it would mean for the UK to meet its climate goals, whether it is possible to do so while relying heavily on hydrogen and what would happen if the nation was to slow down its efforts to cut emissions.
The scenarios have a broad focus and do not only consider the UK’s climate goals. In addition, they also explore the implications of a rapid growth in electricity demand from data centres, the potential for autonomous driving and many other issues.
With so many questions to explore, the scenarios are not designed to keep costs to a minimum. In fact, NESO does not publish related cost estimates in most years.
This year, however, NESO has published an “economics annex” to the future energy scenarios. It last published a similar exercise in 2020, with the results being widely misreported.
In the new annex, NESO says that the UK currently spends around 10% of GDP on its energy system. This includes investments in new infrastructure and equipment – such as cars, boilers or power plants – as well as fuel, running and maintenance costs.
This figure is expected to decline to around 5% of GDP by 2050 under all four scenarios, NESO says, whether they meet the UK’s net-zero target or not.
For each scenario, the annex adds up the total of all investments and ongoing costs in every year out to 2050. It then adds an estimate of the economic damages from the greenhouse gas emissions that primarily come from burning fossil fuels, using the Treasury’s “green book”.
When all of these costs are taken into account, NESO says that the “cheapest” option is a pathway that meets the UK’s climate goals, including all of the targets on the way to net-zero by 2050.
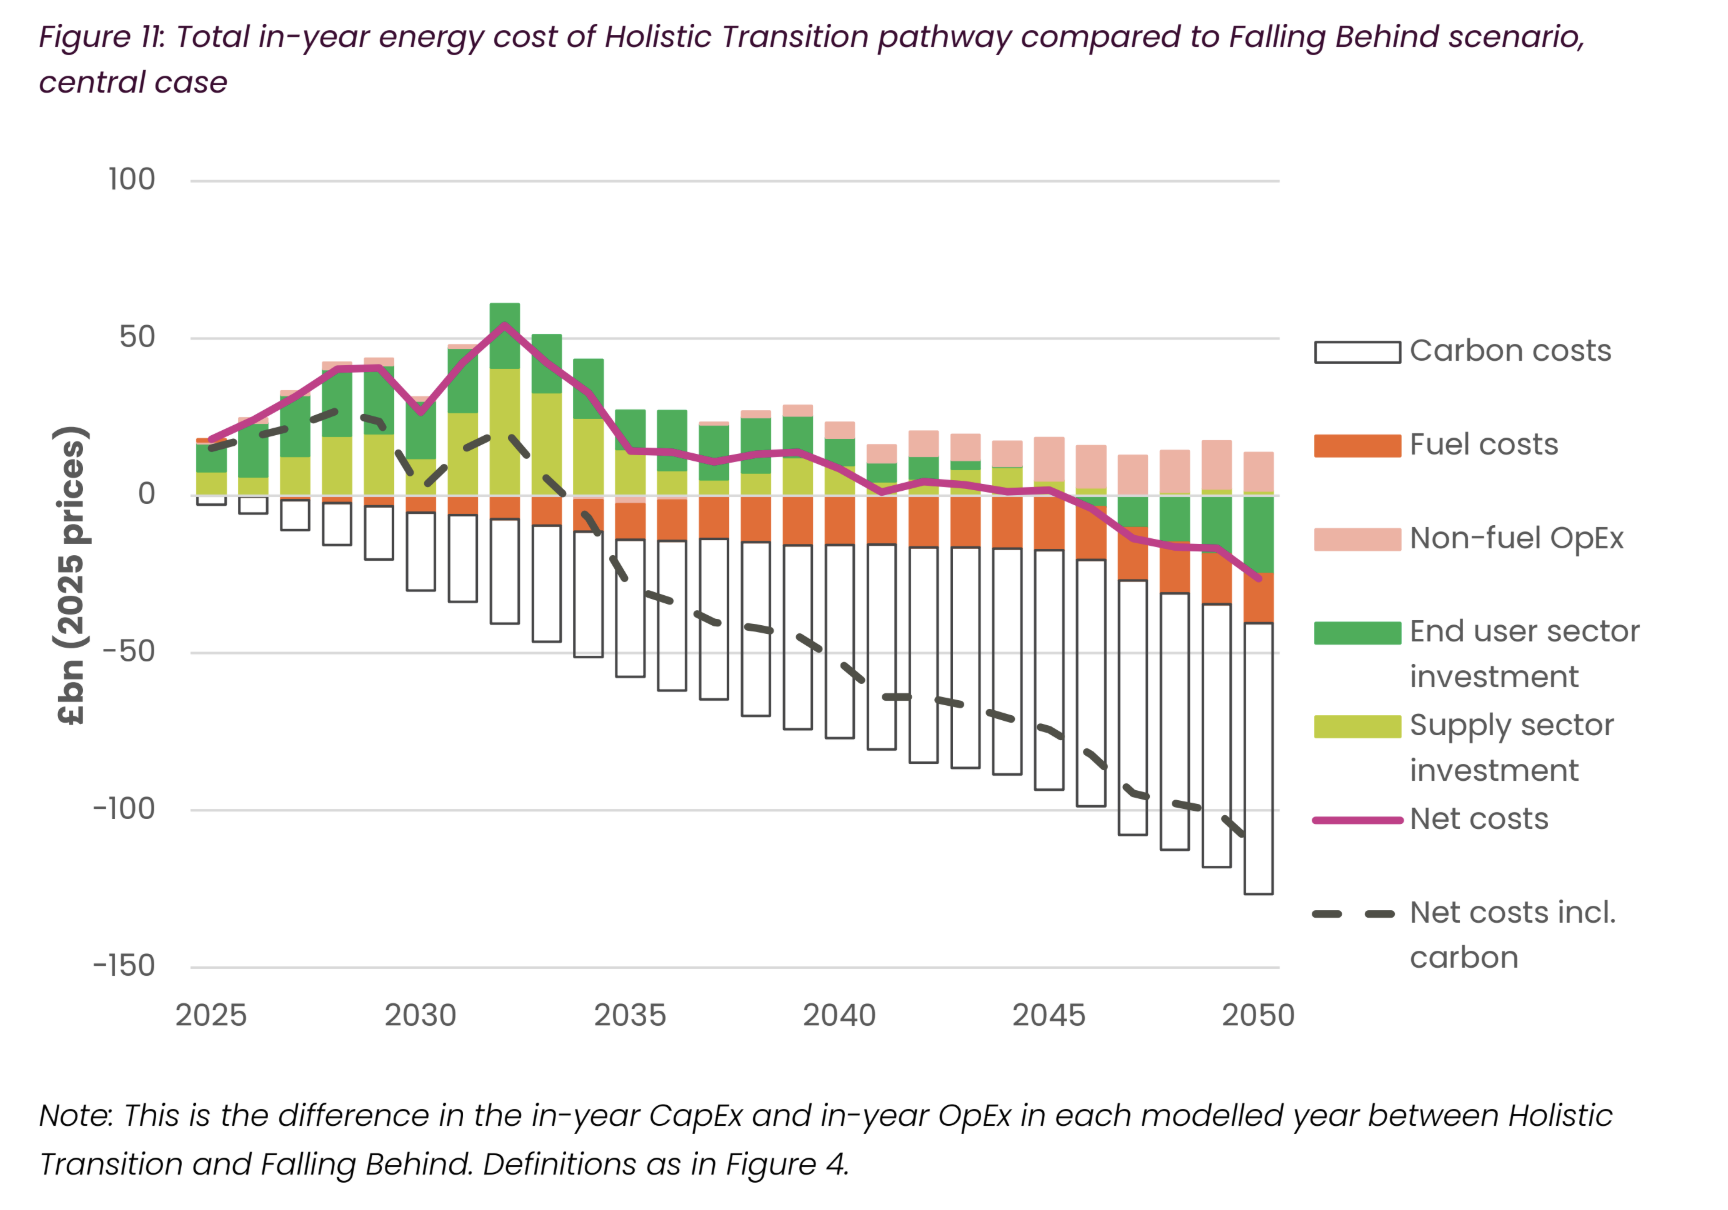
It says this pathway, known as “holistic transition”, would bring average savings of £36bn per year out to 2050, relative to a pathway where the UK slows its efforts on climate change.
The overall savings, illustrated by the dashed line in the figure below, stem primarily from lower fuel costs (orange bars) and reduced climate damages (white bars).
Note that the carbon pricing that is already applied to power plants and other heavy industry under the UK’s emissions trading system (ETS) is excluded from running costs in the annex, appearing instead within the wider “carbon costs” category.
This makes the running costs of fossil-fuel energy sources seem cheaper than they really are, when including the ETS price.
Net-zero requires significant investment
While NESO says that its net-zero compliant “holistic transition” pathway is the cheapest option for the UK, it does require significant upfront investments.
The scale of the additional investments needed to stay on track for the UK’s climate goals, beyond a pathway where those targets are not met, is illustrated in the figure below.
This shows that the largest extra investments would need to be made in the power sector, such as by building new windfarms (shown by the dark yellow bars). This is followed by investment needs for homes, such as to install electric heat pumps instead of gas boilers (dark red bars).
These additional investments would amount to around £30bn per year out to 2050, but with a peak of as much as £60bn over the next decade.
These investments would be offset by lower fuel bills, including reduced gas use in homes (pale red) and lower oil use in transport (mid green).
Notably, NESO says it expects EVs to be cheaper to buy than petrol cars from 2027, meaning there are also significant savings in transport capital expenditure (“CapEx”, dark green).

Again, the biggest savings in “holistic transition” relative to “falling behind” would come from avoided climate damages – described by NESO as “carbon costs”.
Net-zero cuts fossil-fuel imports
In addition to avoided climate damages, NESO says that reaching the UK’s net-zero target would bring wider benefits to the economy, including lower fuel imports.
Specifically, it says that climate efforts would “materially reduce” the UK’s dependency on overseas gas, with imports falling to 78% below current levels by 2050 in “holistic transition”. Under the “falling behind” scenario, imports rise by 35%”, despite higher domestic production.
This finding, shown in the figure below, is the opposite of what has been argued by many of those that oppose the UK’s net-zero target.

NESO goes on to argue that the shift to net-zero would have wider economic benefits. These include a shift from buying imported fossil fuels to investing money domestically instead, which “could bring local economic benefits and support future employment”.
The operator says that there is the “potential for more jobs to be created than lost in the transition to net-zero” and that there would be risks to UK trade if it fails to cut emissions, given exports to the EU – the UK’s main trading partner – would be subject to the bloc’s new carbon border tax.
Beyond the economy, NESO points to studies finding that the transition to net-zero would have other benefits, including for human health and the environment.
It does not attempt to quantify these benefits, but points to analysis from the CCC finding that health benefits alone could be worth £2.4-8.2bn per year by 2050.
Investment is higher for net-zero than for ‘not-zero’
It is clear from the NESO annex that its net-zero compliant “holistic transition” pathway would entail significantly more upfront investment than if climate action is slowed under “falling behind”.
This idea, in effect, is the launchpad for politicians arguing that the UK should walk away from its climate commitments and stop building new low-carbon infrastructure.
As already noted, the NESO analysis shows that this would increase costs to the UK overall.
Still, NESO’s new report adds that “falling behind” would “save” £14bn a year – relative to meeting the UK’s net-zero target – as long as carbon costs are “ignored”.
Specifically, it says that ignoring carbon costs, “holistic transition” would cost an average of £14bn a year more out to 2050 than “falling behind”, which misses the net-zero target. This is equivalent to 0.4% of the UK’s GDP and is illustrated by the solid pink line in the figure below.

Some politicians are indeed now willing to ignore the problem of climate change and the damages caused by ongoing greenhouse gas emissions. These politicians may therefore be tempted to argue that the UK could “save” £14bn a year by scrapping net-zero.
However, NESO’s report cautions against this, stating explicitly that the “costs discussed here do not represent the cost of achieving net-zero emissions”. It says:
“Our pathways cannot provide firm conclusions over the relative costs attached to the choices between pathways…We reiterate that the costs discussed here do not represent the cost of achieving net-zero emissions.”
It says that the scenarios have not been designed to minimise costs and that it would be possible to reach net-zero more cheaply, for example by focusing more heavily on EVs and renewables instead of hydrogen and nuclear.
Moreover, it says that some of the difference in costs between “holistic transitions” and “falling behind” is unrelated to climate action. Specifically, it says that electricity demand from data centres is around twice as high in “holistic transitions”, adding some £5bn a year in costs in 2050.
In addition, NESO says that most of the “saving” in “falling behind” would be wiped out if fossil fuel prices are higher than expected – falling from £14bn per year to just £5bn a year – even before considering climate damages and wider benefits, such as for health.
Finally, NESO says that failing to make the transition to net-zero would leave the UK more exposed to fossil-fuel price shocks, such as the global energy crisis that added 1.8% to the nation’s energy costs in 2022. It says a similar shock would only cost 0.3% of GDP in 2050 if the country has reached net-zero – as in “holistic transition” – whereas costs would remain high in “falling behind”.
The post Net-zero scenario is ‘cheapest option’ for UK, says energy system operator appeared first on Carbon Brief.
Net-zero scenario is ‘cheapest option’ for UK, says energy system operator
-
Climate Change4 months ago
Guest post: Why China is still building new coal – and when it might stop
-
Greenhouse Gases4 months ago
Guest post: Why China is still building new coal – and when it might stop
-
Climate Change2 years ago
Spanish-language misinformation on renewable energy spreads online, report shows
-

 Greenhouse Gases2 years ago
嘉宾来稿:满足中国增长的用电需求 光伏加储能“比新建煤电更实惠”
-
Climate Change Videos2 years ago
The toxic gas flares fuelling Nigeria’s climate change – BBC News
-

 Climate Change2 years ago
嘉宾来稿:满足中国增长的用电需求 光伏加储能“比新建煤电更实惠”
-

 Carbon Footprint2 years ago
US SEC’s Climate Disclosure Rules Spur Renewed Interest in Carbon Credits
-
Climate Change2 years ago
Why airlines are perfect targets for anti-greenwashing legal action


