
The UK’s greenhouse gas emissions fell by 3.6% in 2024 as coal use dropped to the lowest level since 1666, the year of the Great Fire of London, according to new Carbon Brief analysis.
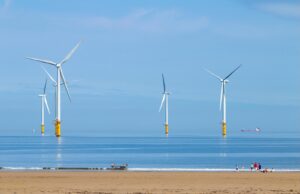
Major contributions came from the closure of the UK’s last coal-fired power station in Nottinghamshire and one of its last blast furnaces at the Port Talbot steelworks in Wales.
Other factors include a nearly 40% rise in the number of electric vehicles (EVs) on the road, above-average temperatures and the UK’s electricity being the “cleanest ever” in 2024.
Carbon Brief’s analysis, based on preliminary government energy data, shows emissions fell to just 371m tonnes of carbon dioxide equivalent (MtCO2e) in 2024, the lowest level since 1872.
Other key findings from the analysis include:
- The UK’s emissions are now 54% below 1990 levels, while GDP has grown by 84%.
- About half of the drop in emissions in 2024 was due to a 54% reduction in UK coal demand, which fell to just 2m tonnes – the lowest level since 1666.
- Another third of the drop in 2024 emissions was due to falling demand for oil and gas, with the remainder down to ongoing reductions in non-CO2 greenhouse gases.
- UK coal demand fell at power stations (one-third of the reduction overall) and at industrial sites (two-thirds). In 2024, the UK closed its last coal-fired power station, as well as the final blast furnace at the Port Talbot steelworks. Furnaces at Scunthorpe paused operations. Both sites are due to convert to electric-arc furnaces that do not rely on coal.
- Oil demand fell 1.4% despite increased road traffic, largely due to the rise in the number of EVs. The UK’s 1.4m EVs, 0.8m plug-in hybrids and 76,000 electric vans cut oil-related emissions by at least 5.9MtCO2e, Carbon Brief analysis finds, only slightly offset by around 0.5MtCO2e from higher electricity demand.
- The UK’s EV motorists each saved around £800, on average, in 2024 – some £1.7bn in total – relative to the cost of driving petrol or diesel vehicles.
- Gas demand for heating increased, despite warmer average temperatures than in 2023, as prices eased from the peaks seen after the global energy crisis.
- However, gas demand fell overall due to lower gas-fired electricity generation, thanks to higher electricity imports and increased output from low-carbon sources.
The UK would need to cut its emissions by a larger amount each year than it did in 2024, to reach its international climate goal for 2035, as well as its national target to reach net-zero by 2050.
The analysis is the latest in a decade-long series of annual estimates from Carbon Brief, covering emissions during 2023, 2022, 2020, 2019, 2018, 2017, 2016, 2015 and 2014.
Lowest since 1872
The UK’s territorial greenhouse gas emissions – those that occur within the country’s borders – have now fallen in 26 of the 35 years since 1990.
(Consumption-based emissions, including CO2 embedded in imported goods and services, were increasing until 2007, but have since fallen at a similar rate to territorial emissions.)
Apart from brief rebounds after the global financial crisis and the Covid-19 lockdowns, UK emissions have fallen every year for the past two decades.
The latest 14MtCO2e (3.6%) reduction takes UK emissions down to 371MtCO2e, according to Carbon Brief’s new analysis.
This is the lowest since 1872 and on par with 1926, when there was a general strike, as shown in the figure below. In 1872, Queen Victoria was on the throne and Wanderers beat Royal Engineers in the first-ever FA Cup final, held at Kennington Oval in south London.
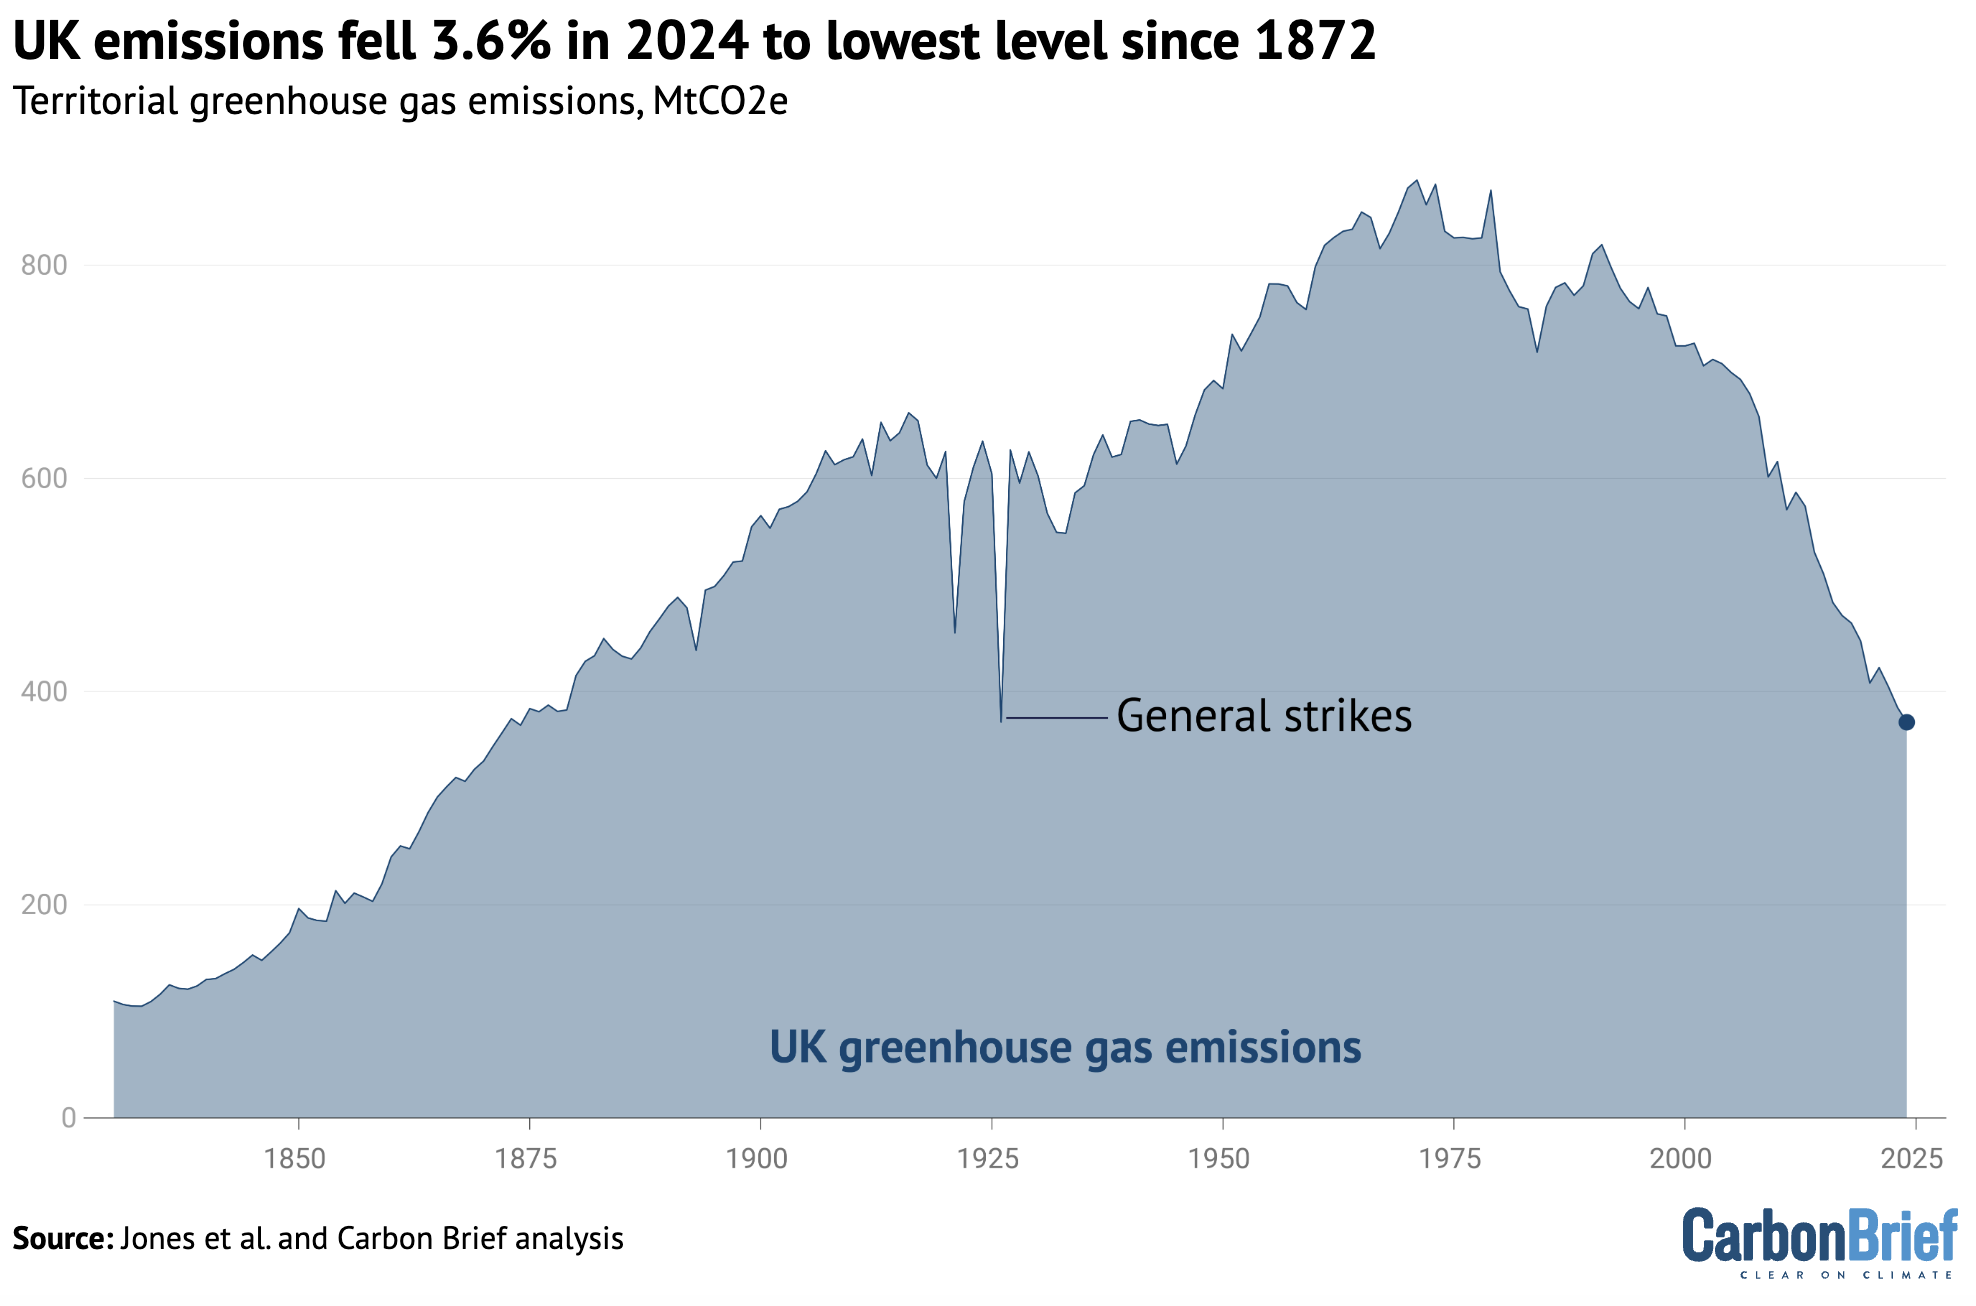
The UK’s emissions are now definitively below the level reached only temporarily during the height of Covid in 2020, having fallen steadily in each of the past three years.
They are now at levels not seen consistently since Victorian times.
Coal collapse
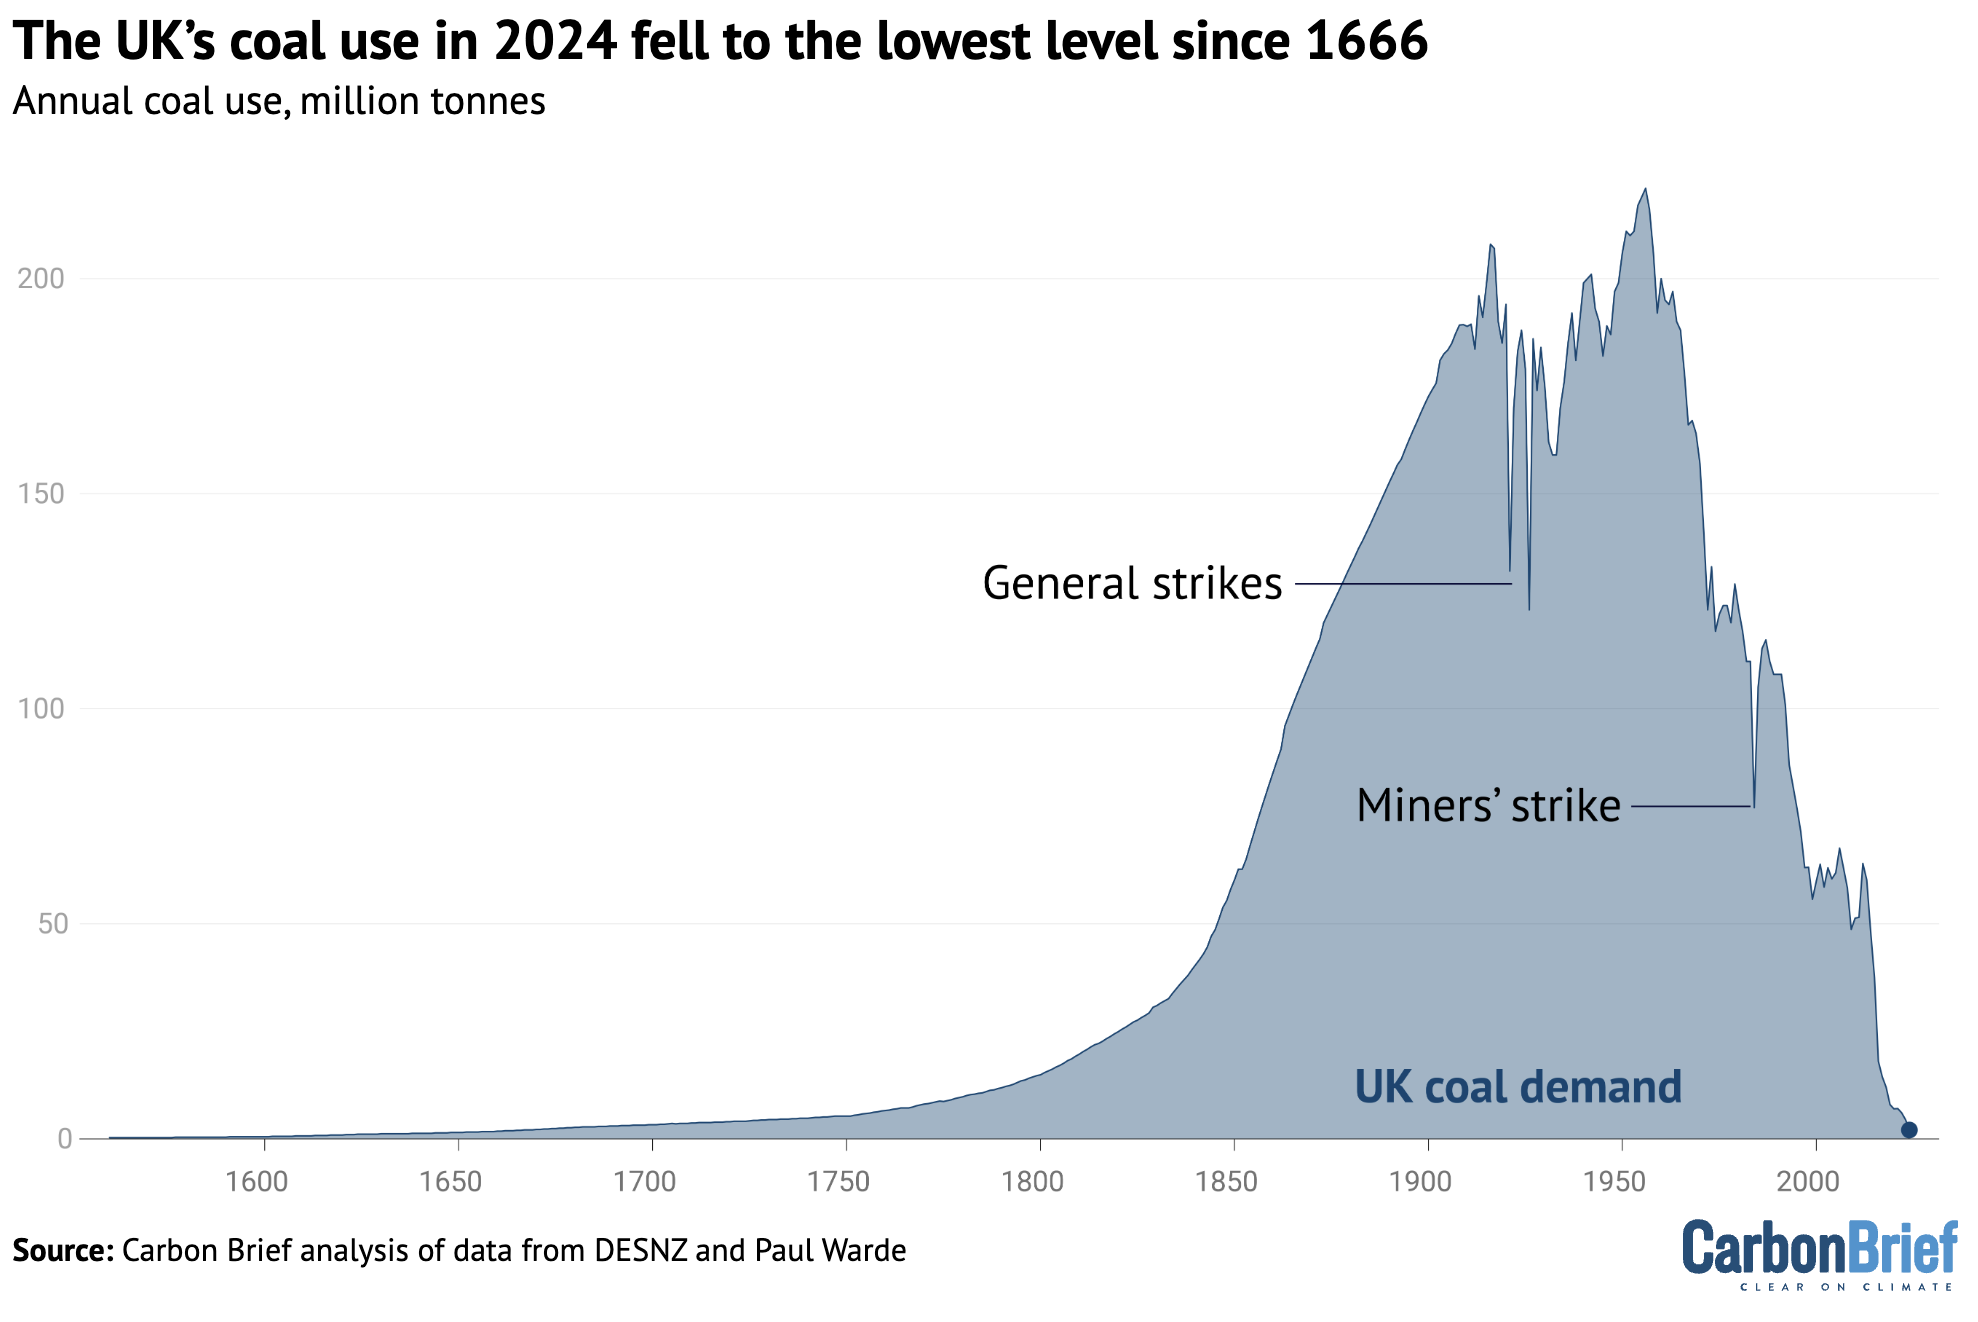
The largest factor in emissions falling last year, accounting for around 7MtCO2e or two-thirds of the reduction overall, was a massive 54% drop in UK coal demand.
In percentage terms, this was the fastest annual reduction in UK coal demand on record, in figures going back to the 16th century. (In absolute terms, the 2.4Mt fall in coal use in 2024 is easily eclipsed by the 34Mt reduction seen during the 1984 miners’ strike.)
The UK used just 2.1Mt of coal in 2024. As shown in the figure below, this is the lowest amount since 1666, when the UK’s capital city was engulfed in the Great Fire of London.
Roughly one-third of the drop in coal use overall last year was due to the closure of the UK’s last coal-fired power station, at Ratcliffe-on-Soar in Nottinghamshire. (For more on how the UK became the first G7 country to phase out coal power, see Carbon Brief’s in-depth interactive feature.)
The plant supplied power to the grid for the last time in September 2024, bringing to an end a 142-year era of using coal to generate electricity in the UK.
The shift away from coal power towards low-carbon sources has been one of the driving forces of UK emissions cuts in recent years.
Indeed, in the period since the UK’s Climate Change Act was passed, the amount of coal used to generate electricity has dropped by 99%, from 48Mt in 2008 to less than 1Mt in 2024. This accounts for the large majority (84%) of the total reduction in coal use over the same period.
Steel slide
In 2024, however, two-thirds of the drop in UK coal consumption – and one-third of the drop in emissions overall – came from lower coal use by heavy industry.
This was largely due to lower steel production, which fell from 5.6Mt in 2023 to 4.0Mt in 2024, a reduction of 29%. This 1.6Mt drop in production was mostly offset by a 1.3Mt increase in imports.
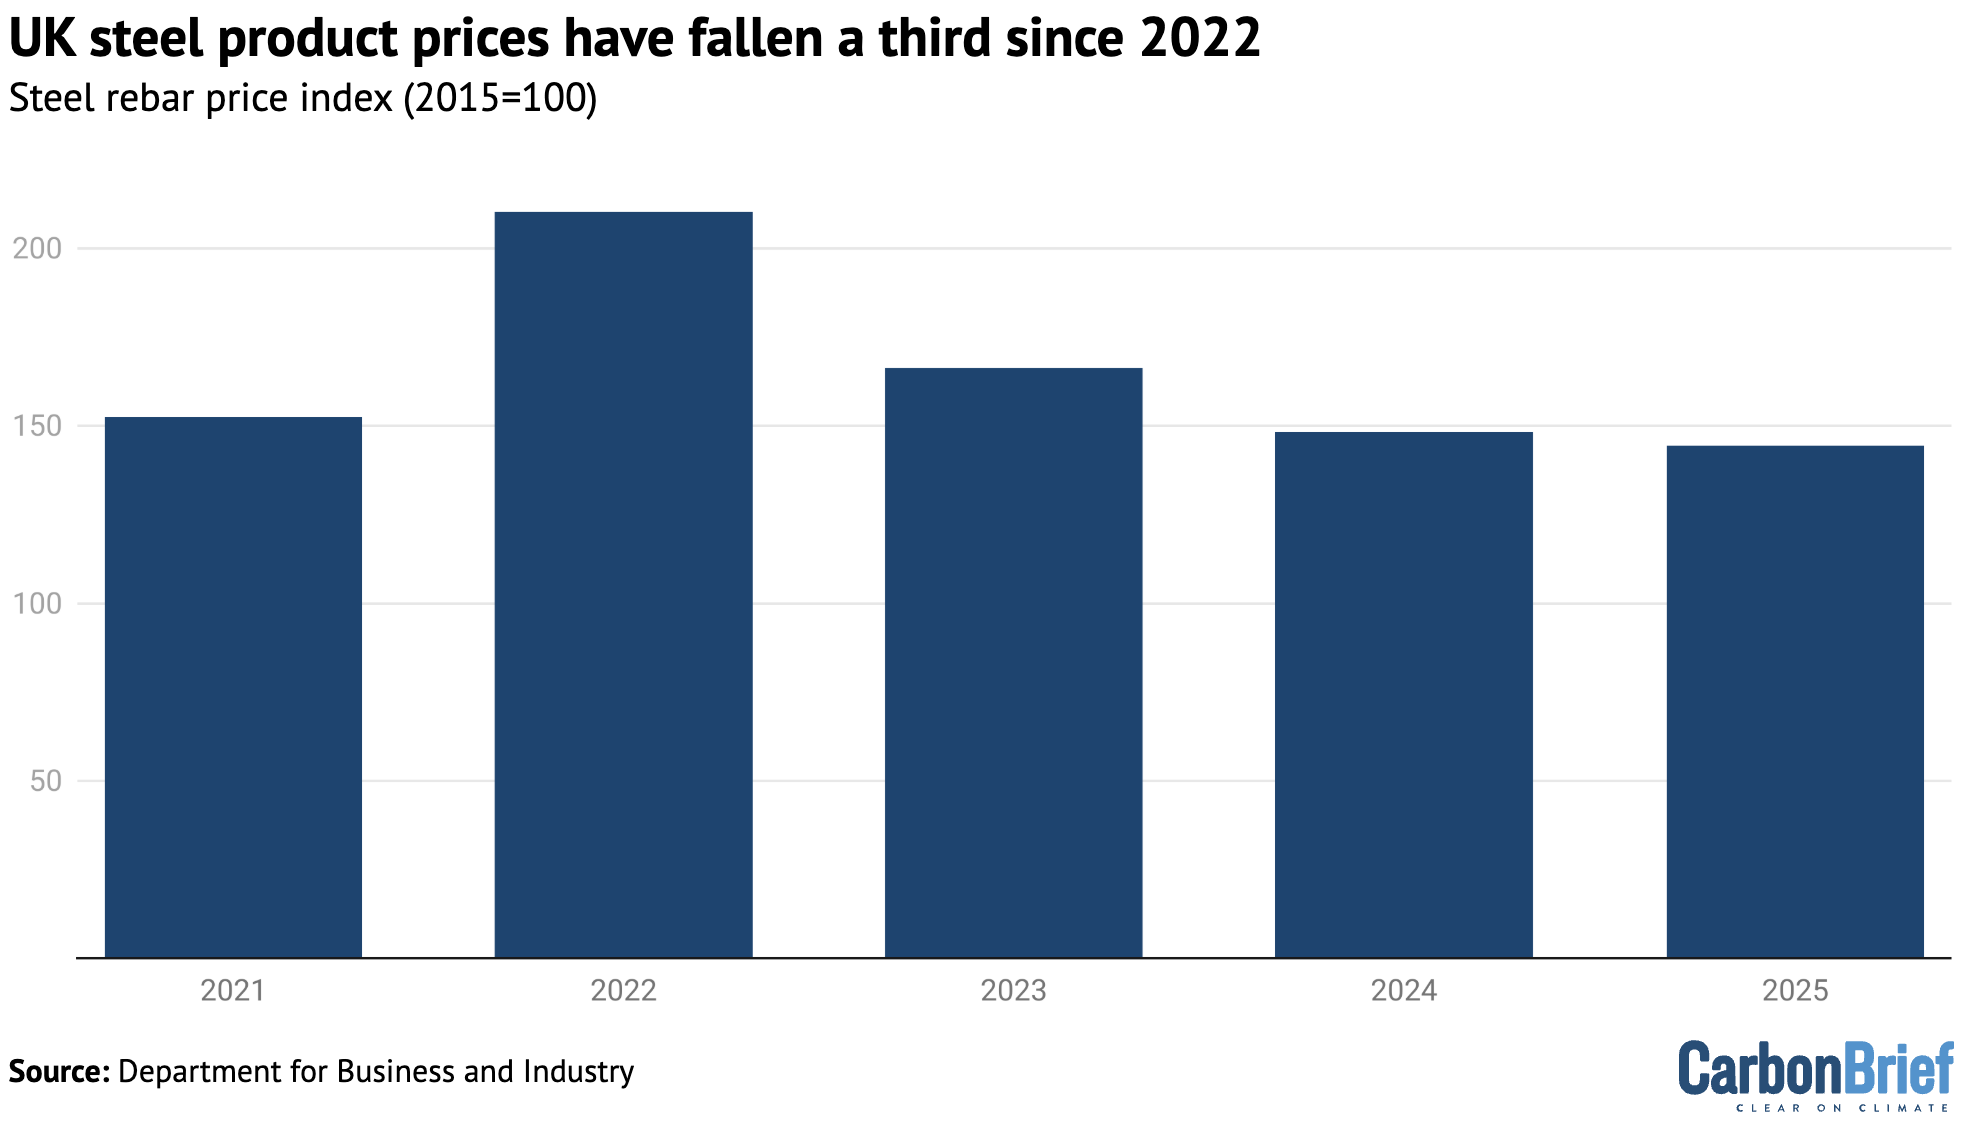
The Port Talbot steelworks in Wales shut down its last two blast furnaces in April and September, with owner Tata blaming losses of £1m a day for the closures.
Since the site last made a profit in 2022, UK and global steel prices have fallen sharply, as shown in the figure below. US credit rating agency Fitch Ratings says the decline in prices, down to weak demand and high exports from China, is “putting pressure on producers’ margins”.
Many commentators have tried to blame climate policy or electricity prices for the steel sector’s problems. However, energy only makes up a tiny fraction of coal-based steel production costs.
Moreover, steelmakers around the world – from China to South Africa – are facing similar challenges, with prices falling as a result of supply being significantly greater than demand.
Industry group Eurofer says the European market is being “flooded by cheap foreign steel”. It adds that economic headwinds in China, including its real-estate slowdown, have seen “around 100m tonnes of Chinese steel…flooding major markets at dumping prices”.
As such, it is not at all clear that the UK steel sector would have fared differently – or that the Port Talbot blast furnaces would have remained open – in the absence of climate policy.
For example, the sector is part of the UK emissions trading scheme (UKETS), meaning it nominally faces a carbon price that imports from outside the EU would not have to pay.
Yet UK (and EU) steelmakers continue to receive free allowances to shield them from the risk of “leakage” due to competition from abroad. The Port Talbot steelworks received more than 21m free allowances to cover its emissions in the period 2021-2025, worth roughly £1bn. Similarly, the Scunthorpe steelworks received nearly 17m allowances worth around £0.8bn.
From 2027, the UK plans to follow the EU in shifting from free allowances to a carbon border adjustment mechanism (CBAM), under which importers must pay an equivalent carbon price.
The closure of the UK’s blast furnaces is not the end of the story for steelmaking in the country. Indeed, Tata has pledged an investment worth £1.25bn to reopen its Welsh site with electric arc furnaces, which do not rely on coal. This includes up to £0.5bn from the government. Tata says it will have the capacity to produce 3Mt of steel per year from late 2027 or early 2028.
Production also paused in 2024 at the Scunthorpe steelworks, run by the Chinese-owned British Steel, reportedly due to managers ordering the wrong type of coal. Its blast furnaces are now operating again, but it is also looking to shift to electric arc furnaces with government support.
The UK steel industry has welcomed the shift to electric arc furnaces, but has called for efforts to reduce electricity prices, including the 2024 “supercharger” scheme that exempts heavy industry from additional costs relating to renewable subsidies and electricity network charges.
The government’s February 2025 steel strategy looks at issues including “overcapacity in global markets” and the “influence of electricity prices on the competitiveness of the steel sector”.
Rise of EVs
After coal, the next-largest chunk of emissions cuts in 2024 came from lower demand for oil and gas, which accounted for around a third of the reduction overall.
The 1.4% drop in oil demand is particularly interesting, given that traffic on the UK’s roads has been increasing in recent years.
The number of miles driven on UK roads increased by more than 1% in 2024 and is now close to pre-pandemic levels. Yet UK demand for road-transport fuels fell by another 1.6% in 2024 and is now nearly 14% lower than it was in 2019, as shown in the figure below.
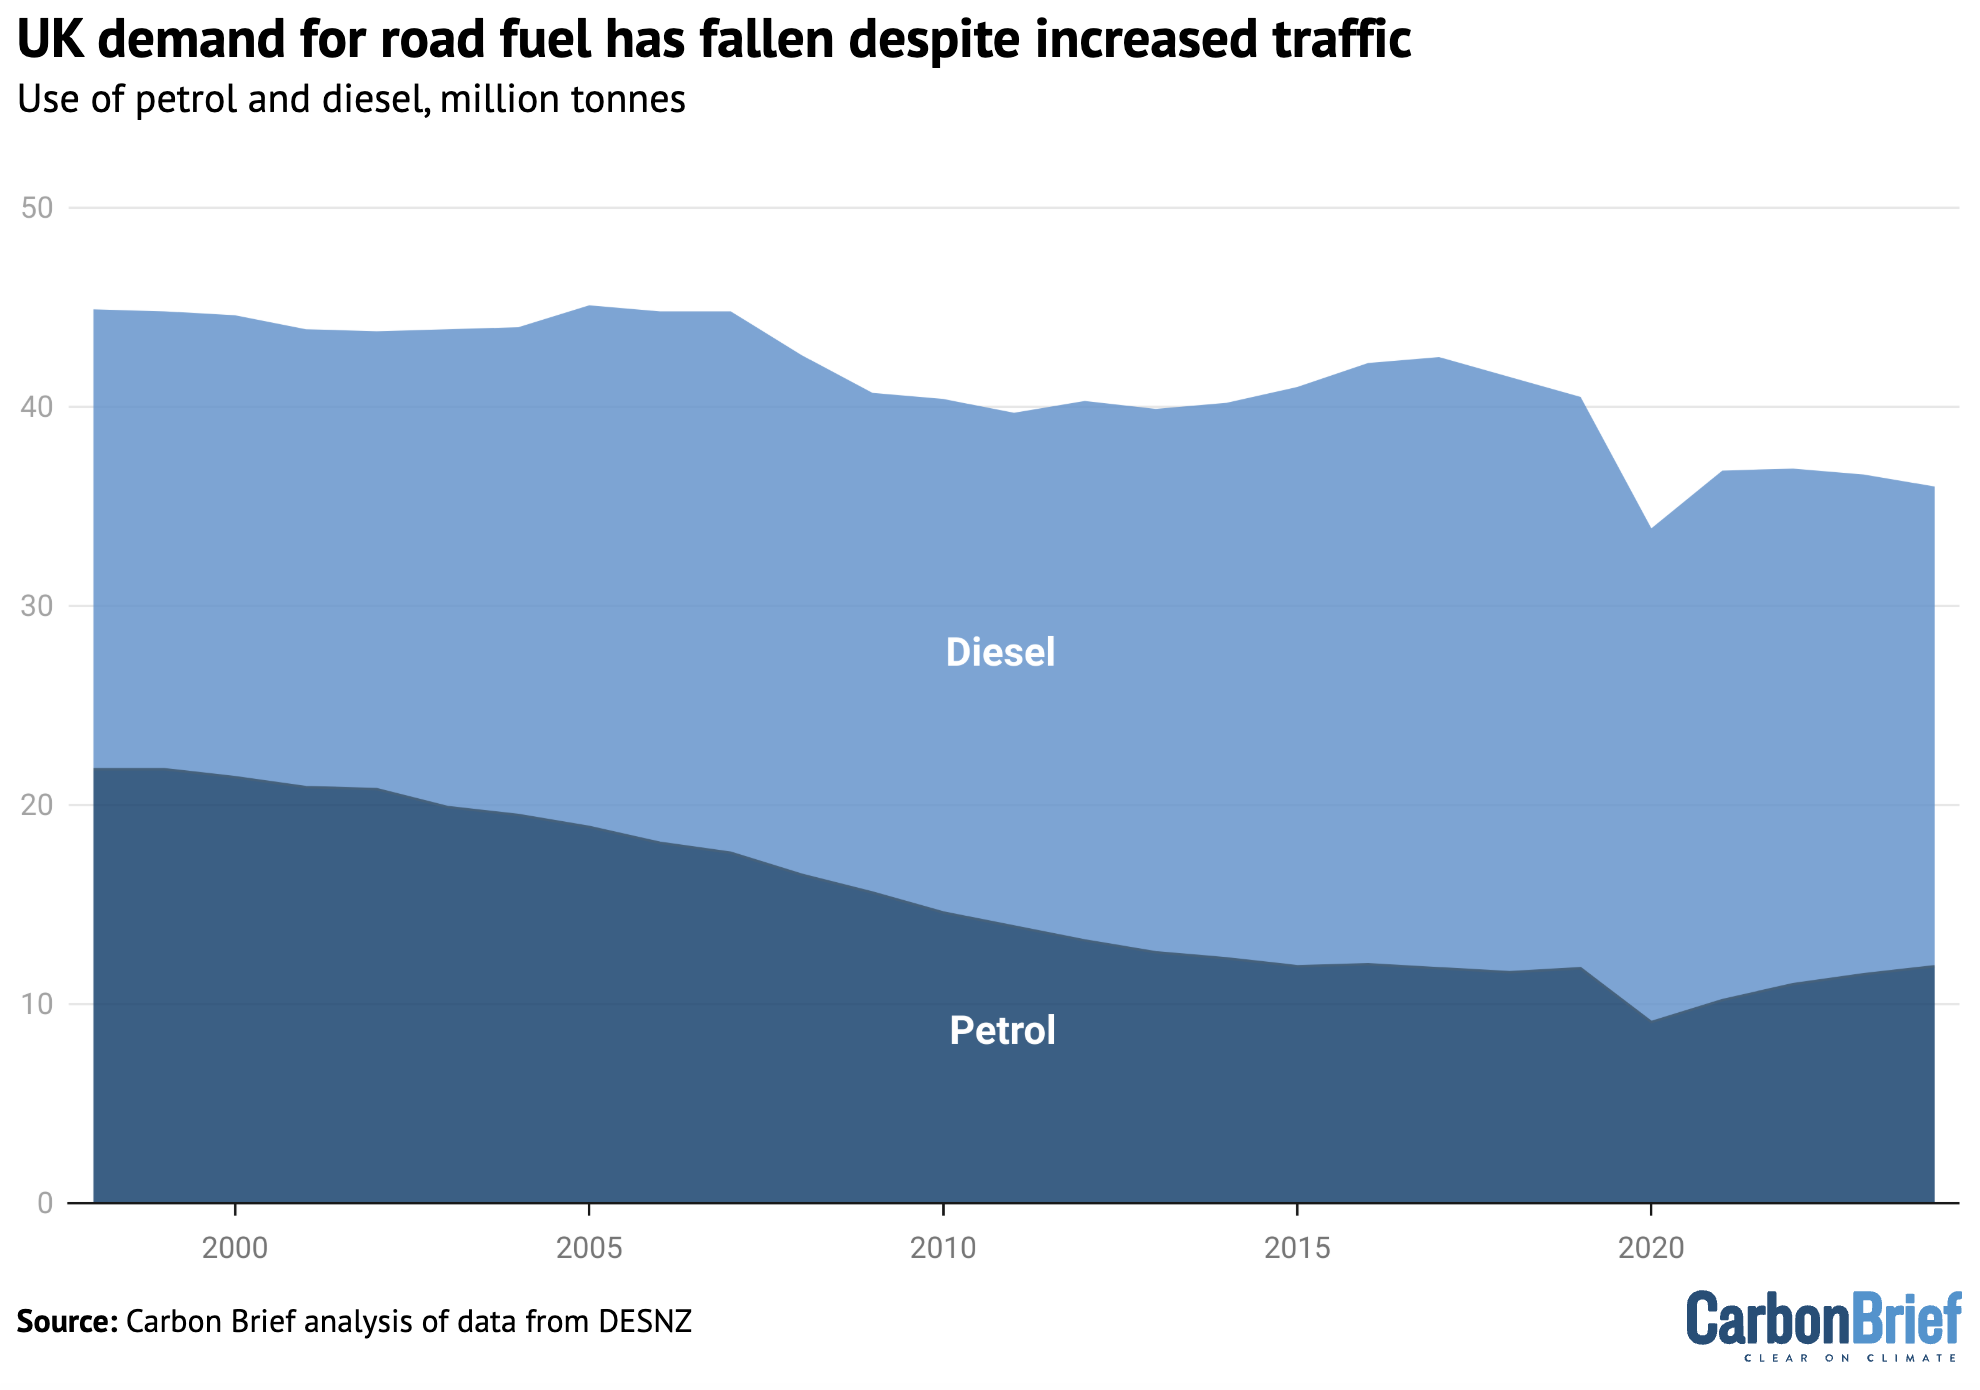
Along with improvements in fuel efficiency, the rise of EVs is a key part of this phenomenon.
The UK’s right-leaning newspapers have been busy finding new driving-related wordplay for what they have misleadingly described as a “stalling” market for EVs, which is apparently “going into reverse”.
The reality is that the number of EVs on the UK’s road rose from 1m in 2023 to 1.4m in 2024, an increase of 39% in just one year. The number of plug-in hybrids was up 28% to 0.8m.
Along with 76,000 electric vans, these EVs cut oil-related emissions by at least 5.9MtCO2e in 2024, Carbon Brief analysis finds, relative to similar vehicles burning petrol or diesel fuel.
These electrified vehicles have added around 4 terawatt hours to UK electricity demand in 2024, around 1% of the total. As such, the emissions associated with additional electricity generation, at around 0.5MtCO2e, offsets less than 10% of the savings from reduced oil use.
(On a lifecycle basis, EVs in the UK cut emissions by around 70% taking into account the emissions associated with manufacturing the cars, their batteries and fuelling them during use.)
Even more strikingly, the UK’s EV drivers saved around £1.7bn in lower fuel costs in 2024, Carbon Brief analysis finds, relative to petrol or diesel vehicles.
These savings, averaging roughly £800 per vehicle per year, conservatively assume that charging takes place at domestic retail electricity prices, rather than reduced-rate overnight tariffs.
Greenhouse gas emissions from burning gas also dipped in 2024, as demand for the fuel reached a record low. The roughly 2MtCO2e drop in emissions from gas made up around a sixth of the reduction in the UK overall and reflects the combined impact of competing trends.
Demand for heating in buildings (+3.8%) and offices (+0.6%) increased, despite temperatures being above average and higher than a year earlier. Industrial gas use also increased (+0.3%).
This is likely the result of lower fuel prices, which have eased since the peaks seen during the early phase of the global energy crisis precipitated by Russia’s invasion of Ukraine in 2022.
In contrast, gas demand for generating power fell by 13%, helping to make the UK’s electricity in 2024 the “cleanest ever”. This reduction was due to an increase in output from low-carbon sources, as well as an increase in the amount of cheap electricity imported from overseas.
A small, but still notable contributor to lower UK gas demand in 2024 came from reduced imports of liquified natural gas (LNG), which roughly halved compared with a year earlier.
Following Russia’s invasion, the UK had acted as an import hub for the rest of Europe, taking deliveries of LNG and then re-exporting the gas to the continent via pipelines. In 2024, however, European demand for gas eased and UK exports via the pipeline to Belgium also halved.
Import terminals use some of the gas they handle to “regasify” the supercooled LNG cargo that arrives by ship, turning it back into a gas that can be fed into pipelines. (The emissions associated with this process count towards the UK’s territorial total, even if the gas is burned overseas.)
In 2023, these terminals had used some 3TWh of gas, equivalent to the heating needs of half the homes in Birmingham. In 2024, LNG terminals used half this amount.
Emissions decoupling
While the UK’s emissions have fallen in most years since 1990, the baseline for the nation’s climate goals, the size of its economy has nearly doubled.
Specifically, emissions are “decoupling” from economic growth, having fallen to 54% below 1990 levels while GDP is up 84%, as shown in the figure below.

Taking an even longer view, the UK’s £2tn economy is now about 20 times larger than it was in 1872, after adjusting for inflation, whereas emissions are roughly the same.
Moreover, considering its population is now nearly 70 million people compared to 32m in 1872, the UK’s per-capita emissions have fallen two-fold, from 11.3tCO2e in 1872 to 5.4CO2e in 2024.
The 14MtCO2e drop in emissions in 2024 can be compared with the trajectory needed to reach the UK’s national and international climate pledges for 2035 and 2050.
If emissions fell by the same amount every year as they did in 2024, then the UK would miss both targets. It would need to cut emissions by 20MtCO2e each year to meet the 2035 target and by an average of 15MtCO2e per year to reach net-zero emissions by 2050.
In other words, annual emissions cuts would need to accelerate in the short- to medium-term, but could start to ease off later on. This is consistent with the cost-effective pathway to net-zero set out last month by the Climate Change Committee in its latest advice to the government.
Methodology
The starting point for Carbon Brief’s analysis of UK greenhouse gas emissions is preliminary government estimates of energy use by fuel. These are published quarterly, with the final quarter of each year appearing in figures published at the end of the following February. The same approach has accurately estimated year-to-year changes in emissions in previous years (see table, below).
| Year | Reported | Carbon Brief | Difference |
|---|---|---|---|
| 2010 | 2.4 | 2.6 | 0.2 |
| 2011 | -7.3 | -7.7 | -0.4 |
| 2012 | 2.9 | 3.6 | 0.7 |
| 2013 | -2.2 | -4.1 | -1.9 |
| 2014 | -7.5 | -7.5 | -0.0 |
| 2015 | -3.9 | -3.8 | 0.0 |
| 2016 | -5.2 | -5.7 | -0.4 |
| 2017 | -2.5 | -2.0 | 0.5 |
| 2018 | -1.5 | -1.8 | -0.3 |
| 2019 | -3.6 | -4.0 | -0.4 |
| 2020 | -8.8 | -8.9 | -0.0 |
| 2021 | 3.6 | 3.8 | 0.2 |
| 2022 | -4.2 | -3.5 | 0.7 |
| 2023 | -4.9 | -5.1 | -0.2 |
| 2024 | -3.6 |
Annual change in UK greenhouse gas emissions, %
One large source of uncertainty is the provisional energy use data, which is revised at the end of March each year and often again later on. Emissions data is also subject to revision in light of improvements in data collection and the methodology used, with major revisions in 2021.
The table above applies Carbon Brief’s emissions calculations to the comparable energy use and emissions figures, which may differ from those published previously.
Another source of uncertainty is the fact that Carbon Brief’s approach to estimating the annual change in emissions differs from the methodology used for the government’s own provisional estimates. The government has access to more granular data not available for public use.
Carbon Brief’s analysis takes figures on the amount of energy sourced from coal, oil and gas reported in Energy Trends 1.2. These figures are combined with conversion factors for the CO2 emissions per unit of energy, published annually by the UK government. Conversion factors are available for each fuel type, for example, petrol, diesel, gas and coal for electricity generation.
For oil, the analysis also draws on Energy Trends 3.13, which further breaks down demand according to the subtype of oil, for example, petrol, jet fuel and so on. Similarly, for coal, the analysis draws on Energy Trends 2.6, which breaks down solid fuel use by subtype.
Emissions from each fuel are then estimated from the energy use multiplied by the conversion factor, weighted by the relative proportions for each fuel subtype.
For example, the UK uses roughly 50m tonnes of oil equivalent (Mtoe) in the form of oil products, around half of which is from road diesel. So half the total energy use from oil is combined with the conversion factor for road diesel, another one-fifth for petrol and so on.
Energy use from each fossil fuel subtype is mapped onto the appropriate emissions conversion factor. In some cases, there is no direct read-across, in which case the nearest appropriate substitute is used. For example, energy use listed as “bitumen” is mapped to “processed fuel oils – residual oil”. Similarly, solid fuel used by “other conversion industries” is mapped to “petroleum coke”, and “other” solid fuel use is mapped to “coal (domestic)”.
The energy use figures are calculated on an inland consumption basis, meaning they include bunkers consumed in the UK for international transport by air and sea. In contrast, national emissions inventories exclude international aviation and shipping.
The analysis, therefore, estimates and removes the part of oil use that is due to the UK’s share of international aviation. It draws on the UK’s final greenhouse gas emissions inventory, which breaks emissions down by sector and reports the total for domestic aviation.
This domestic emissions figure is compared with the estimated emissions due to jet fuel use overall, based on the appropriate conversion factor. The analysis assumes that domestic aviation’s share of emissions is equivalent to its share of jet fuel energy use.
In addition to estimating CO2 emissions from fossil fuel use, Carbon Brief assumes that CO2 emissions from non-fuel sources, such as land-use change and forestry, are the same as a year earlier. The remaining greenhouse gas emissions are assumed to change in line with the latest government energy and emissions projections.
These assumptions are based on the UK government’s own methodology for preliminary greenhouse gas emissions estimates, published in 2019.
Note that the figures in this article are for emissions within the UK measured according to international guidelines. This means they exclude emissions associated with imported goods, including imported biomass, as well as the UK’s share of international aviation and shipping.
The Office for National Statistics (ONS) has published detailed comparisons between various different approaches to calculating UK emissions, on a territorial, consumption, environmental accounts or international accounting basis.
The UK’s consumption-based CO2 emissions increased between 1990 and 2007. Since then, however, they have fallen by a similar number of tonnes as emissions within the UK.
Bioenergy is a significant source of renewable energy in the UK and its climate benefits are disputed. Contrary to public perception, however, only around one-quarter of bioenergy is imported.
International aviation is considered part of the UK’s carbon budgets and faces the prospect of tighter limits on its CO2 emissions. The international shipping sector has a target to at least halve its emissions by 2050, relative to 2008 levels.

The post Analysis: UK emissions fall 3.6% in 2024 as coal use drops to lowest since 1666 appeared first on Carbon Brief.
Analysis: UK emissions fall 3.6% in 2024 as coal use drops to lowest since 1666
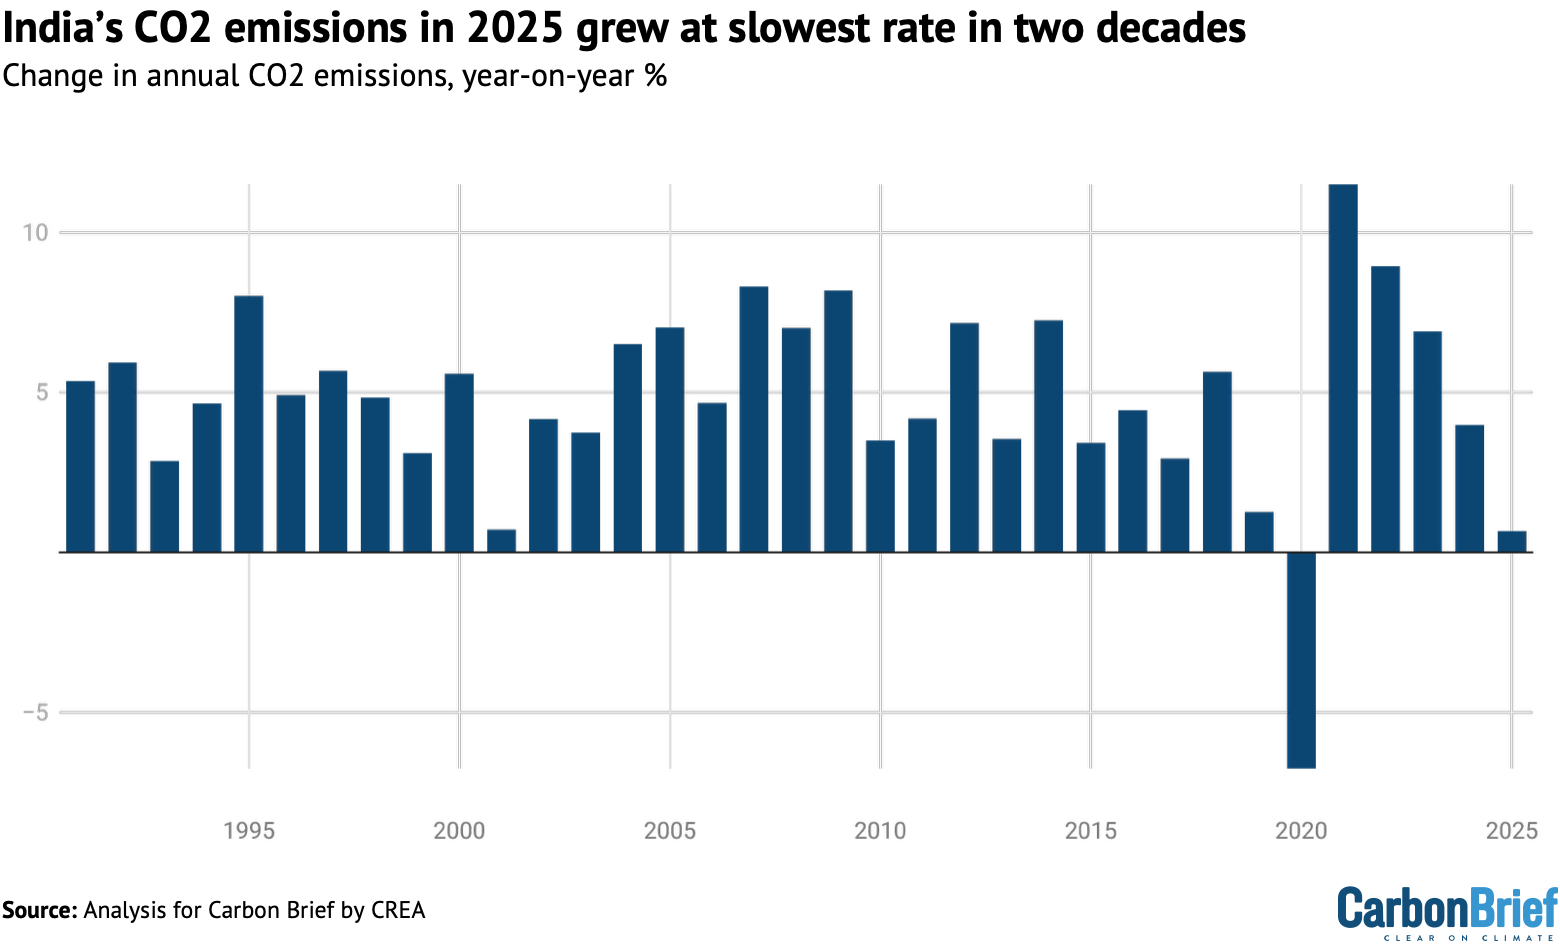
India’s carbon dioxide (CO2) emissions grew by 0.5% in the second half of 2025 and by just 0.7% in the year as a whole, the slowest rate in more than two decades.
This is a sharp slowdown from the growth of 4-11% in the preceding four years and marks the lowest rate of increase since 2001, excluding the impact of Covid in 2020.
This is the second in a new series of half-yearly analysis on India’s CO2 emissions from fossil fuels and cement, based on official data for fuel use, industrial production and power output.
Other key findings for 2025 as a whole include:
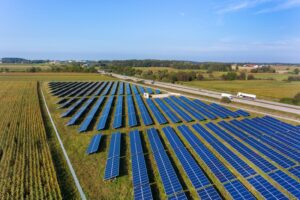
- Emissions in the power sector fell by 3.8% as record clean-energy growth combined with weak electricity demand.
- New clean-energy capacity in 2025 will add a record 90 terawatt hours (TWh) of electricity output each year, double the previous record set in 2024.
- The largest reductions in coal power were in the states leading on wind and solar.
- Oil demand grew by 0.4% and gas fell by 4%, far behind recent growth rates.
- Steel production surged by 8% and cement by 10%.
- In total, CO2 emissions went up slightly year-on-year, as increases from steel and cement outweighed the falls in gas demand and coal power.
- Consumption of imported coal at power plants fell by 20%, while gas imports fell by 6% and net oil imports were flat year-on-year, reducing India’s vulnerability to the impacts of the Iran war.
The analysis shows that India’s power sector is poised for a potential inflection point, where clean-energy additions can meet or exceed the growth in electricity demand.
If clean energy matches expectations, allowing this inflection point to take place, then coal-fired power output and the associated CO2 emissions would see sustained falls.
In addition, oil demand is falling in the petrochemical industry and is expected to slow down in the steel and cement sectors.
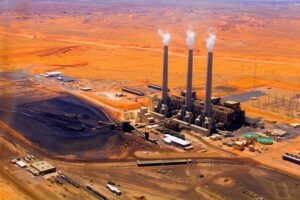
Despite these trends, which could signal a lasting slowdown in emissions, India is planning major expansions in its capacity for coal power, petrochemicals and coal-based steel.
The country’s Paris Agreement targets for 2035, which were published yesterday, did not reflect the potential for slower emissions increases or continued clean-energy growth.
The path of India’s CO2 emissions over the coming years depends on how it resolves these apparent contradictions regarding its future demand for fossil fuels.
Slowest growth since 2001
India’s CO2 emissions have been growing rapidly for decades, with annual increases averaging 4.9% per year since 1990 and 4-11% during 2021-24.
However, the recent pace of growth has been slowing down, as shown in the figure below. The 0.7% rise in 2025 was the slowest since 2001, excluding the impact of Covid in 2020.
Beneath the overall rise of just 0.7% in 2025, there were divergent trends in India’s key emitting sectors, with some seeing rapid rises in CO2 and others in historic decline.
This is shown in the figure below, which compares year-on-year changes in emissions during the first and second half of 2025 with the average for 2021-23.
Specifically, emissions fell by 3.8% year-on-year in the power sector, after the first drop in coal-power generation – outside Covid – since 1973. Oil products were more or less flat.
The small increase in 2025 overall was the result of strong growth from steel and cement.
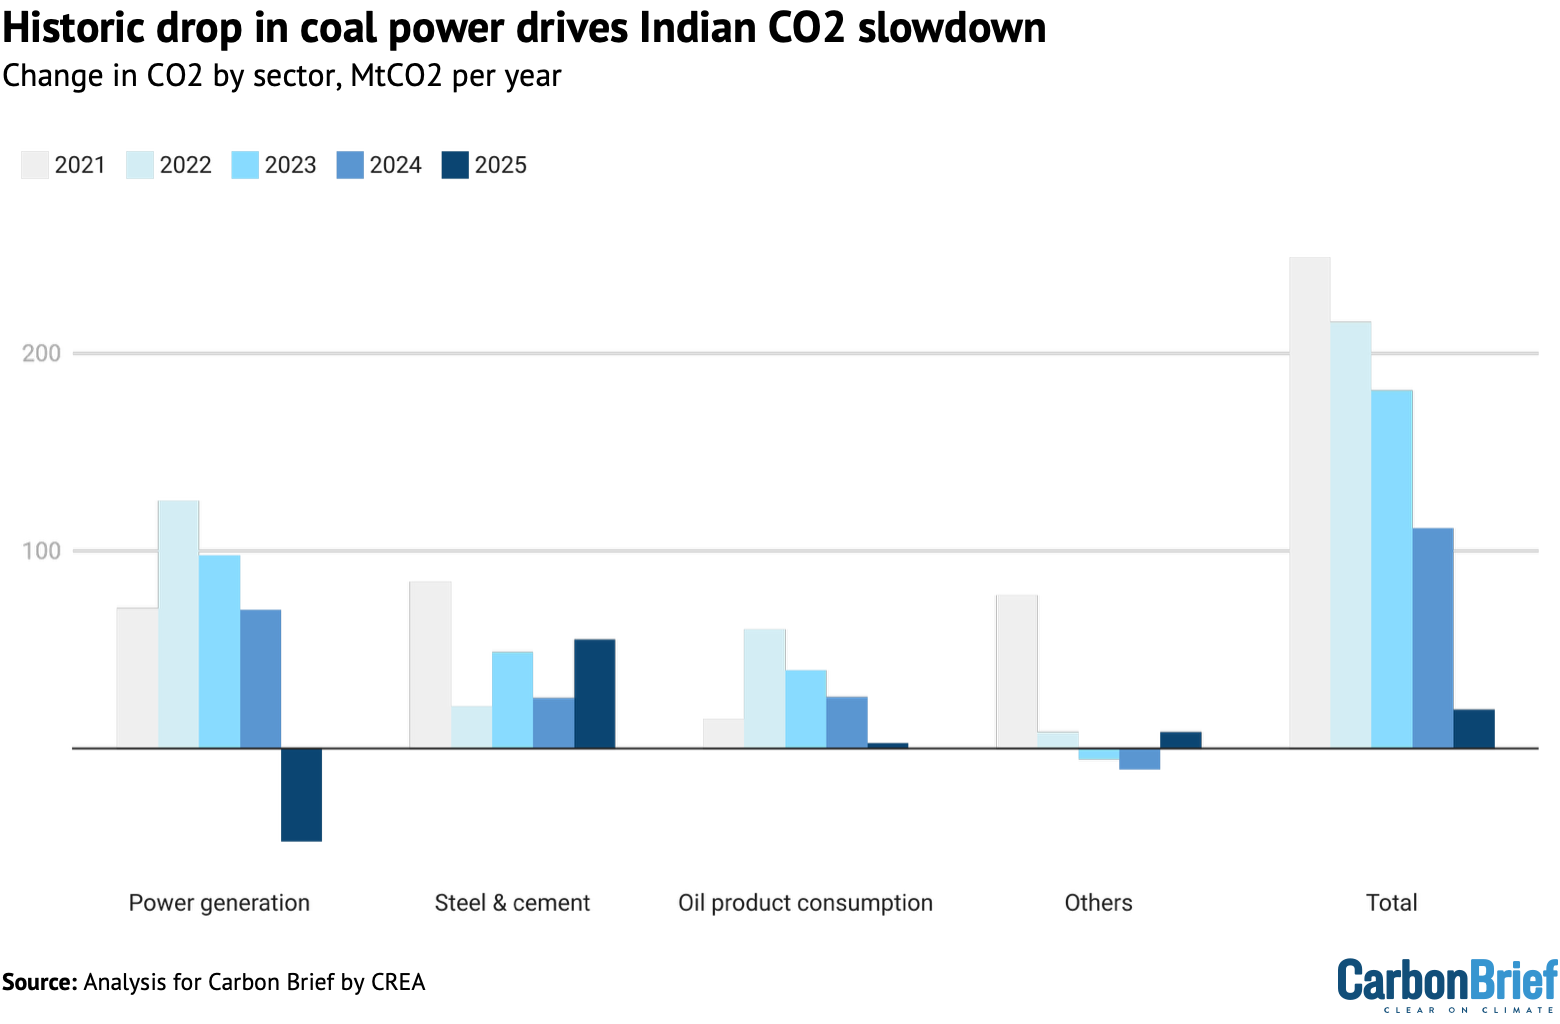
The fall in power-sector emissions is particularly notable, given it was the largest driver of emissions increases in 2021-2023, responsible for half of the total growth.
Across the sectors, the reductions and weak growth in fossil-fuel consumption eased India’s vulnerability to the recent price and supply disruptions taking place in the wake of the attacks on Iran by the US and Israel, as well as Iran’s subsequent retaliation.
Notably, India’s fossil-fuel imports were disproportionately affected by falling demand overall. For example, consumption of imported coal at power plants fell by 20% in 2025.
(Coal imports continued to fall in early 2026. However, the government is reported to be considering the use of an emergency clause that “would force coal power plants that run on imported coal to maximise output ahead of the summer season”, due to the impact of the Iran war on gas supplies.)
According to data from consultancy Kpler, gas imports fell 6% and net oil imports were flat, for the first time since the Covid-induced drop in 2020. The only rise in imports was of coal for steelmaking, which were up by 11% year-on-year in 2025.
Record clean-power growth
There were two key reasons why emissions fell in India’s power sector in 2025.
First, the country added 38 gigawatts (GW) of solar, 6.3GW of wind, 4.0GW of hydropower and 0.6GW of nuclear power in 2025.
The annual electricity generation from this new capacity, calculated based on the average capacity utilisation of each technology, amounts to 90 terawatt hours (TWh). This is twice as much as the clean generation added in 2024, which in itself was a record.
Power generation from solar grew by 30TWh and from wind by 20TWh in 2025, exceeding the 18TWh increase in total output. Hydropower also performed strongly due to high rainfall and capacity additions, with generation growing 21TWh.
Second, growth in total power demand slowed down from 7.4% in 2019-23 to 1% in 2025, which obviously played a major role in the fall in power-sector emissions.
The slow growth was due to both weather – with milder temperatures after 2024 heatwaves reducing the demand for air conditioning – and a more sustained slowdown in demand that had already started in late 2023 and was initially masked by the heatwaves. This slowdown in electricity demand is related to slower growth in industrial output and GDP.
Notably, the increase in clean-power generation from newly added capacity in 2025 was sufficient to cover demand growth of up to 5%. This means that power-sector emissions growth would have slowed down sharply, even if demand had not been flagging.
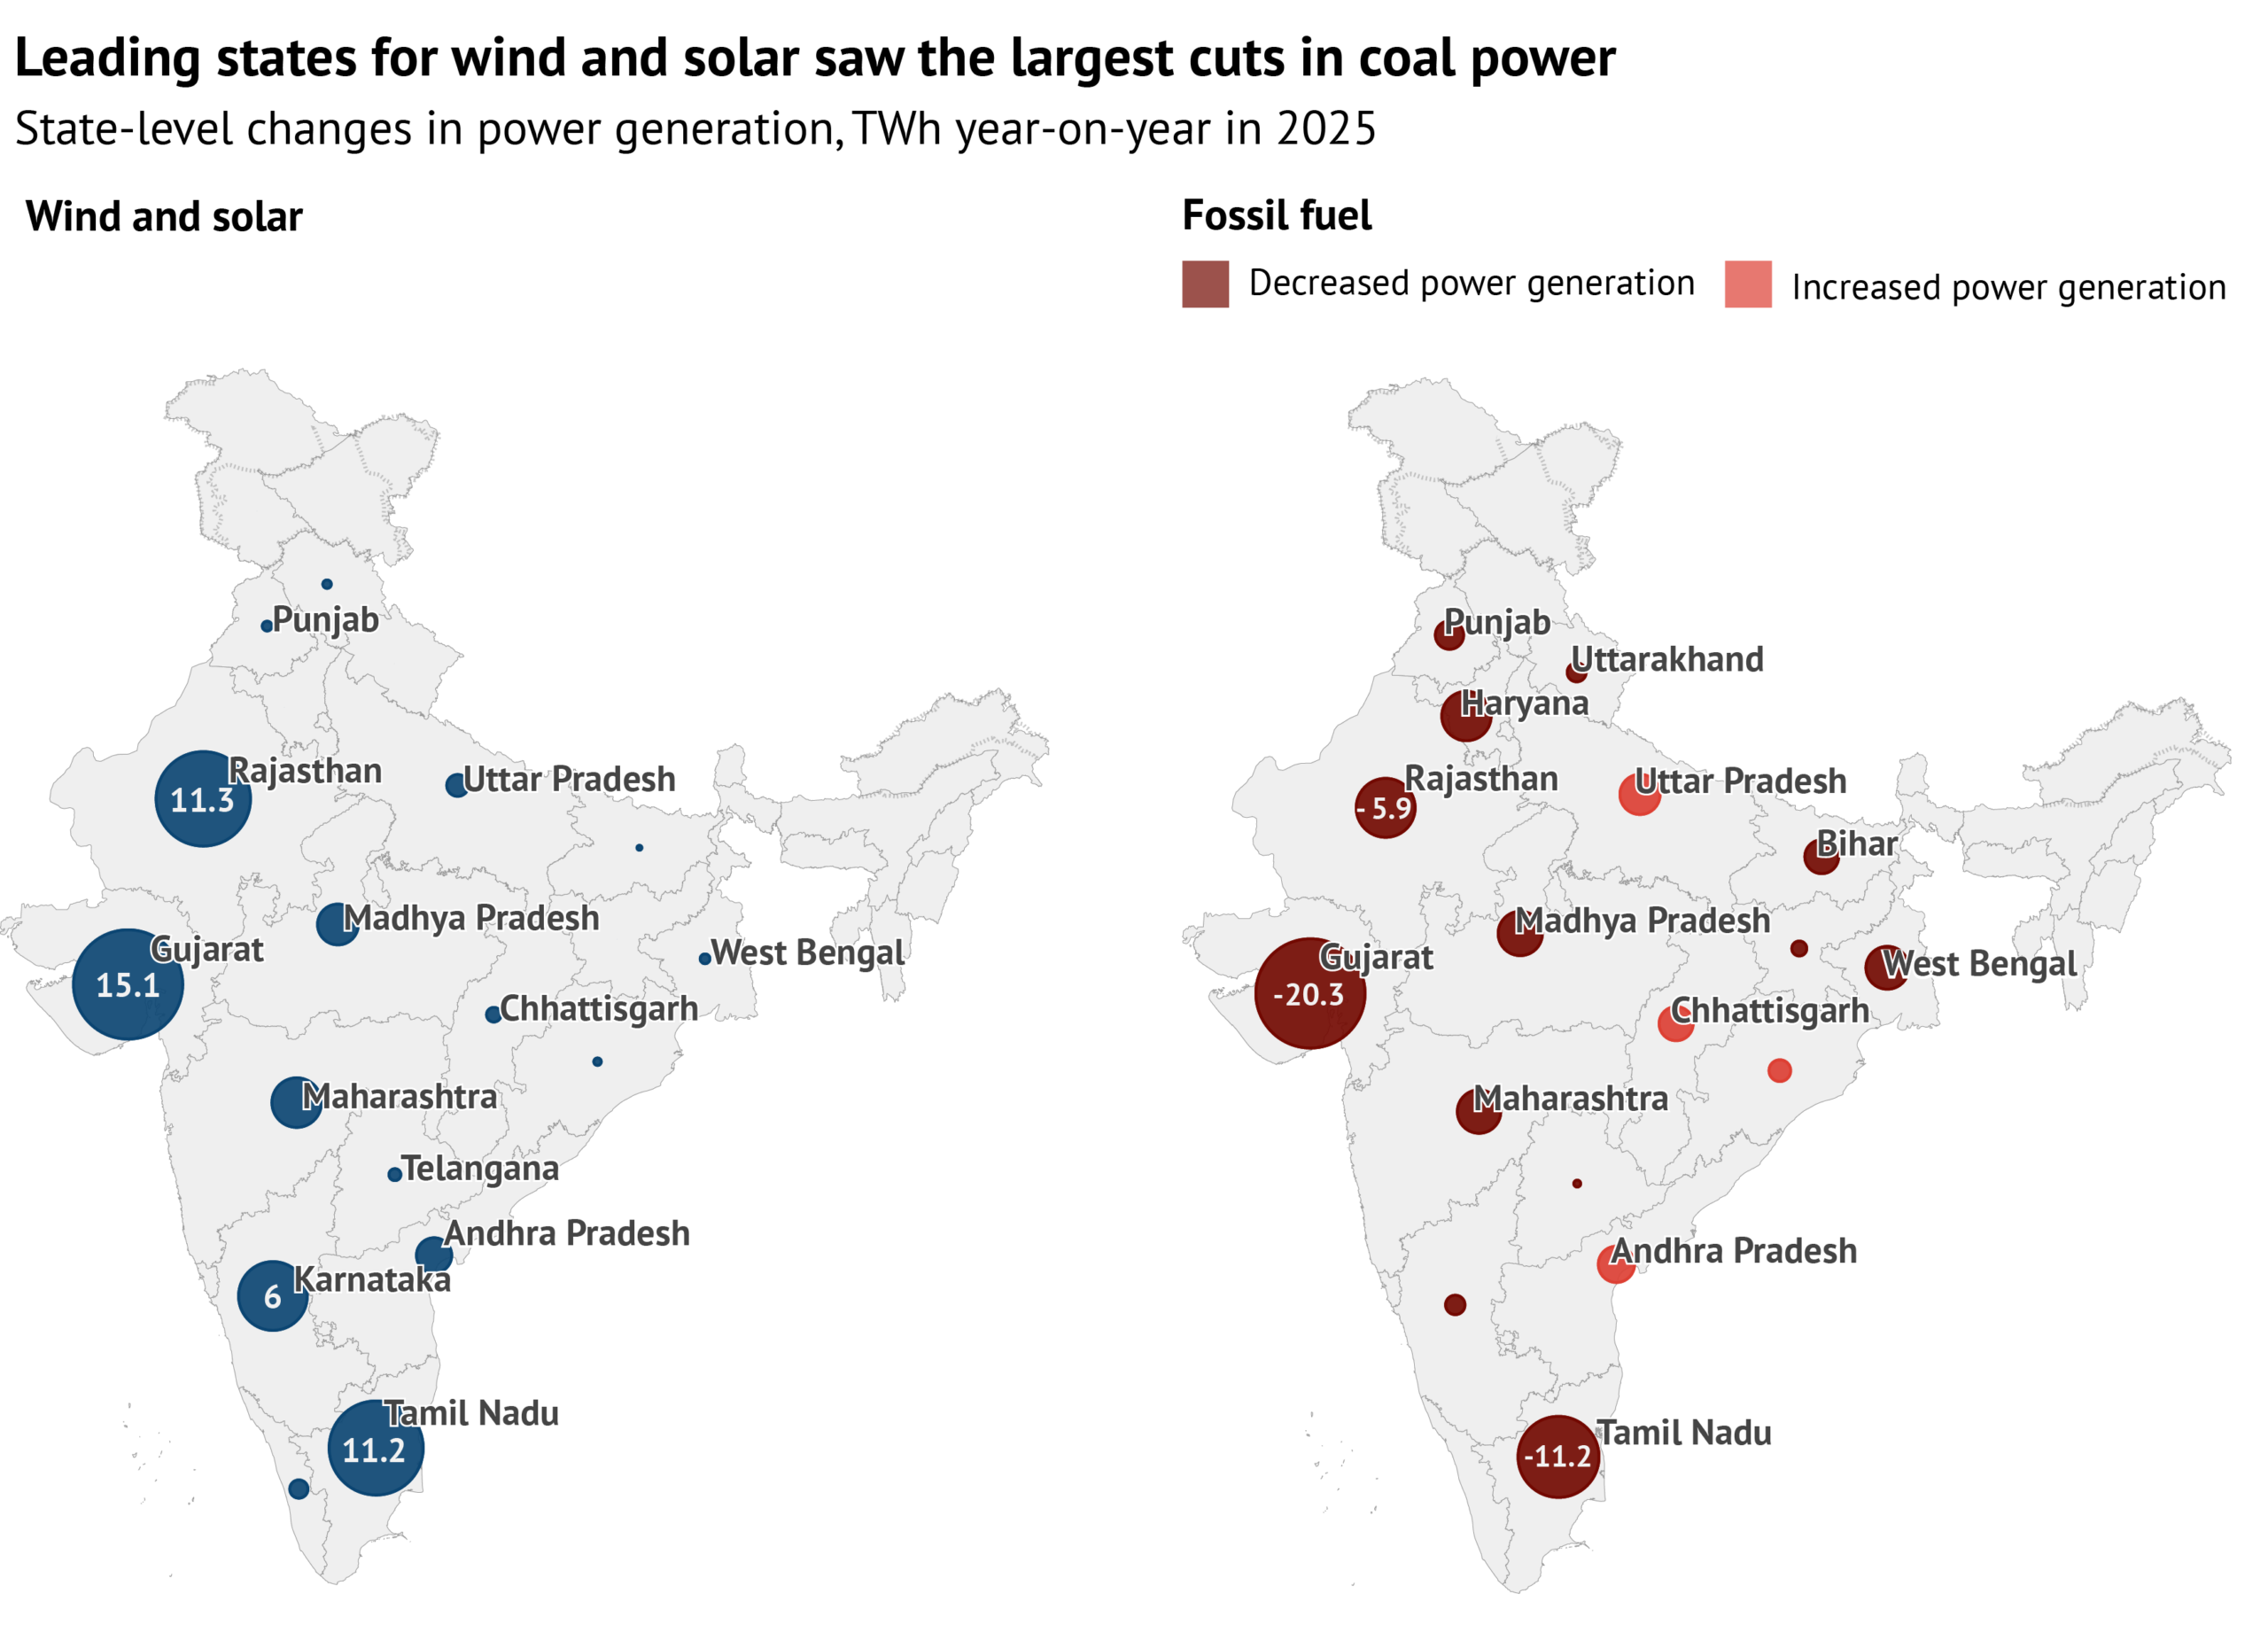
State-level analysis, shown in the figure below, emphasises the role of clean-energy growth in reducing fossil-powered generation.
The largest reductions in coal-fired power generation took place in Gujarat, Tamil Nadu and Rajasthan, the three states that also led the buildout of new solar and wind power.
Power demand is expected to pick up again, with Indian credit-rating agency ICRA projecting growth of 5.0-5.5% in the financial year starting in April 2026.
However, expected clean-energy additions should cover this level of growth.
BloombergNEF projects a 6% year-on-year increase in installed solar capacity in 2026. The government expects wind power capacity to reach 63GW by March 2027, a 10GW increase compared with the end of 2025, indicating a further acceleration of capacity additions compared with the 6GW added in 2025.
Indian utilities are also targeting the completion of construction on 6.8GW of new hydropower capacity, excluding pumped storage, and 1GW of nuclear capacity in 2026.
These capacity additions would deliver additional annual generation of more than 100TWh, enough to cover demand growth of up to 5.8%.
This means that India’s power sector could reach an inflection point this year, where clean-energy growth matches the expected average rise in demand, as shown below.
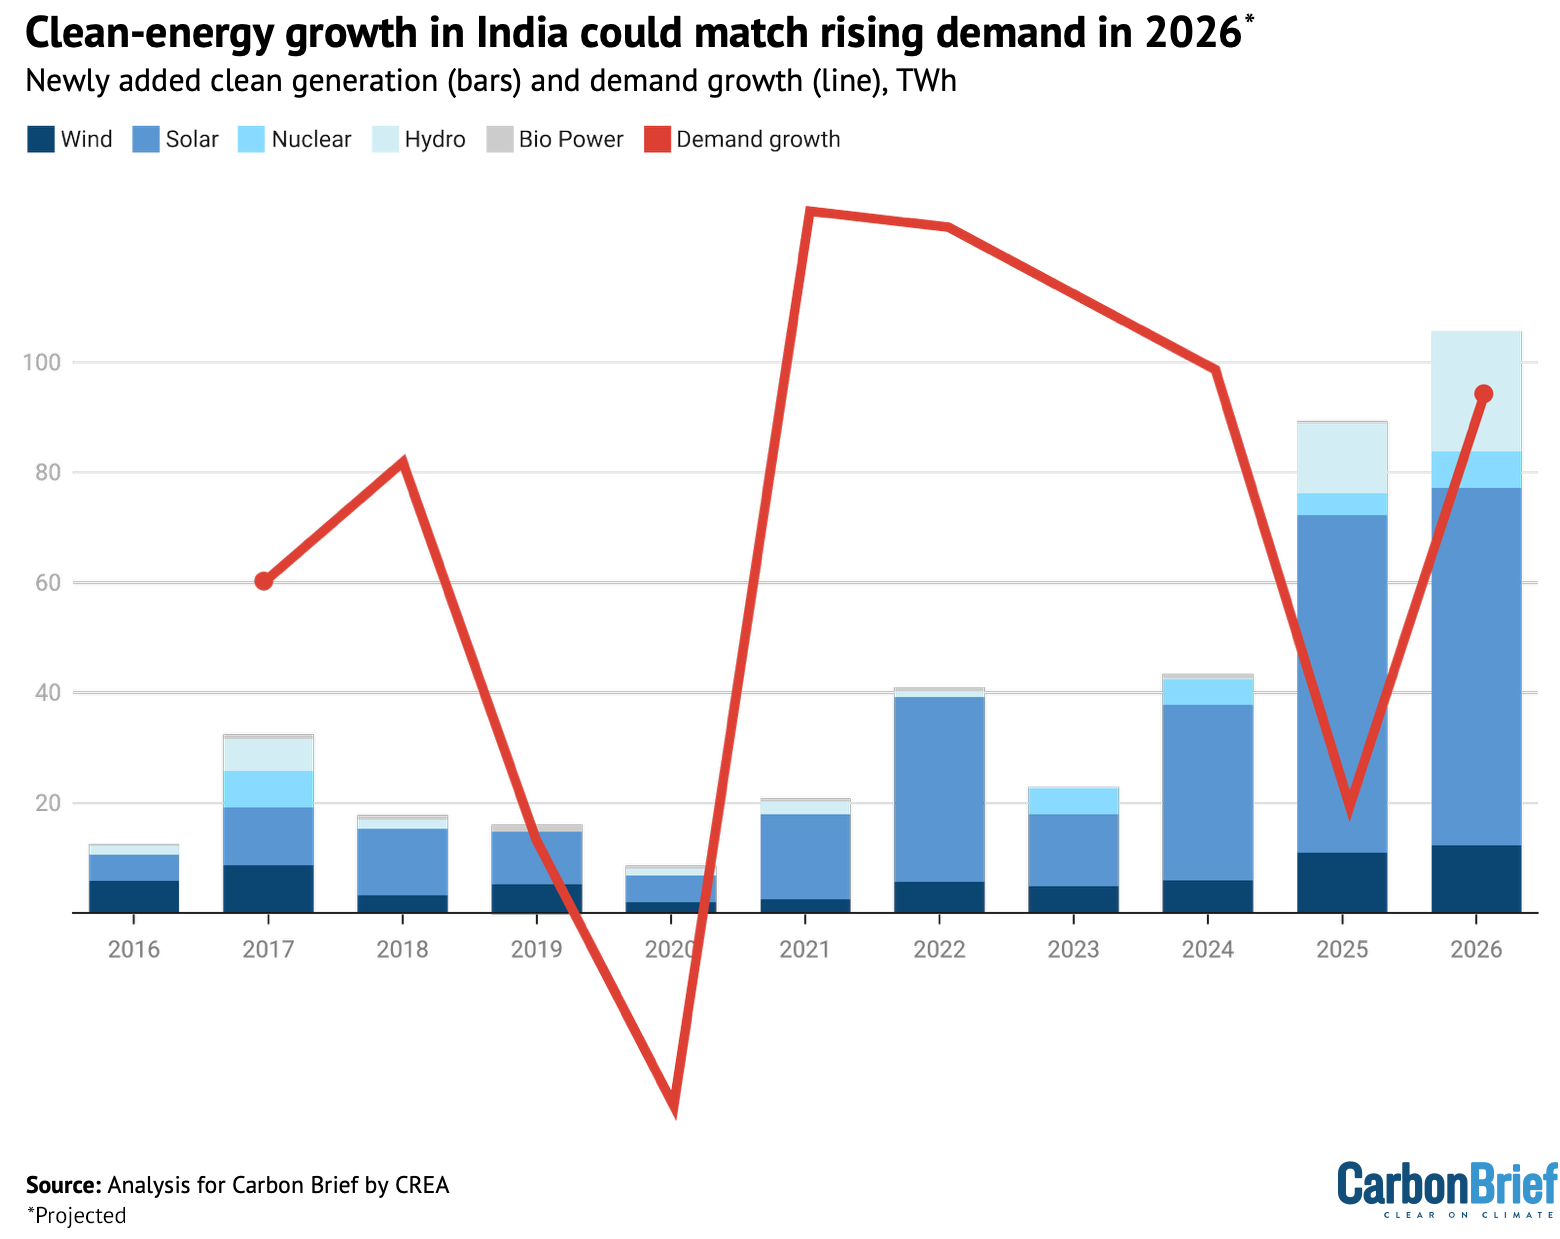
Over the next five years, ICRA forecasts annual average demand growth of 6.0 to 6.5%.
Yet India is also targeting 500GW non-fossil power generation capacity by the financial year 2029-2030. If achieved, this target would increase non-fossil power generation by enough to cover electricity demand growth of 6.6%, without needing to increase fossil-fuel generation, based on the Central Electricity Authority’s projected power generation.
If the actual growth rate for power demand is lower than this and if the non-fossil capacity target is still reached, then fossil-power generation – and the associated CO2 emissions – would fall in absolute terms from 2025 to financial year 2029-2030.
Battery energy storage is also increasingly affordable and will reduce the need for thermal power capacity in the system.
Oil slows on falling industrial demand
For oil demand, which slowed from 3.9% growth in 2024 to 0.4% in 2025, the key drivers came in the petrochemical and cement industry, where demand fell.
Specifically, demand fell for naphtha, petcoke and other oil products. Naphtha is used as chemical industry feedstock, while petcoke is used mainly in cement production.
Part of the fall in demand was due to an increase in India’s imports of plastics and precursors, which rose by 7% in volume terms, while exports fell.
The increase in imports came almost entirely from China, where the petrochemical industry is expanding, leading to complaints in India of price dumping. Mirroring the shift of plastics production to China, India began exporting large volumes of naphtha to the country.
India’s imports of nitrogen fertilisers also increased sharply, with most of the increase coming from China and Russia, while domestic production fell by 6% in April-September. Fertiliser production is the second-most important use of naphtha.
Petcoke use in cement production fell slightly, by 1%, even as cement production surged, as producers shifted to using more domestic coal in response to rising petcoke prices.
In the transport sector, petrol and diesel growth moderated in 2025, as the slow rebound to the pre-Covid trend in demand had finally played out. In addition, mobility was reduced in 2025 due to heavy monsoon rains in June to August.
Meanwhile, compressed natural gas (CNG) and electric vehicles also cut into the markets for passenger cars and light commercial vehicles, eating into petrol and diesel demand, respectively. EV sales grew 16% in 2025 and made up 8% of auto sales, helped by a reduction in the goods and services tax (GST) on EVs from 12% to 5%.
GST reform also reduced diesel consumption in a more surprising way, by eliminating the need for manual inspection of cargoes and cutting long wait-times at interstate border posts.
Diesel demand growth was also moderated by a government scheme to replace diesel irrigation pumps, which consume 5% of all diesel in the country, with solar-powered models.
Air pollution rules also played a role in some cities, including the capital Delhi. There, regulations on diesel vehicles resulted in a 13% reduction in sales from a year earlier, continuing the trend observed over the past two years.
Experts attribute lower sales of diesel vehicles to changes in consumer behaviour, following the long-standing ban on diesel vehicles older than 10 years and petrol models of more than 15 years in the wider Delhi National Capital Region (NCR), as well as a Supreme Court order in August 2025 that stressed the need for vehicles to comply with newer emissions rules.
Finally, aviation fuel demand growth slowed from 10% in 2024 to 3% in 2025, as the return to the pre-Covid trend in rising traffic leveled off.
The most immediate effect of the oil and gas crisis caused by the blockade of the Strait of Hormuz has been on the supply of liquified petroleum gas (LPG), which in India is used almost solely as cooking fuel.
Shortages have affected households, restaurants and industries. LPG consumption had grown by 6% year-on-year in 2025, in line with the longer-term trend, but is responsible for only 3% India’s CO2 emissions.
The crisis has reportedly also prompted a shift to cooking with electricity, with the sales of induction stoves reportedly surging.
Steel and cement continue to surge
The overall rise in India’s emissions in 2025 was driven by strong growth in output for steel and cement, which went up by 8% and 10%, respectively. The two sectors were responsible for 21% of India’s total CO2 emissions from fossil fuels and industrial processes in 2025.
India’s steel sector is more polluting than elsewhere, with the CO2 per unit of production – its emissions intensity – being more than 20% higher than the global average.
Two-thirds of steel is used for construction. Strong steel demand in 2025 reflected growth in new housing construction in earlier years, as the market was rebounding from the mid-2010s crash and the Covid pandemic. However, new project launches and sales both declined in 2025.
Domestic steel output growth was attenuated in the first half of the year by increases in steel imports from China, Japan and South Korea. This resulted in the government enacting a temporary blanket tariff in April 2025 for 200 days to curb imports.
As a result, steel output growth accelerated from 6% in January to May to 10% in the rest of the year. In November 2025, when the earlier temporary tariff expired, the government imposed new tariffs on a more targeted list of countries.
It imposed a three-year step-down tariff – 12% in the first year, 11.5% in year two and 11% in year three – to curb imports from China, Vietnam and Nepal, as these countries were found to exceed the thresholds for imports for various steel products.
In spite of the tariffs, the industry is struggling with weak profitability. Output growth has “led to a situation of oversupply”, according to ICRA, resulting in falling profitability and capacity utilisation, particularly at smaller mills, which account for 41% of total steel production.
Delays in construction and infrastructure projects are also weighing down on India’s steel demand, leading to rising inventories and falling prices. This is likely to affect the demand for steel, cement and bitumen in 2026.
Meanwhile, government initiatives could encourage a shift in the type and emissions intensity of steel production. State-backed schemes – particularly programmes to build affordable urban and rural housing – are significant steel demand drivers.
The Ministry of Steel is working on mandates for “green steel” in public procurement as part of a broader Green Steel Mission aimed at decarbonising the sector.
The policy is expected to require government agencies and publicly funded projects to buy lower-emission steel, creating demand for greener production.
Power could be nearing an inflection point
The sharp slowdown in India’s overall CO2 emissions growth has now lasted 18 months, making it increasingly likely that it is not just a blip.
Electricity demand growth slowed down sharply in 2025, which could be taken to imply that the lower growth in CO2 last year was mainly down to fluctuations in power demand.
However, clean-energy growth in 2025 was large enough to have stabilised emissions in the power sector, even if demand growth had been at historical rates.
Now, power-sector emissions could be about to reach an inflection point, with clean-energy additions projected to overtake average rate of electricity demand growth in 2026, for the first time. This already happened in 2025 in Gujarat, Rajasthan and Tamil Nadu, the highly populated states leading solar and wind development.
If clean-energy growth rates continue and if demand growth stays at expected levels, then clean energy will cover all of the growth in electricity demand. This would mean that electricity generation from fossil fuels would level off or decline.
Given that the power sector was the largest driver of emissions increases in 2021-2023, peaking coal-fired power generation and emissions from the sector would have a major impact on India’s overall fossil-fuel consumption and emissions.
The other significant emitting sector where emissions have been falling in India is the petrochemical industry.
In contrast, the steel industry has continued to increase output, even though it is struggling with profitability and concerns about overcapacity, while demand for steel and cement is expected to cool down this year due to lower growth in construction volumes.
Despite these trends, the country is planning for a major expansion of all of these industries. The government plans to add 85GW of new coal-fired power capacity over the next seven years. The country is also targeting $1tn of investment in the petrochemical industry by 2040, a 50% increase in steel production capacity from 2025 to 2031 and a 25% increase in cement production capacity in the three years from 2026 to 2028.
The planned investment in steelmaking is overwhelmingly coal-based capacity. This will increase the sector’s reliance on metallurgical coal, which is almost entirely imported, as well as running against government ambitions to increase lower-carbon steelmaking.
India’s Cabinet approved new 2035 climate pledges for the country yesterday. The targets are a reduction in carbon intensity – the emissions per unit of GDP – of 47% from 2005 level by 2035 and a non-fossil energy share of 60% in power generation capacity.
The 60% target would already be achieved by 2030, under the Central Electricity Authority’s recent projections. The carbon-intensity target would allow the country’s CO2 emissions growth to accelerate in the next 10 years, compared with the preceding decade, even as the recent clean-energy growth suggests that a substantial slowdown is possible.
If GDP growth averages 7.8%, the rate needed to meet India’s 2047 economic goals, then CO2 emissions could increase at 6% per year from 2025 to 2035 while still meeting the carbon-intensity target, compared with less than 4% growth from 2015 to 2025.
India’s energy and emissions trajectory over the next 5-10 years will depend heavily on how these apparent contradictions are resolved. This is particularly true in the power sector, where clean energy and storage are already set to cover future growth.
About the data
This analysis is based on official monthly data for fuel consumption, industrial production and power generation from different ministries and government institutes.
Coal consumption in thermal power plants is taken from the monthly reports downloaded from the National Power Portal of the Ministry of Power. The data is compiled for the period January 2019 until June 2025. Power generation and capacity by technology and fuel on a monthly basis are sourced from the NITI data portal.
Coal use at steel and cement plants, as well as process emissions from cement production, are estimated using production indices from the index of eight core industries released monthly by the Office of Economic Adviser, assuming that changes in total fossil fuel use follow production volumes.
These production indices were used to scale fuel use by the sectors in 2022. To form a basis for using the indices, monthly coal consumption data for 2022 was constructed for the sectors using the annual total coal and petcoke consumption reported in IEA World Energy Balances and monthly production data in a paper by Robbie Andrew, on monthly CO2 emission accounting for India. Monthly petcoke consumption was available from the Petroleum Planning and Analysis Cell, and coal consumption by the cement industry was calculated by subtracting petcoke use from total fossil fuel use.
Annual cement process emissions up to 2024 were also taken from Robbie Andrew’s work and scaled using the production indices. This approach better approximated changes in energy use and emissions reported in the IEA World Energy Balances, than did the amounts of coal reported to have been dispatched to the sectors, showing that production volumes are the dominant driver of short-term changes in emissions.
For other sectors, including aluminium, auto, chemical and petrochemical, paper and plywood, pharmaceutical, graphite electrode, sugar, textile, mining, traders and others, coal consumption is estimated based on data on despatch of domestic and imported coal to end users from statistical reports and monthly reports by the Ministry of Coal, as consumption data is not available.
Coal consumption by “captive” coal power plants – those supplying power to industrial sites, not to the public electricity network – was calculated based on capacity changes from Global Energy Monitor, assuming constant utilisation, as utilisation has been very stable year-to-year, as calculated from Central Electricity Authority data.
The difference between coal consumption and dispatch is stock changes, which are estimated by assuming that the changes in the amount of coal stored at end user facilities mirror those at coal mines, with end user inventories excluding power, steel and cement assumed to be 70% of those at coal mines, based on comparisons between our data and the IEA World Energy Balances.
Stock changes at mines are estimated as the difference between production at and dispatch from coal mines, as reported by the Ministry of Coal.
Coal consumption is estimated in two ways, for sectors beyond power, steel and cement. Consumption of domestic coal in these other sectors is taken from the monthly reports by the Ministry of Coal. Their consumption of imported coal is estimated from the total imports of thermal coal reported by consultancy Kpler, by subtracting demand for imports at coal-power plants. The basis for this assumption is that steel and cement industries use little imported thermal coal, according to Ministry of Coal data.
Product-by-product consumption data for petroleum products, as well as gas use by sector, is from the Petroleum Planning and Analysis Cell of the Ministry of Petroleum and Natural Gas.
As the fuel dispatch and consumption data is reported as physical volumes – such as tonnes or litres – calorific values are taken from IEA’s World Energy Balance and CO2 emission factors from 2006 IPCC Guidelines for National Greenhouse Gas Inventories.
Calorific values are assigned separately to different fuel types, including domestic and imported coal, anthracite and coke, as well as to petrol, diesel and several other oil products.


The post Analysis: India’s CO2 emissions in 2025 grew at slowest rate in two decades appeared first on Carbon Brief.
Analysis: India’s CO2 emissions in 2025 grew at slowest rate in two decades
Caroline Tracey’s book “Salt Lakes: An Unnatural History,” traces the history and decline of some of the world’s saline lakes, but also looks at how “queer ecology” can help us find our place in ephemeral environments.
When Mormon settlers descended upon the Salt Lake Valley in 1847, the land was an oasis.
Lessons From Salt Lakes for Making a Home in a Changing World
The Iran war has triggered another fossil-fuel energy crisis, with surging global prices and increasing concerns over energy security.
In the UK, many newspapers, opposition politicians and other public figures have used the crisis to argue in favour of issuing more licences for oil and gas drilling in the North Sea.
These arguments have also been amplified in AI-generated posts on social media, shared by fake accounts that usually post anti-immigrant and anti-Muslim content.
However, many of these arguments rest on false or misleading claims about the impact that further drilling could have on the UK’s bills, energy security, emissions and tax revenue.
The North Sea is a “mature basin” where production has been falling for decades, because most of the oil and gas it once contained has already been extracted.
While it would be possible to slow the rate of decline in oil and gas output from the North Sea, the quantities that would be economic to extract are disputed.
Overall, the transition to clean-energy supplies is expected to be far more effective at boosting UK energy security and reducing reliance on imports.
Moreover, the climate-change arguments for limiting fossil-fuel production, which have been made by scientists, the UN secretary general and even the Pope, remain as valid as ever.
Below, Carbon Brief factchecks some of the most common claims about North Sea oil and gas.
- FALSE: ‘Reopening the North Sea would lower bills’
- MISLEADING: ‘Energy from the North Sea generates a lot less CO2’
- FALSE: ‘Britain is a resource-rich nation that has chosen dependency’
- FALSE: North Sea is ‘best way to protect us from volatility and provide energy security’
- MISLEADING: ‘The head honchos of the green lobby say we should drill’
- FALSE: ‘The UK is the only country in the world banning new oil and gas licenses’
- MISLEADING: ‘With new North Sea licences would come thousands of jobs’
- MISLEADING: North Sea drilling ‘would secure a rush of revenue into the Treasury’
- FALSE: Ed Miliband is an ‘anti-North Sea’ climate change ‘fanatic’
FALSE: ‘Reopening the North Sea would lower bills’
Many right-leaning newspapers and commentators have falsely argued that opening up new oil and gas fields in the North Sea would lower energy bills in the UK.
There is no evidence to support such claims. Indeed, numerous experts have explained that new drilling would make no difference to bills in the UK.
For example, the Daily Express carried fact-free assertions from the hard-right, climate-sceptic Reform party on its frontpage under the headline: “Get drilling to stop bills soaring.” Despite the UK not using oil to generate power, it claimed:
“Open[ing] up the UK’s biggest oil field [would] stop power bills soaring.”
At the beginning of March, US president Donald Trump told the Sun that his advice to UK prime minister Keir Starmer would be:
“Open up the North Sea. Immediately. Your energy prices are through the roof.”
In the Daily Telegraph, an “energy consultant” called Kathryn Porter, who has authored “papers” for climate-sceptic lobbyists, listed why she thinks more drilling could cut energy bills under the headline: “Reopening the North Sea would lower bills.”
On Twitter, Reform said the Labour and Conservative governments had “failed the British people” by “refusing to drill in the North Sea”. It added that more drilling would make “Britain energy independent once again” and “bring down bills”.
Contrary to these claims, numerous experts have said that further drilling in the North Sea would do nothing to cut bills, because UK energy prices are set on international markets.
In 2022, the Climate Change Committee (CCC) wrote that increased UK extraction was not expected to “materially affect global oil or gas prices, as the UK energy market is highly connected to international markets and the potential supply [is] relatively small”.
It added that, even if all proven UK reserves and resources of gas from new fields were extracted, this would only meet about 1% of European demand each year up to 2050.
Jack Sharples, senior research fellow at the Oxford Institute for Energy Studies (OEIS), tells Carbon Brief that “you’re not going to bring prices down versus the current level, because you’re not going to be able to produce very much more [from the North Sea]”.
The Labour government has made similar arguments, saying in a “factsheet” on the Iran crisis that the UK is a “price-taker…not [a] price-maker”. It said:
“Future exploration in the North Sea is too marginal to make a difference to the overall supply in an international market…New licences to explore new fields wouldn’t make any difference to the prices set by international markets and paid by UK billpayers.”
Even shadow energy secretary Claire Coutinho, who has advocated strongly for further drilling, admitted in 2023 that new licenses “wouldn’t necessarily bring energy bills down”.
The North Sea is a “mature basin”, with around 90% of what it contained “already drained dry”. Most of what is produced for the basin is now oil, around 80% of which is exported.
In addition, oil and gas reserves are owned by private companies once licences are issued and the fuel is sold at international rates. Therefore, whether it is produced in the North Sea or elsewhere, its price is driven by the global market.
Moreover, the limited quantity of gas left in the ageing North Sea basin would do little to impact international markets and, thus, little to impact international prices.
Climate YouTuber Simon Clark discusses whether more North Sea oil and gas drilling could lower energy bills in the UK.
Recent analysis by the Smith School at the University of Oxford found that, even if the UK maximised North Sea oil and gas and used all revenues from the sector to subsidise lower energy bills, the impact would be limited. Under this unlikely scenario household bills could fall between £16 and £82 per year, or 1-4.6% a year.
The fact that further oil and gas production in the North Sea would have a limited impact on energy bills has been noted repeatedly, even by those in favour of drilling in the North Sea.
For example, in a separate comment piece in the Daily Telegraph calling on the UK to “max out on both renewables and North Sea oil and gas”, world economy editor Ambrose Evans Pritchard wrote:
“Reopening the North Sea would not make any difference to the current crisis, nor any difference to gas and petrol prices in the UK, since the volumes are too small to shift the traded global market.”
As such, the UK Energy Research Centre (UKERC) explained in a recent note:
“Squeezing additional oil and gas production from the UK may be technically possible, but it will have [a] negligible impact on the UK cost of living”.
MISLEADING: ‘Energy from the North Sea generates a lot less CO2’
Many North Sea advocates argue that drilling more in the basin would mean lower carbon dioxide (CO2) emissions, due to the high emissions from imported fossil fuels.
This is a line often used by the oil-and-gas industry itself, with the trade body Offshore Energies UK (OEUK) stating that “North Sea gas has a lower emissions footprint than liquified natural gas (LNG) from overseas”.
Additionally, it is an argument that is sometimes used by commentators who – in other circumstances – would not be making the case for low-carbon policies.
For example, in a Mail on Sunday column, the climate-sceptic journalist Andrew Neil wrote that “giving the North Sea a new lease of life” would:
“Even lower carbon emissions (because piping in energy from the North Sea generates a lot less CO2 than importing it).”
Conservative shadow energy secretary, Claire Coutinho, has also used this approach to question the government’s supposed opposition to North Sea drilling, writing in the Daily Telegraph:
“Doing so in the name of climate change when our own gas has four times fewer emissions than the LNG we’ll need to import instead? Unforgivable.”
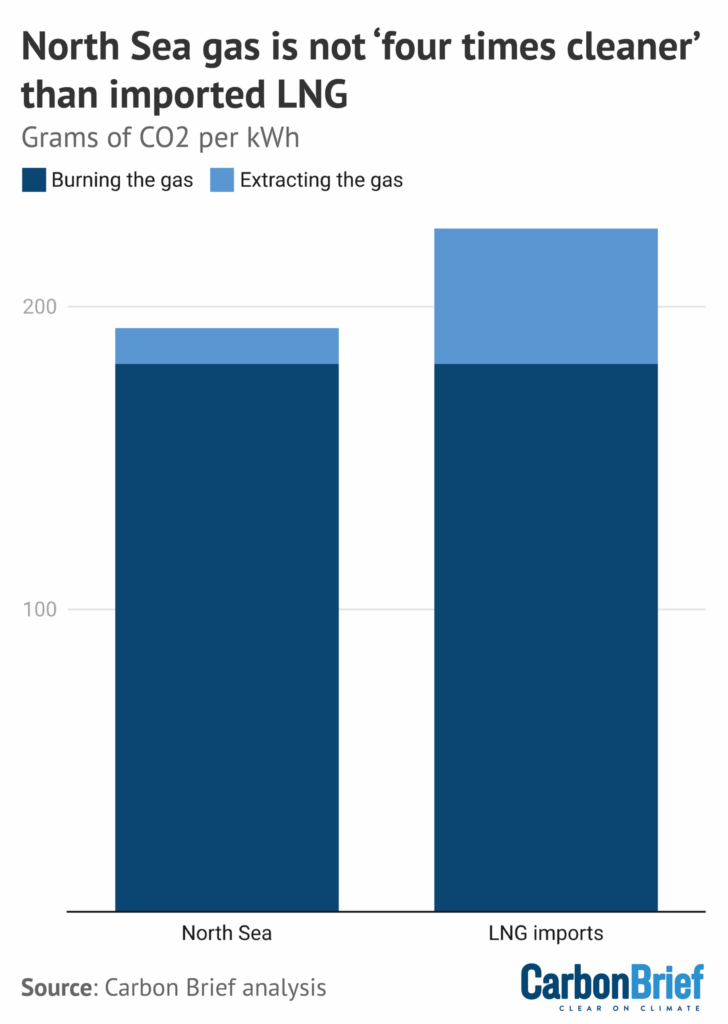
The claim that UK gas from the North Sea produces “a lot less CO2” – and particularly the commonly cited “four times fewer emissions” figure used by Coutinho – is misleading.
It references the fact that imported LNG has higher overall emissions than North Sea gas, due to the energy-intensive processes needed to liquify, transport and regasify it.
However, as the chart below shows, the vast majority of emissions from gas result from burning it to produce energy.
When CO2 from gas combustion is taken into account, LNG emissions are not four times lower than North Sea gas emissions, but 15% lower.
The UK is reliant on LNG imports from a handful of countries, notably the US and Qatar. However, at present these imports make up only around 15% of the UK’s gas.
Of the remaining gas used in the UK, roughly half is produced domestically and the rest comes via pipeline from Norway. Norwegian pipeline gas has even lower emissions than UK supplies.
More broadly, analysis by the Climate Change Committee in 2022 found that, despite the small “emissions advantage” of UK domestic production replacing imports, this could be wiped out if increased UK production led to more fossil-fuel production overall.
FALSE: ‘Britain is a resource-rich nation that has chosen dependency’
One frequent false claim is that the UK has “chosen” to become reliant on fossil-fuel imports, as a result of policy decisions made by successive governments.
In fact, import dependency has primarily increased because most of the oil and gas in the North Sea has already been used up. It is a “mature basin” with falling output.
In the Daily Telegraph for example, Diana Furchtgott-Roth, former climate director at the Heritage Foundation, a US-based climate-sceptic lobby group, stated that the UK has “chosen dependency”. She wrote:
“[The UK] is not a resource-poor nation forced to depend on foreign suppliers. It is a resource-rich nation that has chosen dependency through planning rules, regulatory obstruction and a net-zero framework that treats domestic oil and gas production as a moral failing rather than a strategic necessity.”
It is true that the UK has become increasingly reliant on fossil-fuel imports. The country was a net energy exporter in 2000, but, by 2010, was dependent on imports for 30% of its energy supplies. On the same metric, the UK’s net import dependency reached 44% in 2024.
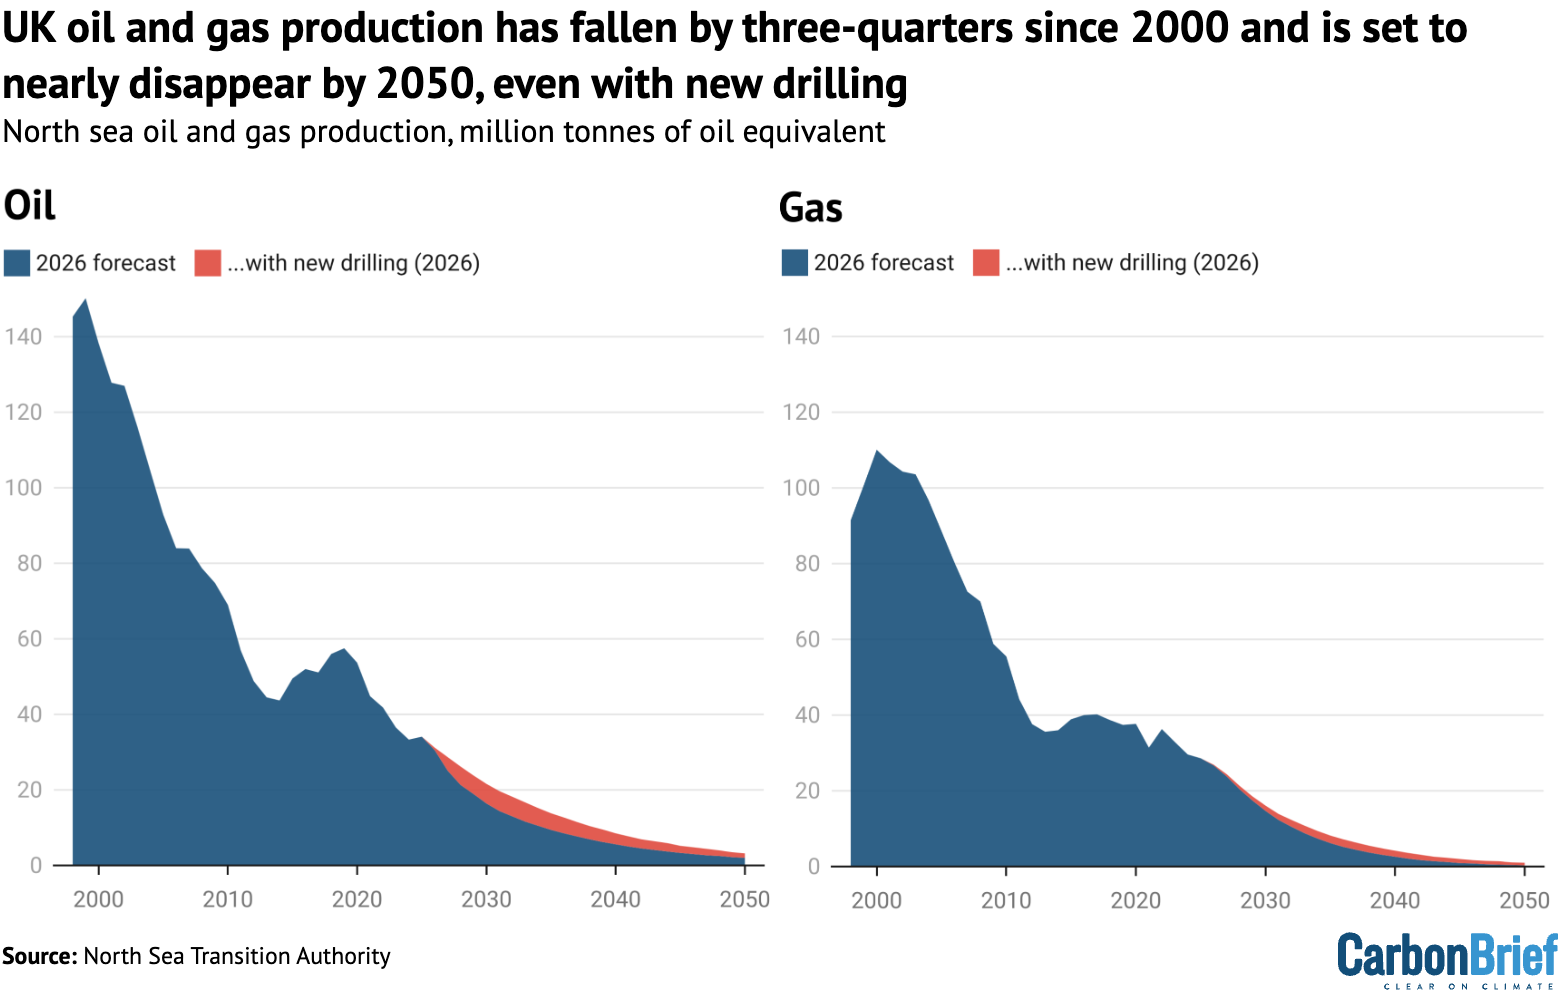
This is largely because UK fossil-fuel production peaked decades ago. Gas production in the North Sea fell by 74% between 2000 and 2025, while oil output fell by 75%.
Gas production is set to fall to 99% below 2025 levels by 2050 and oil is set to fall 94%, according to the government’s North Sea Transition Authority (NSTA). Even with further drilling, the NSTA expects gas output to fall by 97% and oil by 91%, as shown below.
Production has been in an inexorable decline for decades despite strongly supportive government policy through most of the period, including tax breaks and new licensing.
Contrary to the narrative that rising import dependency has been a policy choice, the main reason why production is falling is that the North Sea is a “mature basin”. In other words, most of the oil and gas it once contained has already been extracted and burned.
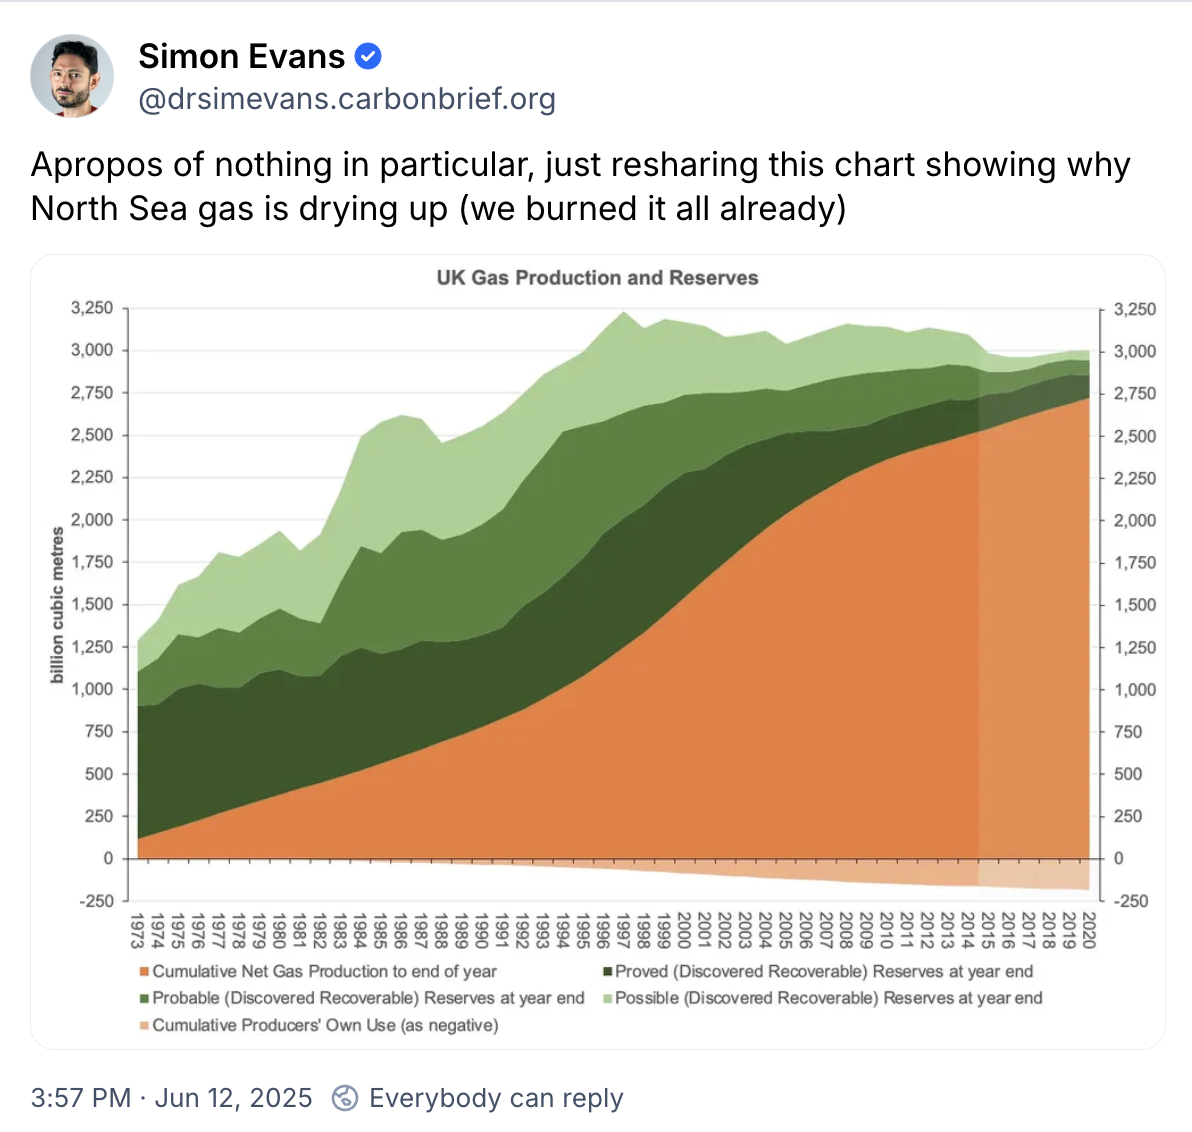
According to the thinktank Energy and Climate Intelligence Unit (ECIU), around 90% of the oil and gas that is likely to be produced from the North Sea has already been burned.
A related argument, aired on Sky News in mid-March 2026, is that the NSTA projections have been revised downwards over time, as a result of government policy. The idea is that there is more oil and gas available, but the government has “chosen” to ignore it.
Yet for gas, there is little difference between the NSTA projections published before and after the government’s 2024 election win and its decision to ban new licensing, as shown below.
While the NSTA projections for oil have shifted more noticeably between 2023 and 2026, this largely relates to output from existing fields, rather than the potential from new drilling.
There are a variety of other reasons why the NSTA projections have changed, notably including the economic viability of North Sea production.
Until the recent Iran war, UK oil prices had been declining steadily since the highs seen in the wake of Russia’s invasion of Ukraine in 2022.
This will have eroded the economics of North Sea production, particularly as the cost of extraction has gone up by roughly 40% since 2019.
A final claim relating to government policy choices is that the UK has, in the words of a recent Sun editorial, become “heavily dependent on imported energy because of unreliable wind and solar, and the government’s obsession with net-zero”.
This makes no sense – it is the opposite of the truth. Wind and solar generated more than 100 terawatt hours (TWh) of electricity in the UK last year, meeting a third of total demand.
Carbon Brief analysis shows that generating the same electricity from gas would have required around 200TWh of fuel, equivalent to three-quarters of UK imports of liquified natural gas (LNG).
In other words, without its fleet of what the Sun calls “unreliable wind and solar”, the UK would have needed to nearly double its LNG imports.
FALSE: North Sea is ‘best way to protect us from volatility and provide energy security’
The effective closure of the Strait of Hormuz has triggered the worst energy crisis since the 1970s and has reignited debate over how best to ensure the UK’s energy security.
Many politicians, newspaper editorials and comment articles have argued that getting more oil and gas out from under the North Sea would cut UK fossil-fuel imports and boost energy security.
Some have gone so far as to argue that the North Sea is the “best way” or “the” answer to ensuring UK energy security. This is clearly false. So too is the idea – promoted by the hard-right, climate-sceptic Reform party – that the UK could become “energy independent” by expanding North Sea production.
For example, Conservative leader Kemi Badenoch wrote a comment piece for the Sunday Telegraph under the headline: “Drilling the North Sea is the answer to the energy crisis.”
Meanwhile, Enrique Cornejo, energy policy director at North Sea industry trade association Offshore Energies UK (OEUK), told the Times:
“Current events demonstrate that the best way to protect us from volatility and provide energy security is to maximise our homegrown energy resources.”
The potential for extra oil and gas output is disputed, but not even the North Sea oil and gas industry claims that it could reverse the decades-long decline in production.
Analysis by the National Energy System Operator (NESO) shows that the transition to clean energy would boost UK energy security by significantly reducing fossil-fuel imports. In contrast, it says that imports would rise if the UK boosts domestic oil and gas production but fails to decarbonise.
The UK has been increasingly reliant on energy imports since 2003. This is because UK oil and gas production from the North Sea has fallen by roughly three-quarters since 2000. (See: FALSE: “Britain is a resource-rich nation that has chosen dependency.”)
The UK’s reliance on fossil-fuel imports is set to increase even further, as North Sea production continues to decline. The NSTA says oil output will fall to 94% below 2025 levels by 2050 – or 91% with new drilling. For gas, the figures are 99% and 97%, respectively.
OEUK and other advocates for the oil and gas sector dispute these figures, claiming that higher production would be possible if there are changes in government policy.
For example, a report commissioned by OEUK put forward a “high case” for North Sea production over the coming decades, predicated on what it calls “significant changes to tax, licensing and regulatory approvals”. Notably, this still showed steep declines in output.

The OEUK-commissioned report also looked at an even more optimistic “no constraints” case for higher North Sea. However, the report authors, consultancy Westwood Energy, described this as “beyond realistic assumptions”. It said:
“The ‘no constraints’ case is considered to be beyond realistic assumptions given the current regulatory and fiscal conditions and investor sentiment. For this case to be realised, major industry change would be required.”
Similarly, OEUK has published a scenario for North Sea gas production that it calls “upside potential”, in which output is held close to current levels for the next decade.
It has used these scenarios to argue that the decline in North Sea gas output is “not inevitable”. However, the details behind these claims are opaque.
The “upside potential” scenario is based on what OEUK describes as “data provided by OEUK members” and it assumes that the government immediately scraps the “energy profits levy” (EPL, known as the windfall tax, see below).
OEUK claims that this scenario is “not speculative” and that it “clearly demonstrate[s] that the decline in potential supply indicated by NSTA forecasts is the result of policy choices”.
On this point, it is worth reiterating that the NSTA forecasts for gas barely changed in response to the election of the current government in 2024, as illustrated above.
Ultimately, while it is clear that most of the oil and gas that was once under the North Sea has already been burned, significant resources do remain.
The key question is how much of this remaining oil and gas is both technically and economically recoverable under current policies and prices – and if policies were changed.
OEIS’s Jack Sharples tells Carbon Brief that the North Sea is a “very mature basin” and that “nobody’s talking about increased production versus current levels”. He continues:
“Even if licences were to be made available for further exploration and production, that would result in a little bit of extra supply over the next 12 months, let’s say, but obviously not a huge amount…We’re just talking about slowing down the rate of decline.”
Sharples adds that, nevertheless, he thinks it is “worth maximising whatever we can produce in the North Sea”.
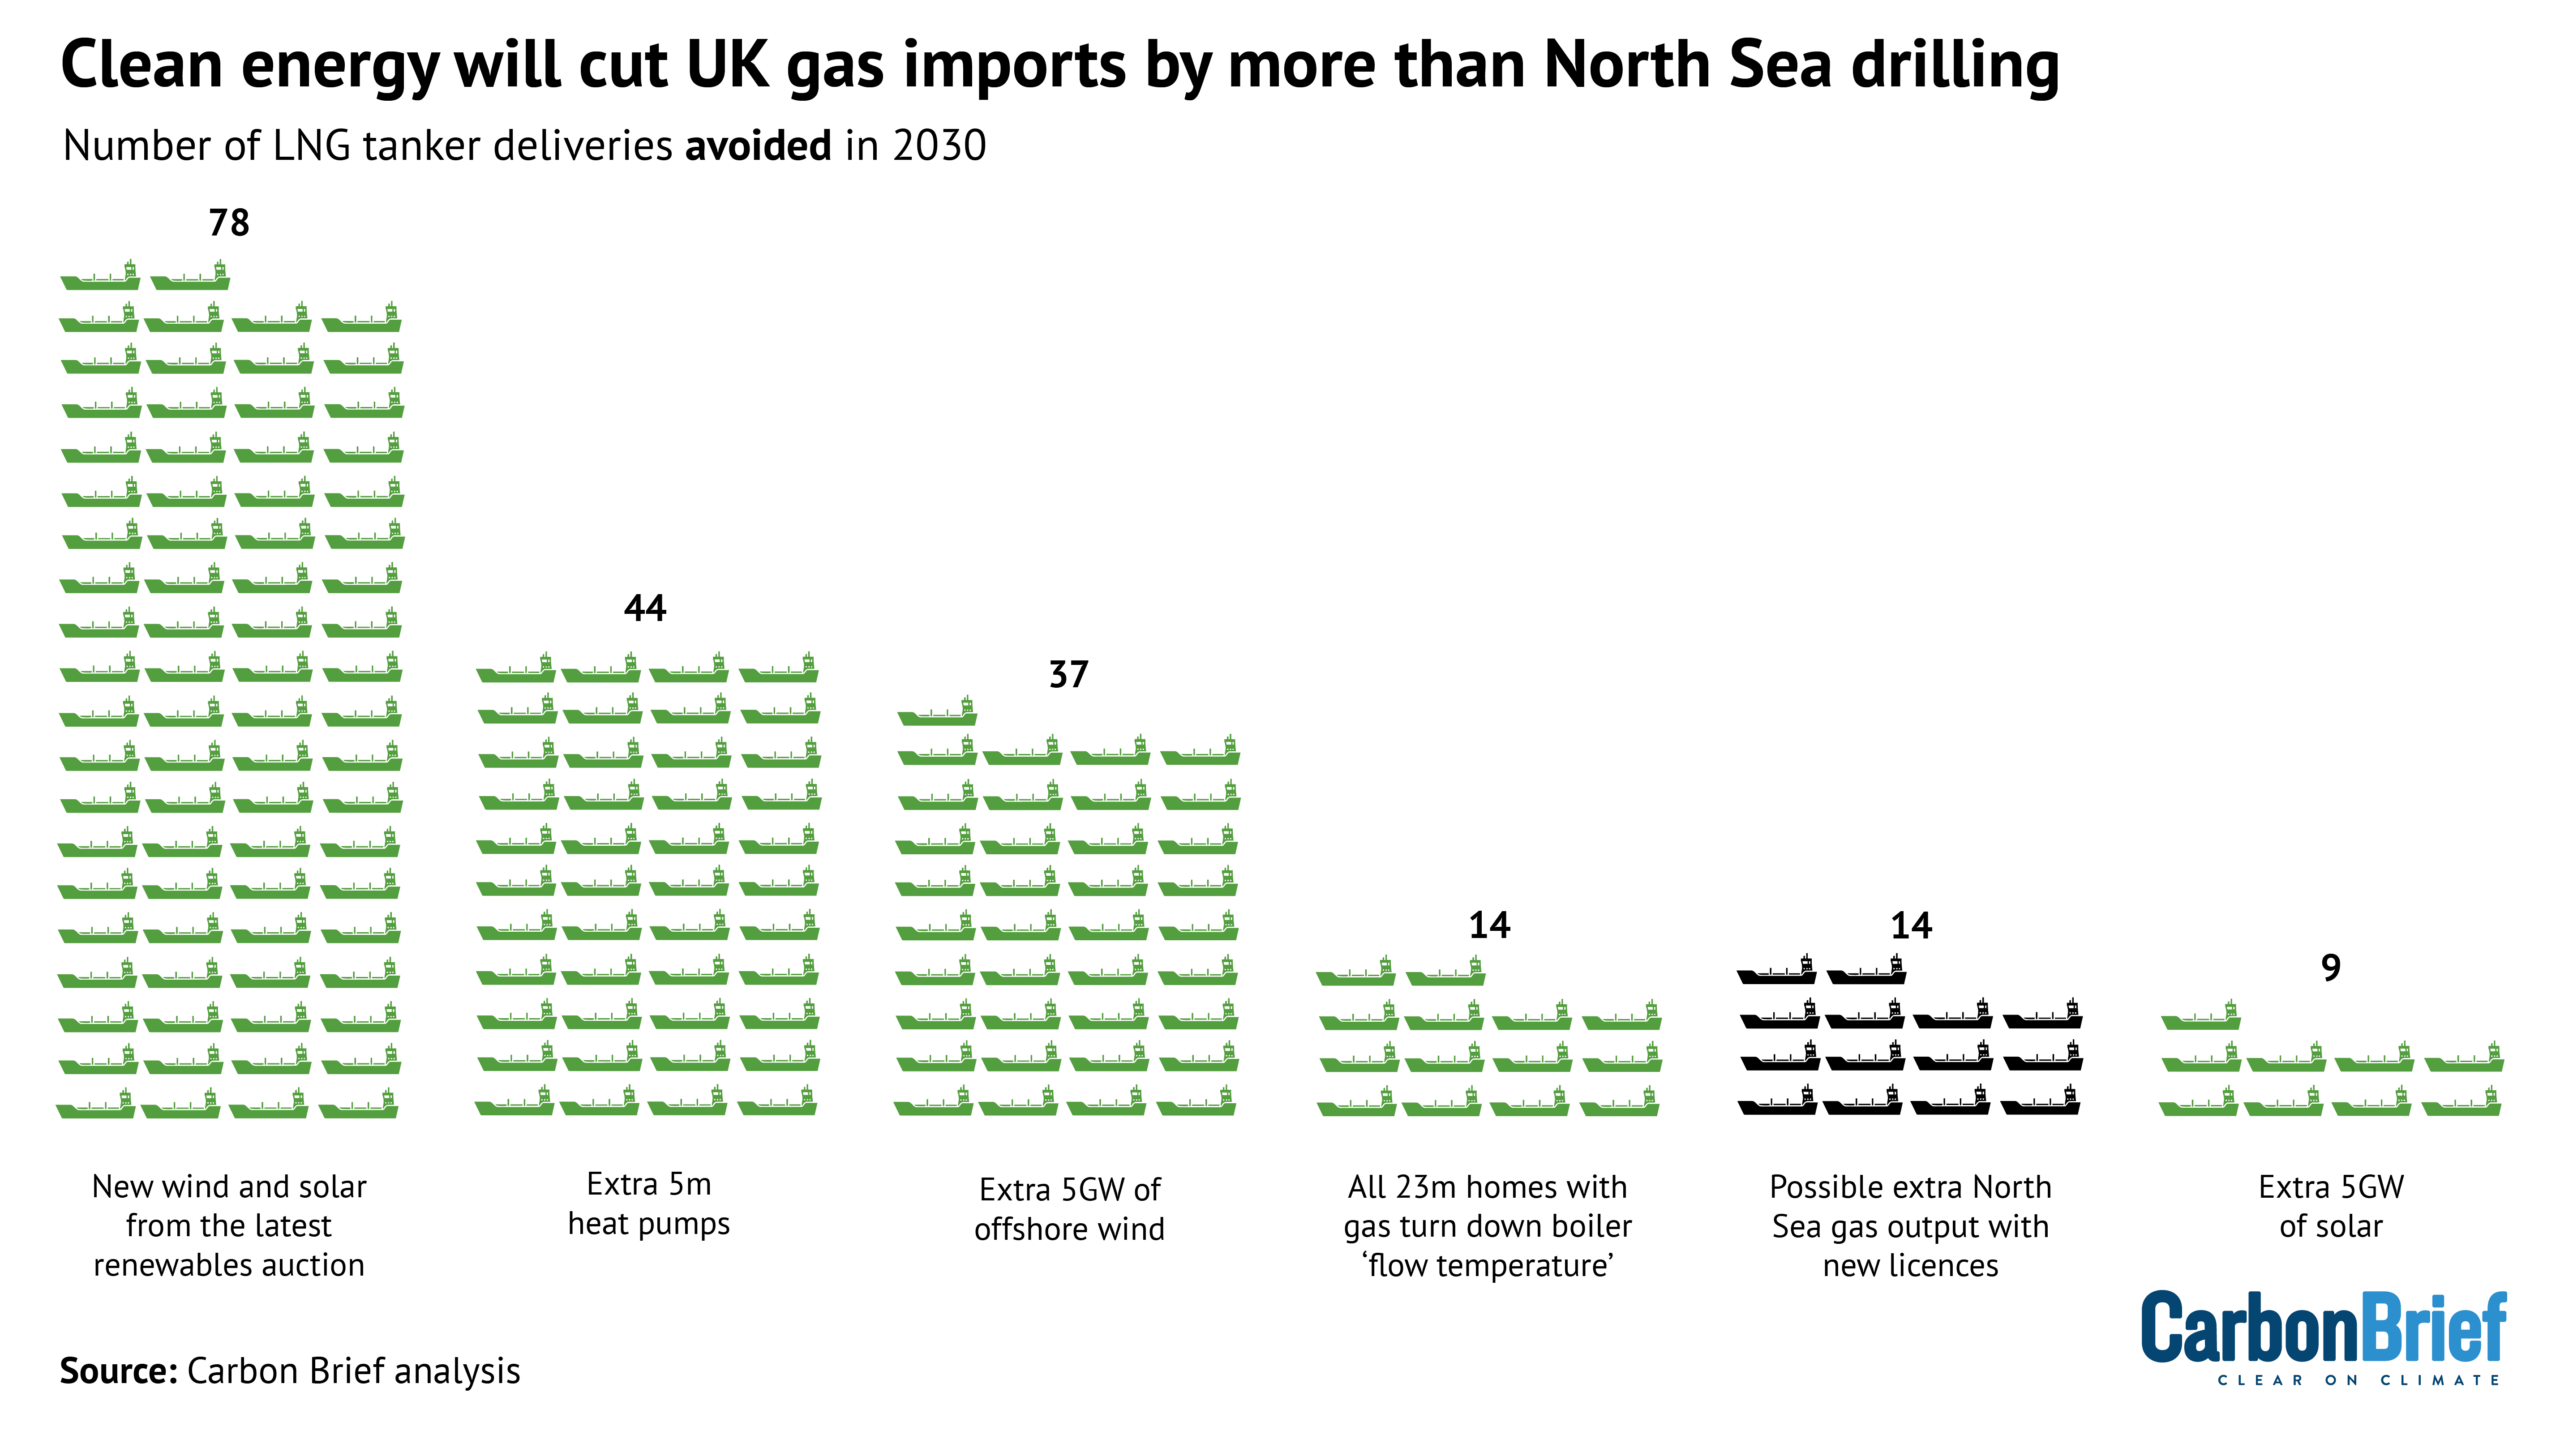
Recent Carbon Brief analysis found that expanding clean-energy supplies would have a larger impact on UK gas imports than an increase in North Sea drilling, as shown below.
(This analysis was based on NSTA projections of possible extra North Sea gas output, which amounted to 16TWh in 2030. If the OEUK “upside potential” scenario could be realised, the extra gas would amount to further 108TWh, equivalent to around 90 LNG tankers.)
An additional aspect to this relates to timescales. It takes an estimated 28 years for new licenses to result in new oil and gas production, according to official figures.
The industry says fields that already have licenses, such as Rosebank and Jackdaw, could be developed more quickly, if they receive planning consent. The previous Conservative government had consented to these fields being developed, but this was overturned in the courts. The Labour government is in the process of considering whether to approve them.
(The new wind and solar projects from the latest renewable auction, which concluded in February 2026, are set to be operating by or around 2030.)
In a March 2026 note, the UK Energy Research Centre (UKERC) said that drilling for oil and gas “will not reduce bills or deliver energy security”. Instead, it said that “demand reduction should be a core focus of UK gas security”.
In the longer term, the National Energy System Operator (NESO) says that meeting the UK’s net-zero target would cut the country’s dependency on imported gas to 78% below current levels, whereas failing to decarbonise would see imports rising by a third as production falls.
At a recent parliamentary hearing, Miliband told MPs that this illustrated why “decarbonisation is essential for energy security”. He added that turning away from net-zero would leave the UK “really, really exposed”.
Octopus boss Greg Jackson said in a recent government press release: “Every solar panel, heat pump and battery cuts bills and boosts Britain’s energy independence.”
MISLEADING: ‘The head honchos of the green lobby say we should drill’
Numerous media outlets have picked up on supportive comments from what the Daily Telegraph has called “net zero’s champions”, backing the use of North Sea oil and gas.
Writing in the Daily Telegraph, shadow energy secretary Claire Coutinho said:
“From the wind lobbyists at RenewableUK to the chair of Great British Energy (Miliband’s ‘clean energy’ propaganda outfit), the head honchos of the green lobby say we should drill.”
This point was similarly made in an editorial in the Sun, which stated that “Octopus energy chief Greg Jackson…and even the head of RenewableUK have called for North Sea reserves to be reopened urgently”.
These comments were in reference to a handful of specific interventions that, in reality, were far more nuanced than simply calling for more drilling. Indeed, some of the so-called “net-zero champions” have clarified that they are not calling for new licenses at all.
In the Daily Telegraph, Tara Singh, chief executive of RenewableUK, wrote that “it is entirely sensible to support continued domestic oil and gas production in the North Sea”.
Similarly, Jackson wrote in the Daily Telegraph that “we should use what’s available from the North Sea”.
The Daily Telegraph published news stories to accompany both of these articles with the headlines “wind industry chief urges Miliband to restart North Sea drilling” and “Miliband must reopen the North Sea, Octopus boss says”.
On LinkedIn, Juergen Maier, chair of the government’s publicly owned, clean-energy company Great British Energy, set out several arguments in favour of more North Sea production.
These included slowing job losses in the region, the lower carbon intensity of North Sea oil and gas compared with imports and extra production supporting tax revenues.
His comments were picked up by the Financial Times and the Daily Telegraph, with the latter saying the comments from “Miliband’s clean-energy tsar” will “raise eyebrows”.
However, neither Singh, Jackson nor Maier called for new oil and gas licences – and they stressed that North Sea oil and gas will not bring down energy bills.
In fact, their position is similar to that of the UK government, which sees domestic fossil fuels playing an “important and valuable role” into the future.
Singh wrote: “Being serious about the UK’s important role in gas also means being honest about its limitations. The North Sea is a mature basin, not a limitless national asset.”
She added that politicians should not imply that more domestic drilling would bring down energy bills, as “it will not”. Instead, she wrote that new renewable generation offers “better value” for consumers, both when gas prices are normal and at “crisis levels”. (See: FALSE: “Reopening the North Sea would lower bills.”)
Expanding on her piece on Twitter, Singh clarified “we don’t represent the [oil and gas] sector and we’re not arguing for or against new licences”, adding:
“Before anyone gets too excited: I’m calling for a depoliticised conversation about energy in the UK – not an overhaul of policy to favour oil and gas.”
In his comment for the Daily Telegraph, Jackson added:
“We’re kidding ourselves if we think this is a panacea – it’s 20 years since the North Sea could meet all our needs – we’ve depleted the most abundant reserves and the remainder will be less productive and more expensive. But it makes sense to use what we have whilst we’re so dependent on gas.”
His article, titled “My plan to safeguard Britain’s energy supplies”, only briefly mentioned the North Sea and stressed the importance of “reduc[ing] our dependency on gas”.
He continued to set out other potential steps for increasing energy security and bringing down bills, including building nuclear efficiently, cutting energy waste, reforming the electricity market, rolling out domestic renewable generation and breaking the link between gas and electricity that “lets global chaos dictate our prices”.
In a follow-up interview with Jackson in the Independent, which emphasised these alternatives, he added that the UK was “deluding” itself if it thinks it can “get enough out of the North Sea and in a market where the price is set internationally”.
For his part, Maier clarified on LinkedIn that he was a supporter of a “ managed energy transition” making use of all available energy sources, but adding that this includes “the end game being mostly renewable energy generation”.
He also explicitly rejected the notion that more North Sea oil and gas would bring down bills, noting: “It doesn’t; indeed, energy costs are rising at this very moment because of fossil fuels.” Again, this mirrors the view expressed by government ministers.
Maier also subsequently pushed back against the media coverage of his original comments, writing in a follow-up post on LinkedIn that the claim he was pressuring Miliband over North Sea drilling was “wrong” and that he is “fully supportive of the government position”. He added:
“I see this as consistent with an ‘all energy’ approach to the transition. That the end game is renewables and that we need to give supply chain companies enough time to transition. I have said this numerous times in many speeches and posts here.”
FALSE: ‘The UK is the only country in the world banning new oil and gas licenses’
On LinkedIn, Conservative politician and shadow energy secretary Claire Coutinho claimed that the “UK is the only country in the world banning new oil and gas licenses”.
Her comment was made in response to a post about Denmark, which, in 2020, made a landmark decision to stop issuing new oil and gas licences and end all fossil-fuel extraction by 2050.
The post noted that Denmark is now considering “extending one or more production licenses” in the Danish North Sea, in response to the energy crisis.
However, as Coutinho surely knows, this is not the same as issuing new licences – and is more comparable to Labour’s move to allow some additional “tieback” drilling at existing fields, announced in 2025.
Denmark and the UK are not the only countries to end new oil and gas licences. Other nations to do so include Ireland, France, Portugal and Colombia.
In fact, there is an international coalition of nations that have pledged to end new oil and gas production, known as the Beyond Oil and Gas Alliance (BOGA).
This group is helping to convene the first meeting of nations that want to take immediate action to phase out fossil fuels, which is taking place in Santa Marta, Colombia, in April. Around 40-80 nations are expected to attend.
Carbon Brief understands that the UK will have a senior representative at the conference.
Despite showing its support for BOGA, the UK is currently not a member. A senior official once told Carbon Brief that this is because the UK does not currently meet the required end date for stopping all fossil-fuel production.
MISLEADING: ‘With new North Sea licences would come thousands of jobs’
Addressing parliament in March, Nigel Farage, the leader of the hard-right, climate-sceptic Reform UK party, claimed that with new North Sea oil and gas licences “would come thousands of jobs”, according to the Herald.
As noted above, the issuing of new exploration licences would only make a small difference to future production in a basin that is in irreversible decline.
Official statistics show the decline of the basin caused direct jobs in oil and gas production to fall by a third between 2014 and 2023. Indeed, according to the government, more than 70,000 jobs have been lost in the last decade alone.
This decline has occurred despite the previous Conservative government, which was in power from 2010-24, holding six new licensing rounds and issuing hundreds of new licences.
The Norwegian oil-and-gas company Equinor has claimed that, if approved, its large oil project, Rosebank, could create up to 1,600 jobs while at the height of its construction phase. (Rosebank has a licence, but has not yet obtained final consent from the government.)
However, analysis by the North Sea non-profit Uplift says that this figure is “inflated” and that the project would only create 255 jobs over its lifetime.
As part of its “North Sea future plan” announced in 2025, the current Labour government has pledged to establish the “North Sea jobs service” – a national employment programme offering support for oil and gas workers seeking new opportunities in clean energy, defence and advanced manufacturing.
However, campaigners have warned that the plan does not go far enough.
In 2023, the UK’s Climate Change Committee (CCC) published an analysis of how jobs might change as the country strives for its legally binding net-zero target.
Its review of available data suggested that the gradual phase-down of high-emitting sectors, such as oil and gas production, could lead to there being 8,000-75,000 workers “whose jobs cannot continue in their current form”. (It notes that the wide range is due to “much uncertainty in these estimates”.)
But it added that this would be outweighed by “extensive job creation”. It estimated that there could be between 135,000-725,000 new jobs created by the transition to net-zero, in sectors such as renewable energy generation, retrofitting and electric vehicles.
This job creation is not “guaranteed” and is dependent on the government implementing measures to support and upskill its workforce on the journey to net-zero, the CCC noted.
A report published this week by the Renewable Energy Association, the UK’s largest renewables trade body, found that jobs in renewable energy in the UK now outstrip those in oil and gas.
According to the figures, there were 145,000 jobs in the renewable energy sector in 2025, compared with 115,000 in oil and gas.
MISLEADING: North Sea drilling ‘would secure a rush of revenue into the Treasury’
One common argument in favour of more North Sea drilling is that the sector provides an important source of tax revenue for the government.
An editorial in the climate-sceptic Daily Telegraph claimed that “tapping” new North Sea oil and gas “would not resolve the problem of high energy prices”, but would “secure a rush of revenue into the Treasury and provide households and businesses struggling under current circumstances with a helping hand”.
The tax revenue argument is often made by North Sea proponents who try to position themselves as being even-handed and moderate, as illustrated in recent columns in the Guardian and Observer.
However, the idea that new projects would usher in significant revenue is highly misleading.
The Office of Budget Responsibility (OBR), the UK’s independent fiscal watchdog, in March forecast that total UK oil and gas venues are expected to fall from £6bn in 2024-25 to just £0.1bn by 2030-31. (This is at baseline prices that do not consider the current energy crisis.)
Part of this decline comes from the expected end of the windfall tax, a levy first introduced by the Conservative government in 2022 in response to soaring oil-and-gas company profits fuelled by the end of Covid restrictions and Russia’s invasion of Ukraine.
(Many proponents of North Sea oil and gas have repeatedly called for an end to the windfall tax, while also frequently talking up the tax benefits from oil-and-gas production.)
However, the downgraded OBR forecast also reflects the decline of production in the basin as resources dry up, a shrinking tax base and falling prices, says Daniel Jones, head of research, policy and legal at the campaign group Uplift. He tells Carbon Brief:
“Even the windfall receipts generated during a genuine price crisis are temporary and price-dependent. At normal prices, the basin contributes very little. The structural decline continues regardless of the spike.”
As old oil and gas assets reach the end of their lives, the companies behind them are able to access significant tax relief for decommissioning costs, “further reducing the net contribution to the public finances”, says Jones.
(In some years, this tax relief has meant that far from being a source of revenue, certain oil and gas companies have been paid money by the exchequer.)
In addition, new developments “tend to be smaller and more expensive than the fields they replace”, Jones says, leading to the government offering large tax deductions for exploration, drilling and construction costs from 2014 onwards. He continues:
“These deductions can wipe out any taxable profit for years, meaning the Treasury collects nothing until investment costs have been fully offset. By the time a new field generates net tax receipts, it may be well into its production life – if prices and production hold up long enough to get there at all.”
An analysis by Uplift and NGO WWF Norway in 2025 found that the Rosebank oil field currently seeking development consent from the government could, in a “base-case scenario”, lead to £258m in net losses for the UK, due to the reasons set out above.
FALSE: Ed Miliband is an ‘anti-North Sea’ climate change ‘fanatic’
A huge amount of the criticism of the UK government’s position on North Sea oil and gas has been personally levelled at one man: Ed Miliband.
The energy secretary has been repeatedly labelled by opposition politicians and their media allies as “dangerous” and a “fanatic” with a “cult-like conviction”, because of his reported opposition to more drilling in the North Sea.
Miliband’s Conservative counterpart, Claire Coutinho, wrote in the Daily Telegraph:
“As the world gets more dangerous, [Miliband’s] anti-North Sea fanaticism is making Britain weaker and poorer.”
As with much of the criticism aimed at Miliband in right-leaning media, these attacks are often highly personal. The Sun’s US editor-at-large, Harry Cole, referred to Miliband as a “Greta [Thunberg]-loving Marxist, who has never seen a market he doesn’t want to destroy”.
In fact, Miliband is simply the energy minister in a government that has explicitly prioritised climate policies and transitioning away from fossil fuels.
Labour’s 2024 manifesto for the general election in which the party won an overwhelming victory and, hence, mandate stated:
“We will not issue new licences to explore new [North Sea] fields because they will not take a penny off bills, cannot make us energy secure and will only accelerate the worsening climate crisis.”
While the government has repeatedly ruled out new licences, it is considering approving several new projects at sites that have already received licences, but not consent to begin development.
It has also announced new “transitional energy certificates”, which will allow new oil and gas production at or near existing sites.
As for Miliband, his views are far more moderate than the “fanatical” ones portrayed by his detractors.
The energy secretary has been clear that he expects the UK to continue producing oil and gas even as it transitions to net-zero, writing in a recent Observer article:
“As we build our clean-energy future, North Sea production continues to play an important and valuable role, which is why we are keeping existing oil and gasfields open for their lifetime.”
Arguing against more expansion, Miliband noted that the North Sea is a “maturing basin” and that “new exploration licences are simply too marginal to have a meaningful impact on levels of oil and gas production”.

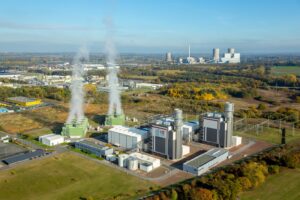
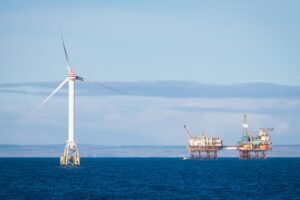
The post Factcheck: Nine false or misleading myths about North Sea oil and gas appeared first on Carbon Brief.
Factcheck: Nine false or misleading myths about North Sea oil and gas


-
Climate Change8 months ago
Guest post: Why China is still building new coal – and when it might stop
-
Greenhouse Gases8 months ago
Guest post: Why China is still building new coal – and when it might stop
-

 Greenhouse Gases2 years ago
嘉宾来稿:满足中国增长的用电需求 光伏加储能“比新建煤电更实惠”
-
Climate Change2 years ago
Bill Discounting Climate Change in Florida’s Energy Policy Awaits DeSantis’ Approval
-

 Climate Change2 years ago
嘉宾来稿:满足中国增长的用电需求 光伏加储能“比新建煤电更实惠”
-
Climate Change Videos2 years ago
The toxic gas flares fuelling Nigeria’s climate change – BBC News
-

 Carbon Footprint2 years ago
US SEC’s Climate Disclosure Rules Spur Renewed Interest in Carbon Credits
-

 Renewable Energy5 months ago
Sending Progressive Philanthropist George Soros to Prison?