

Danish carbon credit company, Agreena’s “AgreenaCarbon Project” reached a major milestone by becoming the first large-scale arable farming initiative verified under Verra’s Verified Carbon Standard (VCS) VM0042 Improved Agricultural Land Management v2.0 methodology.
This achievement advances carbon markets by providing verified, traceable, and compliance-ready credits supported by measurable, field-level data. By issuing 2.3 million Verified Carbon Units (VCUs), the project enables farmers and corporates to drive real climate action and align with global sustainability goals.
Mandy Rambharos, the Chief Executive Officer of Verra, commented:
“The AgreenaCarbon Project is extremely important because it demonstrates how soil carbon projects can scale. It spans vast areas of land across multiple countries in Europe – from Ukraine to Spain – showing the breadth and reach of its impact. By implementing VM0042 and ensuring the right protocols, we can guarantee the quality and integrity of the carbon credits generated. This gives us confidence that these projects truly have the ability to scale.”
AgreenaCarbon: Setting a New Benchmark for Agriculture-Based Carbon Credits
The press release highlights that the AgreenaCarbon Project operates across 1.6 million hectares of regenerative farmland spanning countries including the UK, Denmark, Ukraine, Moldova, Romania, Lithuania, Latvia, Estonia, Bulgaria, and Spain. Its success in securing VCS verification underscores the credibility and integrity of its carbon credits.
Unlike conventional farming initiatives that primarily focus on yield, Agreena’s approach emphasizes soil health, biodiversity restoration, and measurable greenhouse gas reductions.
Through its holistic solution, Agreena finances farmers’ transition toward regenerative practices, rigorously verifies their impact using AI-driven digital measurement, reporting, and verification (dMRV), and offers corporates access to high-quality nature-based carbon offsets.
The verification process, following its validation earlier in 2025, confirms that the project has delivered verifiable carbon benefits from historic practices implemented in 2021, 2022, and 2023.
Simon Haldrup, CEO and co-founder of Agreena, added:
“The verification of the AgreenaCarbon Project reaffirms Agreena as a leader in regenerative agriculture, proving that soil carbon sequestration can be measured, verified, and trusted at scale. This milestone empowers farmers – the true climate heroes – to adopt new practices through verified carbon credits, while giving corporate buyers the confidence to invest in meaningful climate action. Agreena is proud to be building the world’s largest verified supply of soil carbon credits, bringing the first large-scale wave of high-quality credits to market.”
Delivering Climate Solutions with Proven Impact
Agreena’s regenerative practices have already contributed to achieving the following carbon reduction milestones:
-
Nearly 1.2 million tonnes of CO₂ have been cut through improved farming methods, equivalent to removing 261,000 cars from the roads for an entire year.
-
Over 1.1 million tonnes of CO₂ have been captured and stored in soils, matching the yearly carbon footprint of 90,000 individuals.
These results are independently verified by accredited third-party agencies, ensuring that every credit issued reflects real, field-based impact.
Farmers are the backbone of this effort. Oleksandr Mustipan, a farmer involved with Agreena, described the project as transformative: “Working with Agreena has truly been a game-changer. It enabled us to scale up regenerative practices faster and more effectively than I ever could alone. The verification process validates our contribution and motivates us to continue making a difference.”
For corporates, these credits offer a trusted mechanism to meet ESG targets while supporting agricultural ecosystems. Leading firms such as Radisson Hotel Group have already pre-ordered a substantial share of the credits, underscoring market confidence in Agreena’s offering.
Growing Carbon Credits with Regenerative Agriculture
Agriculture is responsible for 22% of global anthropogenic emissions, making soil management a critical pillar in climate mitigation strategies. Conventional farming practices, reliant on chemical inputs and intensive tillage, have degraded soil health and diminished its carbon-storing potential.
In contrast, regenerative practices focus on rebuilding organic matter, enhancing biodiversity, and fostering long-term resilience.
Key practices employed across Agreena’s projects include:
- Cover cropping helps lock carbon into the soil while improving nutrient cycling.
- Crop rotations promote soil structure and reduce disease pressure.
- Residue management, minimizing soil disturbance, and protecting microbial life.
- Reduced or no-tillage techniques, lowering emissions, and preserving soil integrity.
These interventions not only generate carbon removal credits by storing atmospheric CO₂ in the soil but also contribute avoidance credits by reducing emissions from fertilizer use or energy consumption. The combined effect of such practices offers a diversified credit profile that meets varying market needs.
How Regenerative Practices Are Redefining Agriculture
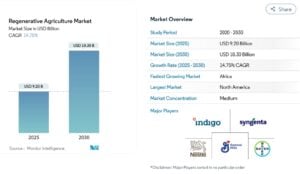
According to Mordor Intelligence, the regenerative agriculture market is poised for rapid expansion. With an estimated market size of USD 9.2 billion in 2025, projections indicate growth to USD 18.3 billion by 2030, reflecting a 14.75% CAGR.
The report further explains several factors that are driving this momentum:
Corporate Commitments
Major food and beverage companies are investing heavily in regenerative sourcing. Nestlé pledged CHF 1.2 billion to source half its priority materials from regenerative farms by 2030, while PepsiCo is funding USD 216 million to transition 7 million acres. These initiatives are expanding through supply chains, offering growers premium contracts and stable revenue.
Government Incentives
Policies are increasingly supporting regenerative practices. The USDA’s USD 3.1 billion program rewards verified soil improvements, and 25% of Europe’s CAP payments now target eco-friendly schemes. Denmark’s mix of taxes and subsidies further encourages sustainable farming.
Consumer Preferences
Growing demand for climate-friendly products is pushing brands to highlight regenerative practices. 63% of food companies now include regenerative agriculture in their sustainability plans, creating new market opportunities for growers.
Financial Risk and Opportunity
Banks and investors are factoring soil-carbon gains into lending strategies. Verified projects help reduce financing risks, leading to lower interest rates and easier access to capital for sustainable farming initiatives.
Driving Trusted, Scalable Climate Action with Verra
The AgreenaCarbon Project’s verification by Verra marks a pivotal moment in agriculture-based carbon markets. It confirms not only the methodology but also the soil’s wider potential as a climate solution.
By combining financial support, scientific rigor, and farmer-focused practices, it is driving regenerative agriculture into the mainstream and creating new revenue streams through nature’s restoration.
Tech-Enabled Growth for Regenerative Agriculture
Furthermore, the company uses cutting-edge technology to unlock scalable solutions in regenerative agriculture. By leveraging satellite imagery, machine learning, and sensor networks, its dMRV system verifies every credit with accurate, field-level data. This approach prevents fraud, boosts transparency, and helps farmers adopt practices faster by easing technical challenges.
Agreena also integrates with tokenized carbon marketplaces and digital platforms to lower transaction costs, making it easier for smallholders and large enterprises to participate. As verification processes streamline, confidence in regenerative carbon credits continues to rise.
As corporations pursue reliable carbon offsets and consumers demand climate-resilient food, the regenerative agriculture market is poised for dramatic growth. Verified, scalable, and supported by field-level data, Agreena’s carbon credits lead the next wave of climate action—benefiting farmers, businesses, and the planet alike.
The post Scaling Sustainable Farming: AgreenaCarbon’s 2.3 Million Verified Carbon Credits Redefine Regenerative Agriculture appeared first on Carbon Credits.
For most businesses, the emissions that matter most sit outside their own walls. Scope 3 emissions, everything generated across your value chain, from the suppliers who make your inputs to the customers who use your products, typically make up the majority of a company’s total carbon footprint. Under the Corporate Sustainability Reporting Directive (CSRD), those value-chain emissions now have to be measured and disclosed with a rigour that spend-based estimates alone struggle to satisfy. This guide sets out how to improve Scope 3 data accuracy for CSRD: the calculation methods open to you, how to move from estimates to verified supplier data, and how to govern that data so it holds up to audit.
![]()
A carbon credit is a commitment that extends well into the future. The tonne of CO₂ compensated for today from a nature-based carbon project must remain out of the atmosphere for good, which means the forest behind the credit has to remain standing long after the transaction is complete. For any buyer, this raises a defining question: What ensures that the forest endures?
![]()
What replaced the cheap REDD credit on the boardroom slide deck, and why procurement is leading the rewrite.
Three years ago, a corporate slide showing a portfolio of cheap REDD+ credits could carry a board meeting. The number was big, the price was low, and the press release wrote itself. Today, that same slide gets sent back with questions. The questions are uncomfortable, the answers are unclear, and your general counsel is suddenly in the room.
Conventional carbon offsets are not dead. The voluntary carbon market retired 202 million tonnes in 2025, and the Morgan Stanley Institute for Sustainable Investing survey published in January 2026 confirmed that interest from corporate buyers remains substantial. What changed is the credibility threshold. The integrity floor has risen, the disclosure scrutiny has tightened, and the buyer profile has shifted. This article tracks what changed, what sophisticated buyers now ask before signing, and what serious corporates are putting on the board slide instead.
What boards used to buy, and why it stopped working
The 2020 to 2022 model was simple: buy a large tranche of avoidance credits at low single-digit prices, retire them against the company footprint, announce the carbon-neutral claim, and move on. Most of those credits came from REDD+ projects, renewable energy installations in countries where the renewable energy was already economic, or methane projects with thin documentation.
Several things broke that model. Academic research published in 2023, including a widely cited Science paper, found that the majority of REDD+ credits issued under the most common methodologies did not represent additional reductions when tested against rigorous counterfactuals. The Voluntary Carbon Markets Integrity Initiative published its Claims Code of Practice, which sets requirements for what companies can credibly claim from credit use. The European Union finalised its Green Claims Directive, restricting how companies can describe products as climate-neutral. France’s Décret 2022-539 already restricts carbon neutrality advertising. California’s AB 1305 imposes disclosure requirements on any company making net-zero or carbon-neutral claims while doing business in the state.
The collective effect: the cheap credit no longer buys the announcement, and the announcement now carries litigation risk.
The integrity reset: ICVCM, VCMI, and what changed
The Integrity Council for the Voluntary Carbon Market published the Core Carbon Principles in 2023 and began assessing methodologies against them in 2024. The first methodologies received the CCP label later that year. The point of the label is to give corporate buyers a defensible quality screen they can cite in disclosure.
The Voluntary Carbon Markets Integrity Initiative complements this on the demand side. Its Claims Code of Practice defines what a buyer can say (Silver, Gold, or Platinum claims, with associated requirements) based on the quality of credits used and the underlying decarbonisation strategy. Together, CCP and VCMI build a quality stack: CCP on the supply, VCMI on the claim, with the science-based target sitting underneath both.
The reset is not a ban on offsets. It is a ratchet. Credits that meet the new bar continue to clear; credits that do not, do not. The Morgan Stanley survey found that 61% of current buyers like the CCP label concept but that supply of labelled credits remains limited. That supply constraint is now visible in pricing.
What sophisticated buyers ask before they sign
The questions on the procurement scorecard have changed. A 2022 buyer might have asked about price, vintage, and project type. A 2026 buyer asks five different questions before any of those.
- What does the counterfactual look like, and who validated it.
- What is the permanence regime, and what is the buffer pool exposure.
- What is the leakage risk, and how is it mitigated.
- What rating has the project received from the independent ratings agencies (Sylvera, BeZero, Calyx Global), and what was the rationale.
- What is the documentation discipline that survives an audit four years from now when the procurement team that signed the contract has moved on.
If the vendor cannot answer those five questions on a first call, the conversation ends. Conversely, if the vendor can answer them with documented specificity, the conversation often expands beyond a single transaction toward a multi-year engagement.
Where this leaves your near-term commitments
You probably have near-term commitments that pre-date the integrity reset. Public targets to be carbon neutral by 2025 or 2030. Product-level claims that ran in last year’s marketing. Disclosed reduction trajectories that assumed continued access to cheap credits.
You have three workable paths. The first is to re-baseline your strategy, replacing the most exposed credits with higher-quality alternatives and adjusting the public language to match what you can defend. The second is to shift the underlying spend from offsetting outside your value chain to investing inside your value chain, where reductions count against Scope 3 directly and the audit trail is cleaner. The third is to keep the strategy and absorb the risk, which is increasingly the most expensive option once you price in litigation, restatement, and reputational exposure.
Most serious buyers are choosing the second path. It moves the carbon spend from a compliance cost to a procurement and resilience investment, and it removes the central failure point of the legacy model: the disconnect between where the emissions occurred and where the reductions sat. Nature-based supply chain investments, structured under the GHG Protocol Land Sector and Removals Standard and aligned to the SBTi FLAG Guidance, are the asset class that fits this brief. They generate inventory-grade reductions, they produce audit-grade documentation, and they survive the new claim restrictions because the carbon math sits inside the value chain that the disclosure already covers.
If you are reassessing a carbon strategy under the new integrity bar, or rebuilding a board narrative that has to survive a more skeptical audience, the carbon and sustainability experts at Carbon Credit Capital can help. The Dual-Value Model gives you a defensible alternative to legacy offset purchases, with the documentation and operational integration that survives the procurement scorecard and the audit. Schedule a consultation.


Sustainability In Your Ear: Cody Two Bears on Indigenized Energy’s Community-Centric Grid Strategy

Flood deaths in West African cities raise fraught issue of slum evictions

ECP Buys TPI Blade Factories, GE Pours Billions Into LM Wind Power
-
Greenhouse Gases11 months ago
Guest post: Why China is still building new coal – and when it might stop
-
Climate Change11 months ago
Guest post: Why China is still building new coal – and when it might stop
-

 Greenhouse Gases2 years ago
嘉宾来稿:满足中国增长的用电需求 光伏加储能“比新建煤电更实惠”
-

 Climate Change2 years ago
嘉宾来稿:满足中国增长的用电需求 光伏加储能“比新建煤电更实惠”
-
Climate Change2 years ago
Bill Discounting Climate Change in Florida’s Energy Policy Awaits DeSantis’ Approval
-

 Renewable Energy9 months ago
Sending Progressive Philanthropist George Soros to Prison?
-

 Carbon Footprint2 years ago
US SEC’s Climate Disclosure Rules Spur Renewed Interest in Carbon Credits
-
Greenhouse Gases1 year ago
嘉宾来稿:探究火山喷发如何影响气候预测