

The overlapping crises of extreme heat and Covid-19 “severely stretched” an already overwhelmed healthcare system in the UK with “deadly consequences”, a new study finds.
The research, published in Nature Climate Change, estimates the number of heat- and cold-related deaths in England and Wales before and during the Covid-19 pandemic.
The study finds that pressure on the health system during heatwaves was as much as three times higher for the pandemic years than it was in the previous decade. The authors find a similar result during cold periods.
The number of heat-related deaths “shifted higher” in the Covid-19 years, the study says, suggesting that Covid “may have impacted temperature-related mortality during extreme weather events”.
The authors warn that “if health services are already operating at capacity because of one crisis, the additional health burden from another crisis can break the system entirely, endangering the lives of many people”.
One expert not involved in the study tells Carbon Brief that any future pandemic is likely to be a “syndemic”, where its impacts intertwine with those of a changing climate.
And as similar groups tend to be most vulnerable to both major disease outbreaks and extreme weather, anticipating and preparing for the co-occurrence of such events “would be lifesaving”, the study authors conclude.
Heat, cold and Covid
Extreme weather events and pandemics are among the most serious risks facing the UK, according to the UK National Risk Register. Since 2020, both have claimed thousands of lives in the UK.
Between the UK’s first documented Covid-19 case on 30 January 2020 and the end of 2022, around 190,000 people in England and Wales died of the virus, according to death certificates.
Over this two-year study period, the UK has also seen extreme hot and cold temperatures – from the coldest UK temperature in more than 20 years during February 2021 to the country’s first recorded instance of 40C heat in July 2022.
To assess the link between temperature and mortality, the authors produced “epidemiological models” that analyse exposure to different temperatures and human mortality in different regions of the UK.
Dr Eunice Lo is a research fellow in climate change and health at the University of Bristol and lead author on the study. She tells Carbon Brief that “heatstroke and heat exhaustion can occur quite rapidly” and that, in her models, “we expect the mortality outcome to be within three days of exposure to heat”. In contrast, it takes longer for cold snaps to cause mortality, she adds.
The plot below illustrates the example of London. The lowest point on the curve – indicated by a “relative risk” level of one – shows the optimum temperature, when people are at lowest risk of physiological harm from temperature extremes.
If the temperature rises above (red) or falls below (blue) the optimum temperature, the risk of temperature-related mortality increases. This is indicated by a relative risk level greater than one.
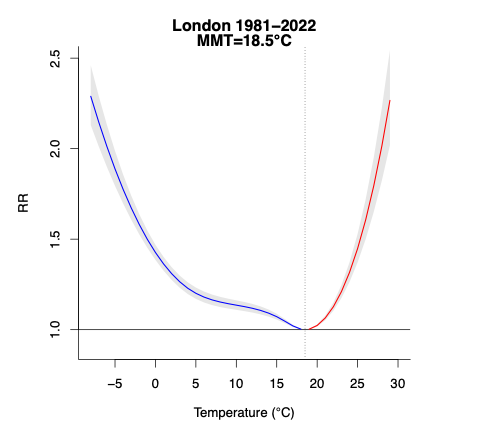
Cumulative relative risk of death in London for the overall population, using data from 1981-2022. Source: Lo et al (2024).
The authors developed a series of models for locations across England and Wales. The study estimates that, over the study period, almost 8,500 excess deaths were attributable to high temperatures and more than 125,000 deaths to cold.
The study points out that cold-related deaths are more common in the UK as “most days of the year are considered moderately cold”. As the planet continues to warm, heat-related deaths are expected to rise, while cold-related deaths will likely fall.
Lo tells Carbon Brief that factors including age and socioeconomic status also affect temperature-related mortality, but these were not included in the model.
Extreme temperatures
The chart below, from the study, shows a timeseries of daily deaths attributable to heat (red), cold (blue) and Covid-19 (purple) in England and Wales over the study period. The black line shows deaths in the UK from all causes. The right-hand section of the chart focuses on the July 2022 heatwave, when daily heat-related mortality peaked at 580 deaths – higher than at any time of over the previous decade.

Annual “all-cause mortality” in England and Wales was higher during the pandemic than it was in the preceding decade, as Covid-19 drove up mortality rates, the study finds.
The authors note that cold-related mortality “dominated” heat-related mortality in all months other than July, August and September – adding that spikes in cold-related mortality often coincided with spikes in deaths due to Covid.
There are a range of reasons for this. For example, low humidity in winter allows droplets containing the virus to spread further. And peoples’ immune systems are weaker in the winter due to a lack of vitamin D, making them more vulnerable to the virus.
The study also notes that, over the whole study period, “cumulative temperature-related deaths exceeded cumulative Covid-19 deaths by 8% in south-west England”. And while total temperature-related deaths did not exceed those from Covid in other regions, they did amount to 58% (East Midlands) to 75% (London) of Covid-19 deaths by the end of 2022.
The approach used in the study assumes that deaths caused by Covid-19 and temperature extremes are independent of each other. In other words, individuals are assumed to die either due to Covid or as a result of extreme temperature exposure, but not a combination of the two.
Nonetheless, the findings suggest that Covid “may have impacted temperature-related mortality during extreme weather events”, the study says. For example, “heat-related mortality shifted higher in the Covid-19 years”, compared to extreme events that were not affected by the disease, the authors note.
At the same time, “extreme heat may have exacerbated Covid-19 mortality”, the authors note, pointing out that on 19 July 2022 – the day that 40C heat was recorded – Covid caused 91 more deaths than the daily average over 10-25 July.
The results “highlight the complex interplay between extreme temperatures and the Covid-19 pandemic, as well as its implications on population health and health services capacity”, the study says.
Mapped
The study maps out Covid- and temperature-related deaths to see how they vary regionally.
The authors select 70 heatwave days and 70 cold days from the 30 January 2020 to 31 December 2022 study period. They then calculate regional mortality rates due to Covid, heat and cold during these days.
The maps below show the ratio of temperature-related deaths to Covid-driven deaths over the full study period (left), heatwave period (middle) and cold period (right). Numbers below zero, shown in grey, indicate that Covid-related deaths are higher than temperature-related deaths. Numbers above zero, shown in blue and purple, indicate that temperature-related deaths are higher.

During heatwaves, heat-related deaths far exceed deaths due to Covid-19 in almost all the regions studied. The study finds that the ratio of temperature to Covid-related deaths was highest in London at 2.7, where temperatures tend to be higher.
(This is likely due, in part, to the urban heat island effect – in which a combination of factors, such as buildings, reduced vegetation and high domestic energy use, cause urban areas to become hotter than more rural regions.)
This finding shows that “that even during the Covid-19 pandemic, heatwaves posed a serious threat to public health”, the study says.
Meanwhile, during cold snaps – when both cold-related mortality and deaths due to Covid spiked – Covid-related mortality was higher. The ratio ranges from 0.4 in east of England to 0.8 in south-west England.
The authors suggest that this is mainly due to “large surges in Covid-19 mortality following the first emergence of the coronavirus and the domination of the Alpha variant, both of which occurred in winter”.
The authors then performed the same heatwave and cold snap calculations for the decade preceding the pandemic, to provide a 2010-19 pre-Covid baseline.
The maps below show the ratio of average annual deaths per 100,000 people during the Covid study period to that during the preceding decade, during heatwaves (left) and cold snaps (right). Lighter green indicates that mortality rates in the Covid and pre-Covid periods were similar, while darker colours indicate that deaths during the Covid study period were higher.

The authors find that during pre-Covid heatwave days, heat-related deaths ranged from six to 14 people per 100,000. They add that during the Covid-19 study period, deaths due to heat and Covid-19 together range from 19 to 24 deaths per 100,000 people.
The authors assume that mortality broadly links to regional demand on health services. As such, they estimate that demand on regional health services was between 1.6 (London) and 3.2 (north-west England) times higher during the pandemic than in the previous decade.
By carrying out the same analysis, the authors find that during cold snaps, demand on health services was between 2.0 (south-west England) and 3.4 (east of England) times higher during Covid than in the previous decade.
The paper highlights “the deadly consequences of an already overwhelmed NHS severely stretched to function through the compound crises of extreme weather and Covid-19”, the authors say, adding:
“If health services are already operating at capacity because of one crisis, the additional health burden from another crisis can break the system entirely, endangering the lives of many people.”
Dr Kristina Dahl is senior climate scientist at the Union of Concerned Scientists. In 2020, she was a co-author on a comment paper in Nature Climate Change on the compound risks of climate change and the Covid pandemic.
Dahl tells Carbon Brief that the results of this study highlight the need for “amplified public messaging to increase awareness of temperature-related risks”, for “stronger policies and protections around extreme weather”, and to “more adequately prepare public health systems for the co-occurrence of hazards”.
Co-occurring hazards
Despite the study treating temperature- and Covid-related deaths as independent, Lo tells Carbon Brief that “there is certainly a two-way interaction” between the two.
She explains that “a lot of vulnerabilities to temperatures and Covid-10 are shared”, noting that elderly people and those with pre-existing conditions are vulnerable to both extreme temperatures and viruses. This means that one could exacerbate the other, she warns.
She adds that many measures taken to reduce the spread of Covid may have contributed to a rise in temperature-related death. For example, closing social spaces, such as swimming pools and air-conditioned buildings, meant that many people “didn’t have as much of an escape” from the high temperatures in their homes, she says.
Dr Colin Carlson is an assistant research professor at Georgetown University’s centre for global health, science and security and another co-author on the Nature Climate Change comment paper.
Carlson, who studies the relationship between global climate change, biodiversity loss and emerging infectious diseases, tells Carbon Brief that “for the last two decades, we’ve been operating in a very limited framework with how we think about climate change and infectious disease”.
He adds that “going forward, every pandemic will probably be a ‘syndemic’ with a few climate change-related components”.
Lo notes that while this study focuses on the relationship between Covid-19 and extreme temperatures, it speaks to a larger point about the link between climate-related extremes and other hazards, as co-occurring crises can threaten healthcare and other key systems.
Similarly, Dahl warns:
“As climate-related extremes become more frequent, the likelihood that they will intersect with other crises – whether related to public health, social or political unrest, or other environmental problems – will increase.”


The post Dual impact of extreme heat and Covid-19 had ‘deadly consequences’ for UK appeared first on Carbon Brief.
Dual impact of extreme heat and Covid-19 had ‘deadly consequences’ for UK

An exceptional El Niño is building. The World Meteorological Organization (WMO) says it has intensified to very strong levels and is likely to last at least through February 2027. If its current trajectory holds, it could become stronger than anything seen since WMO monitoring began four decades ago.
That is bad news for agriculture. El Niño – a naturally occurring weather phenomenon – can scramble rainfall patterns across the world, bringing drought to some regions and floods to others. And this time it is unfolding against the backdrop of a significantly hotter climate, with farmers already contending with unreliable growing seasons, extreme heat and less predictable rainfall because of global warming.
El Niño expected to bring next record-hot year as soon as 2027
We are seeing the consequences already. In Sri Lanka, drought linked to El Niño has dried wells and reservoirs and cut into crops and farmer incomes. Indonesia is experiencing its worst wildfire season in 11 years, with prolonged drought and extreme heat exacerbated by El Niño. And in Peru, authorities are preparing for the opposite extreme: intense rains, flooding and landslides which the national civil-defence agency says could affect around 1.2 million people.
These impacts will multiply as El Niño intensifies.
And yet, just as the risks to food production are rising, the money available to help farmers withstand them is shrinking.
10% funding decline in 2024
A forthcoming analysis from the Food and Agriculture Organization (FAO) shows that climate-related development finance for agrifood systems is moving in the wrong direction. In 2024, the latest year for which data is available, it fell by 10 percent compared with a 2 percent overall decline. The sectors that put food on our tables — crops, livestock, forestry and fisheries — received just 5 percent.
Yet this is precisely the moment when climate investment in agriculture needs to grow, not shrink. It can help communities adapt, build resilience and protect food security, while unlocking larger flows of public and private finance. Agriculture feeds us, supports the livelihoods of well over a billion people, and is often the first sector hit by drought, floods and extreme heat. Cutting that investment now is a false economy.
One failed harvest can plant the seed for the next crisis, forcing farmers to eat the seed they have saved for planting, sell livestock or tools, or take on debt. It can also deepen food insecurity, disrupt supply chains and drive up prices, showing up months later in supermarket aisles far away.
The Central American Dry Corridor, stretching through much of the region, shows both how exposed farmers are, and what investment can do. Based on an analysis of 41 years of satellite observations, FAO finds that some crop and pasture areas there face more than a 50 percent chance of agricultural drought over the coming months.
About half of Central America’s 1.9 million producers of maize, beans and other basic grains live in the Dry Corridor. Many grow food both for sale and for their own families. When a harvest fails, they lose both income and dinner.
El Salvador project conserves water and soil
In El Salvador, which lies within the Dry Corridor, more than 50,000 farmers have adopted practices to better withstand drought and increasingly unreliable rainfall through RECLIMA, a project financed by the Green Climate Fund and implemented by FAO in partnership with the government of El Salvador. It has substantial national co-financing, including from the country’s Environmental Investment Fund.
El Niño can intensify El Salvador’s annual mid-season dry spell, known as the canícula, turning it into a longer, harsher drought just as maize needs water most.
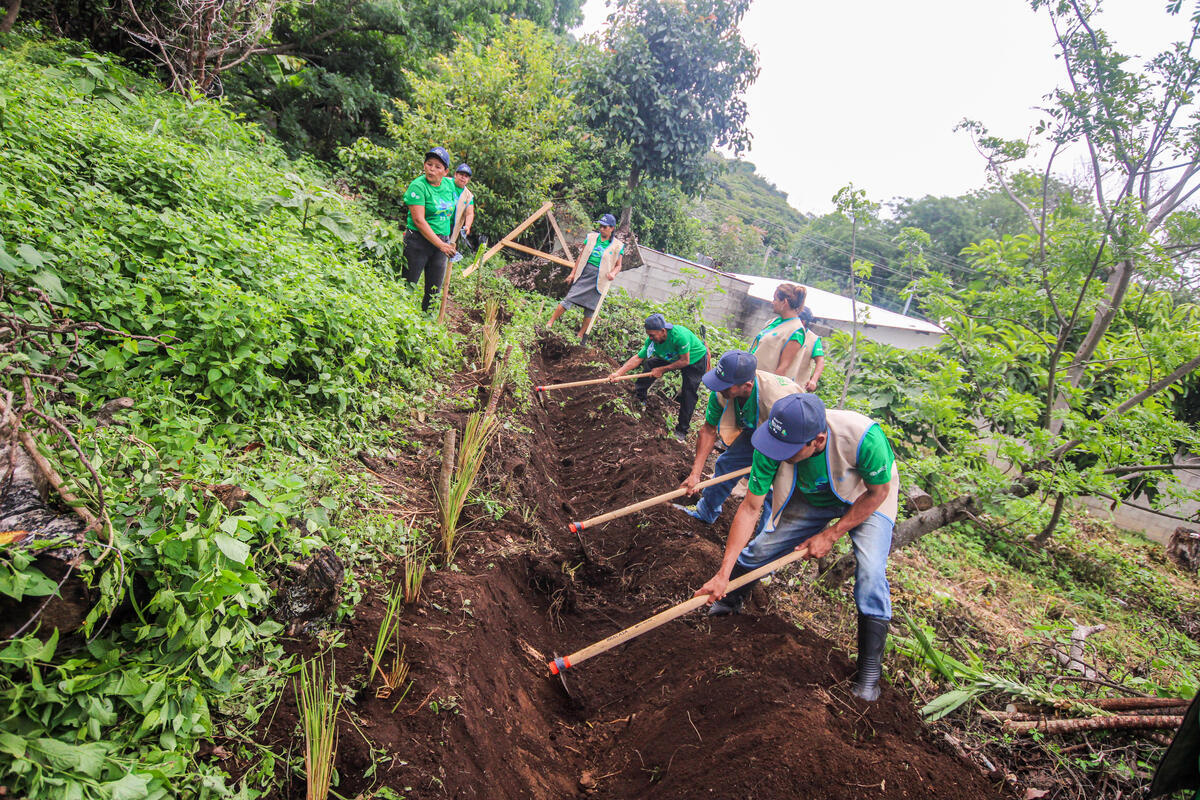
For María Cristina Corvera de López, a second-generation farmer in rural Nahualapa, adapting means changing how every drop of rain is captured and used. She plants trees alongside her crops to provide shade and minimise evaporation and uses simple irrigation channels and a homemade drip system to conserve water. Instead of burning stalks, leaves and husks after harvest, as generations before her did, she turns them into mulch to hold moisture in the soil.
“The effects of climate change are a constant challenge,” she says. But the new techniques have made her farm more resilient to El Niño as well. Where she once harvested about 50 bags of maize per acre, she now gets around 80, even during droughts. It’s enough to feed her family and sell the surplus.
Managing risk now cuts future costs
Together, these adaptations can mean the difference between losing a crop and getting through a dry season with enough food, seed and income to plant again. They are also the result of climate finance invested before disaster strikes.
RECLIMA shows what that kind of adaptation investment can buy. Adaptation accounted for 45 percent of climate-related development finance to agrifood systems in 2024, and multilateral development banks are directing more agricultural finance towards resilience. That shift reflects a growing recognition that adaptation is a form of risk management, not just a development cost.
We need much more of it. The same investments that help farmers withstand El Niño also enable them to adapt to a hotter, more unpredictable future. Cutting investment in the people who produce our food just as climate risks intensify does not save money. It simply pushes a much larger bill into the next harvest, the next food crisis, and the next El Niño.
The post As El Niño intensifies, we should be investing more in the world’s farmers appeared first on Climate Home News.
As El Niño intensifies, we should be investing more in the world’s farmers
An area of Amazon forest roughly the size of the US state of New Jersey has remained standing due to Luiz Inácio Lula da Silva’s leadership of Brazil, according to Carbon Brief analysis.
Lula beat Jair Bolsonaro in the 2022 election to become president of the nation that is home to nearly 60% of the Amazon rainforest.
Forest loss surged during Bolsonaro’s far-right presidency and dropped sharply under the left-wing Lula, with Amazon deforestation likely to hit its lowest level on record this year.
Now, as another presidential election approaches, Lula is facing off against Bolsonaro’s son, Flávio Bolsonaro, whose “anti-environmental” policies are similar to his father’s.
Carbon Brief’s analysis suggests that at least 20,000 square kilometres (km2) of deforestation has been avoided since Lula took office and prioritised Amazon protection.
The analysis is based on modelling by an international research team of an alternative scenario in which Brazil’s flagship forest code legislation was not enforced – a proxy for Jair Bolsonaro’s leadership.
Experts tell Carbon Brief that this estimate is likely “conservative” and that actual deforestation under Bolsonaro could have been “much higher”.
With Lula and Flávio Bolsonaro tied in the polls, the upcoming election is expected to significantly shape the level of environmental action in the world’s fourth-largest emitter, whose emissions are largely driven by deforestation.
‘Brazil is back’
When Jair Bolsonaro was president of Brazil between 2019 and 2022, he championed the nation’s powerful agribusiness sector and oversaw an unprecedented increase in Amazon deforestation.
Bolsonaro weakened regulations, slashed federal agency budgets and empowered illegal activities in the Amazon, while attacking Indigenous and environmental groups.
This meant that the forest code – Brazil’s flagship legislation that requires landowners to preserve and restore forest on their property – was not properly enforced.
After Lula’s presidential victory in 2022, he promised to target “zero deforestation” by 2030, telling the COP27 UN climate summit that “Brazil is back”.
Lula rolled back Bolsonaro’s wave of deregulation and reinstated a deforestation “action plan”. Led by celebrated environmentalist Marina Silva, the environment ministry scaled up enforcement and policing activities in the Amazon.
As a result, annual deforestation in the Amazon has more than halved from 11,594km2 per year in 2022 to 5,731km2 in 2025.
Data from August 2025 to July 2026 – the timespan used in government records – is yet to be released, but preliminary satellite alerts put the deforestation figure at 2,874km2.
While the final figure is likely to be higher, experts still think Amazon deforestation in 2026 could hit its lowest level since records began in 1988.
New Jersey-sized forest
Compared to a scenario in which Bolsonaro won in 2022, Carbon Brief analysis suggests that at least 20,000km2 of Amazon forest remains standing today due to Lula’s leadership.
This area – roughly the size of Wales, Belize, Slovenia or the US state of New Jersey – is indicated by the grey area in the chart below.
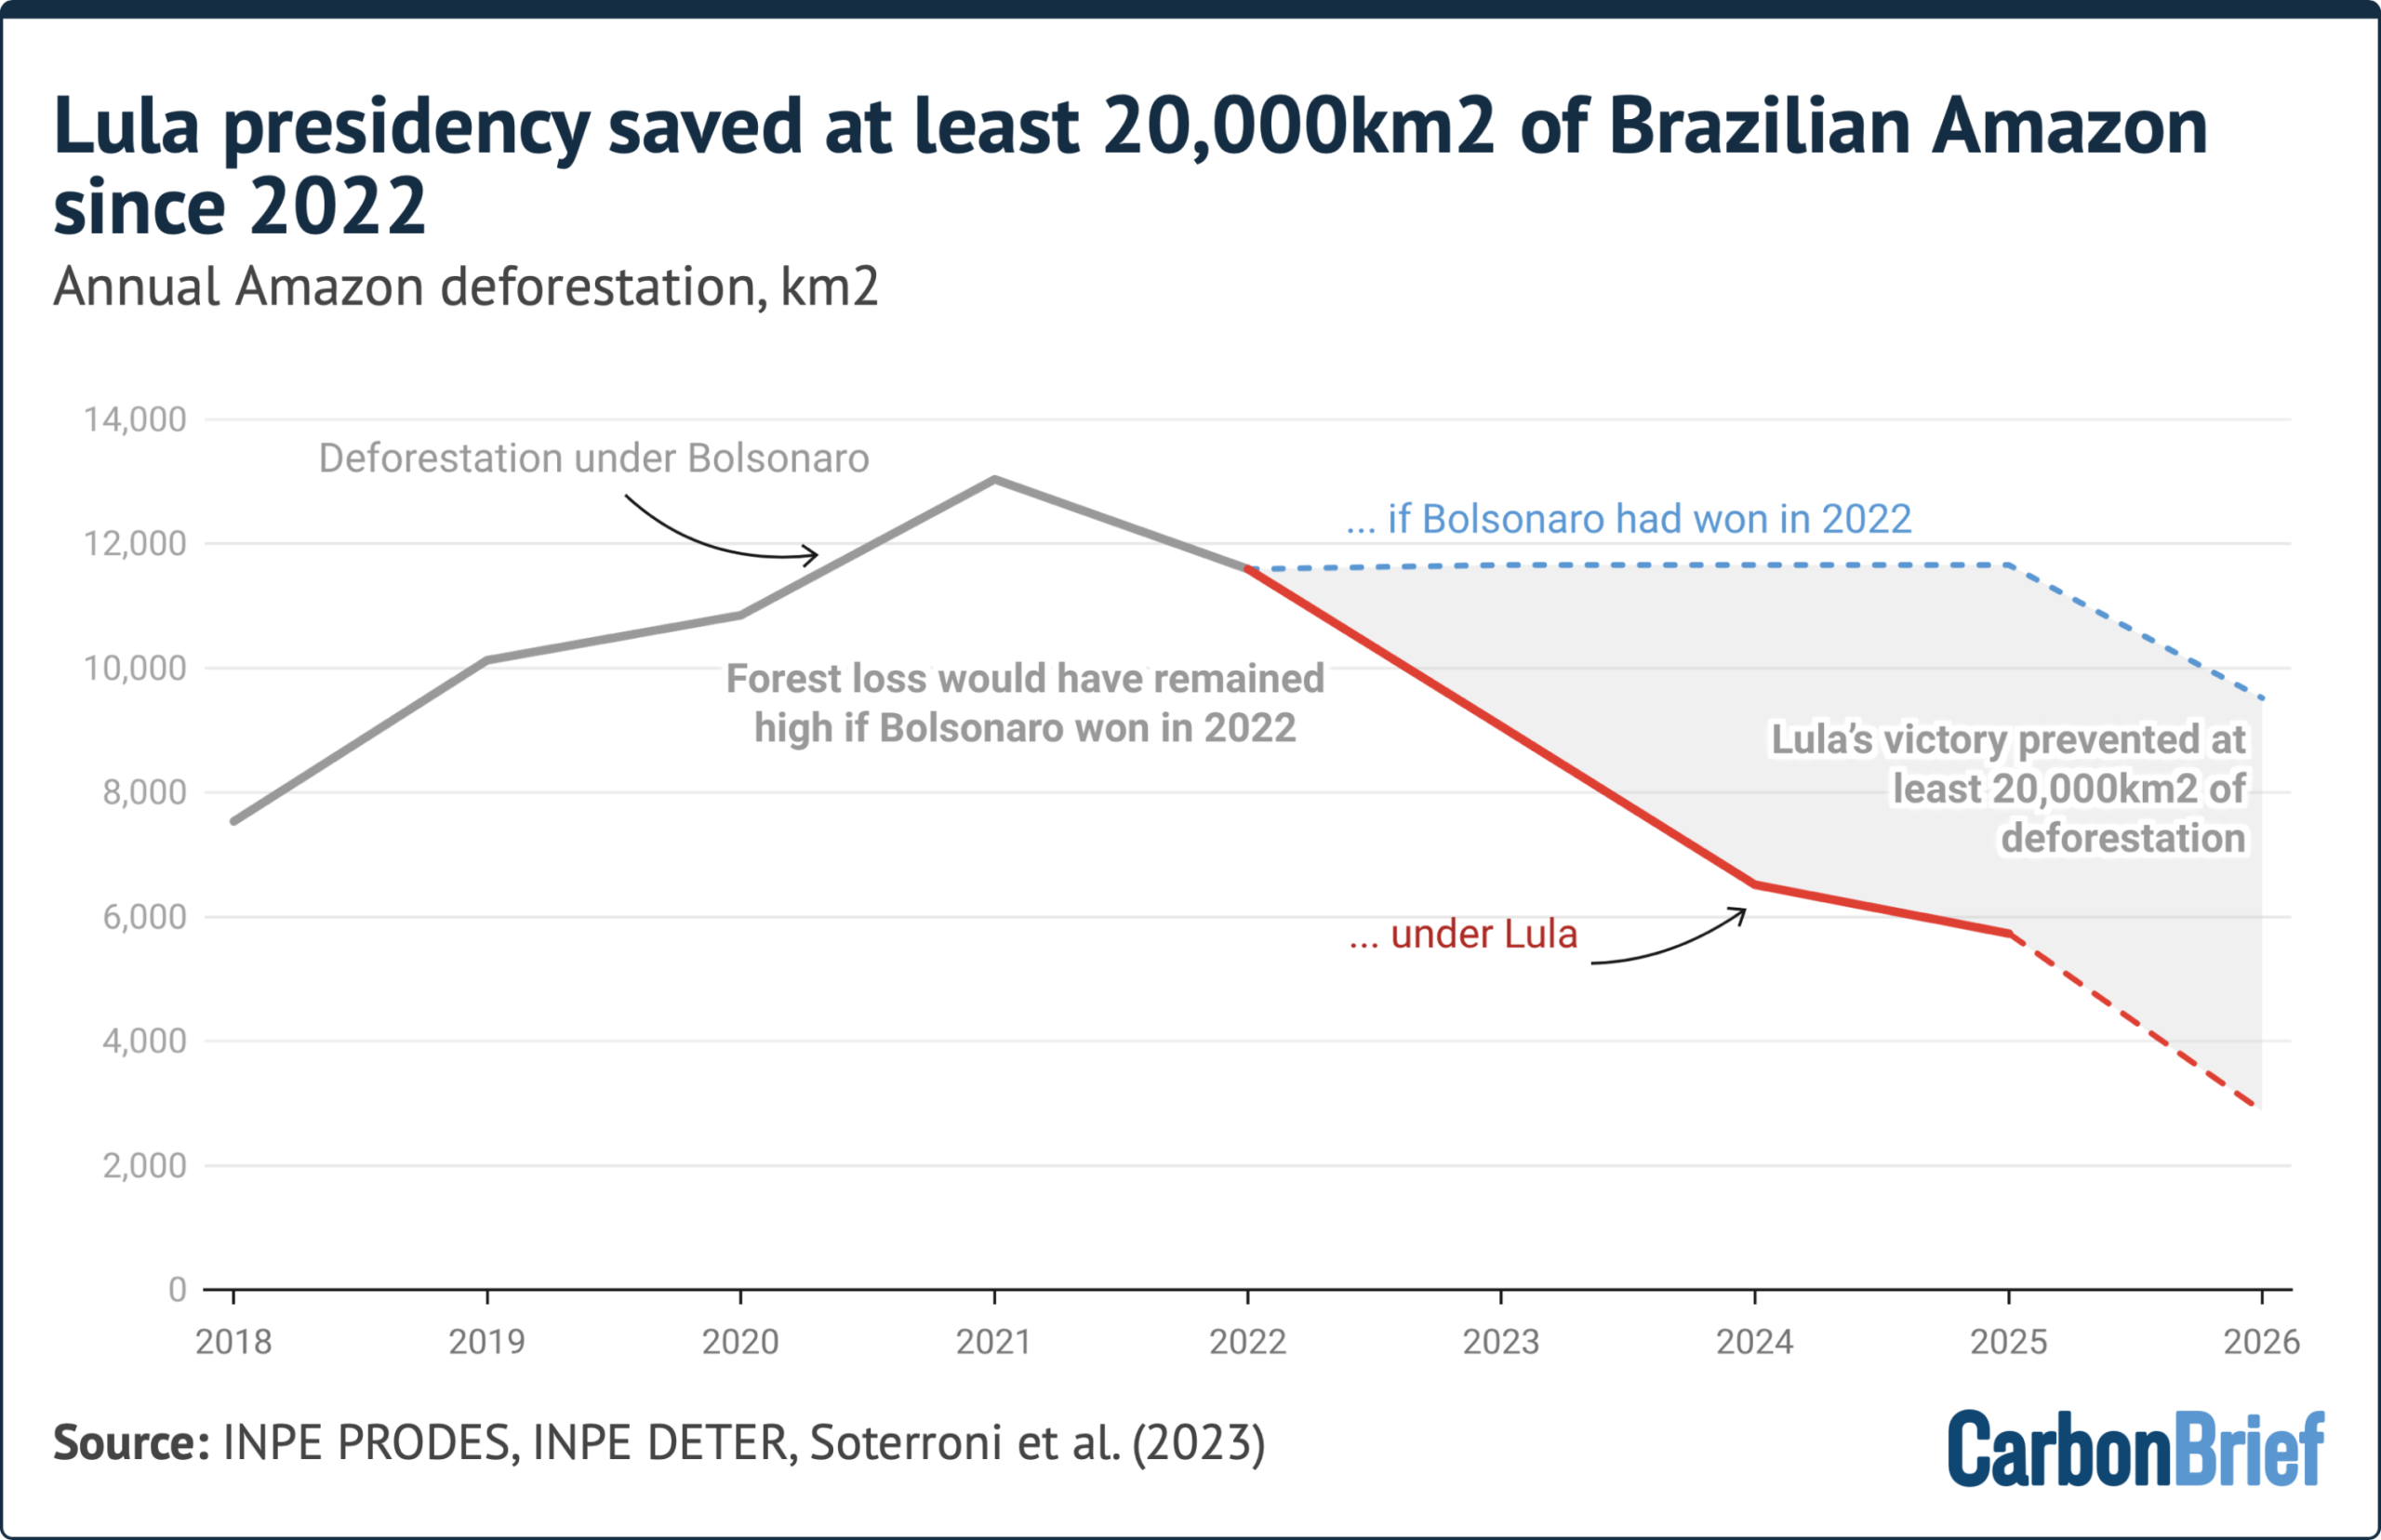
This analysis is based on a 2023 study on the role of nature-based solutions in Brazil’s pathway to net-zero emissions. This was a refined update of a 2018 study that used the same GLOBIOM-Brazil model, from researchers at the University of Oxford, the International Institute for Applied Systems Analysis and Brazil’s National Institute for Space Research (INPE).
It is based on a comparison of forest code implementation with a “baseline” scenario in which the code is not enforced, reflecting the kind of weak governance seen under the Bolsonaro administration. (See Carbon Brief’s 2022 article for more details of this modelling.)
Dr Aline Soterroni, a University of Oxford researcher who led the 2023 analysis, tells Carbon Brief that the reversal seen under Lula “shows how quickly deforestation can respond to political will”.
However, she stresses that the modelling of the “no forest code” scenario is “relatively conservative”, with deforestation remaining high but not rising.
Deforestation in this scenario – used here as a proxy for a Bolsonaro election win – is tempered by slower demand growth for Brazilian beef and soy, says Soterroni. She notes that the scenario also does not capture the potential for illegal forest clearing in response to weak governance.
Indeed, some experts anticipated in 2022 that a Bolsonaro victory would send deforestation rates rising to near-record levels.
Claudio Angelo, international policy coordinator at Brazil’s Climate Observatory, tells Carbon Brief that if Bolsonaro had won in 2022, “we have reason to believe [this would have resulted] in much higher rates than during his first term”.
Angelo says the “political signal” would likely have driven an “explosion of wildcat mining” and illegal deforestation in the Amazon. He also points to efforts – including by Flávio Bolsonaro – to formally dismantle the forest code in the Brazilian congress, during Jair Bolsonaro’s first term.
Soterroni notes that deforestation rates did not immediately drop following Lula’s election, as suggested by modelling of a full “forest code compliance” scenario. She says this reflects the “gradual and imperfect process” of restoring and enforcing the law.
Nevertheless, she tells Carbon Brief:
“The key message from our modelling is the contrast between these trajectories: weak environmental governance keeps deforestation substantially higher than full implementation of the forest code. That message remains relevant today.”
Election significance
With Jair Bolsonaro in prison for plotting a coup after losing the 2022 election, his son Flávio Bolsonaro, a senator for Rio de Janeiro, is standing against Lula in the upcoming contest for president.
There are 13 candidates, but Flávio Bolsonaro and Lula are by far the frontrunners and are currently neck-and-neck in opinion polls.
If Lula wins, experts say he is likely to continue with the “zero deforestation by 2030” agenda that has already had a pronounced impact on forest loss.
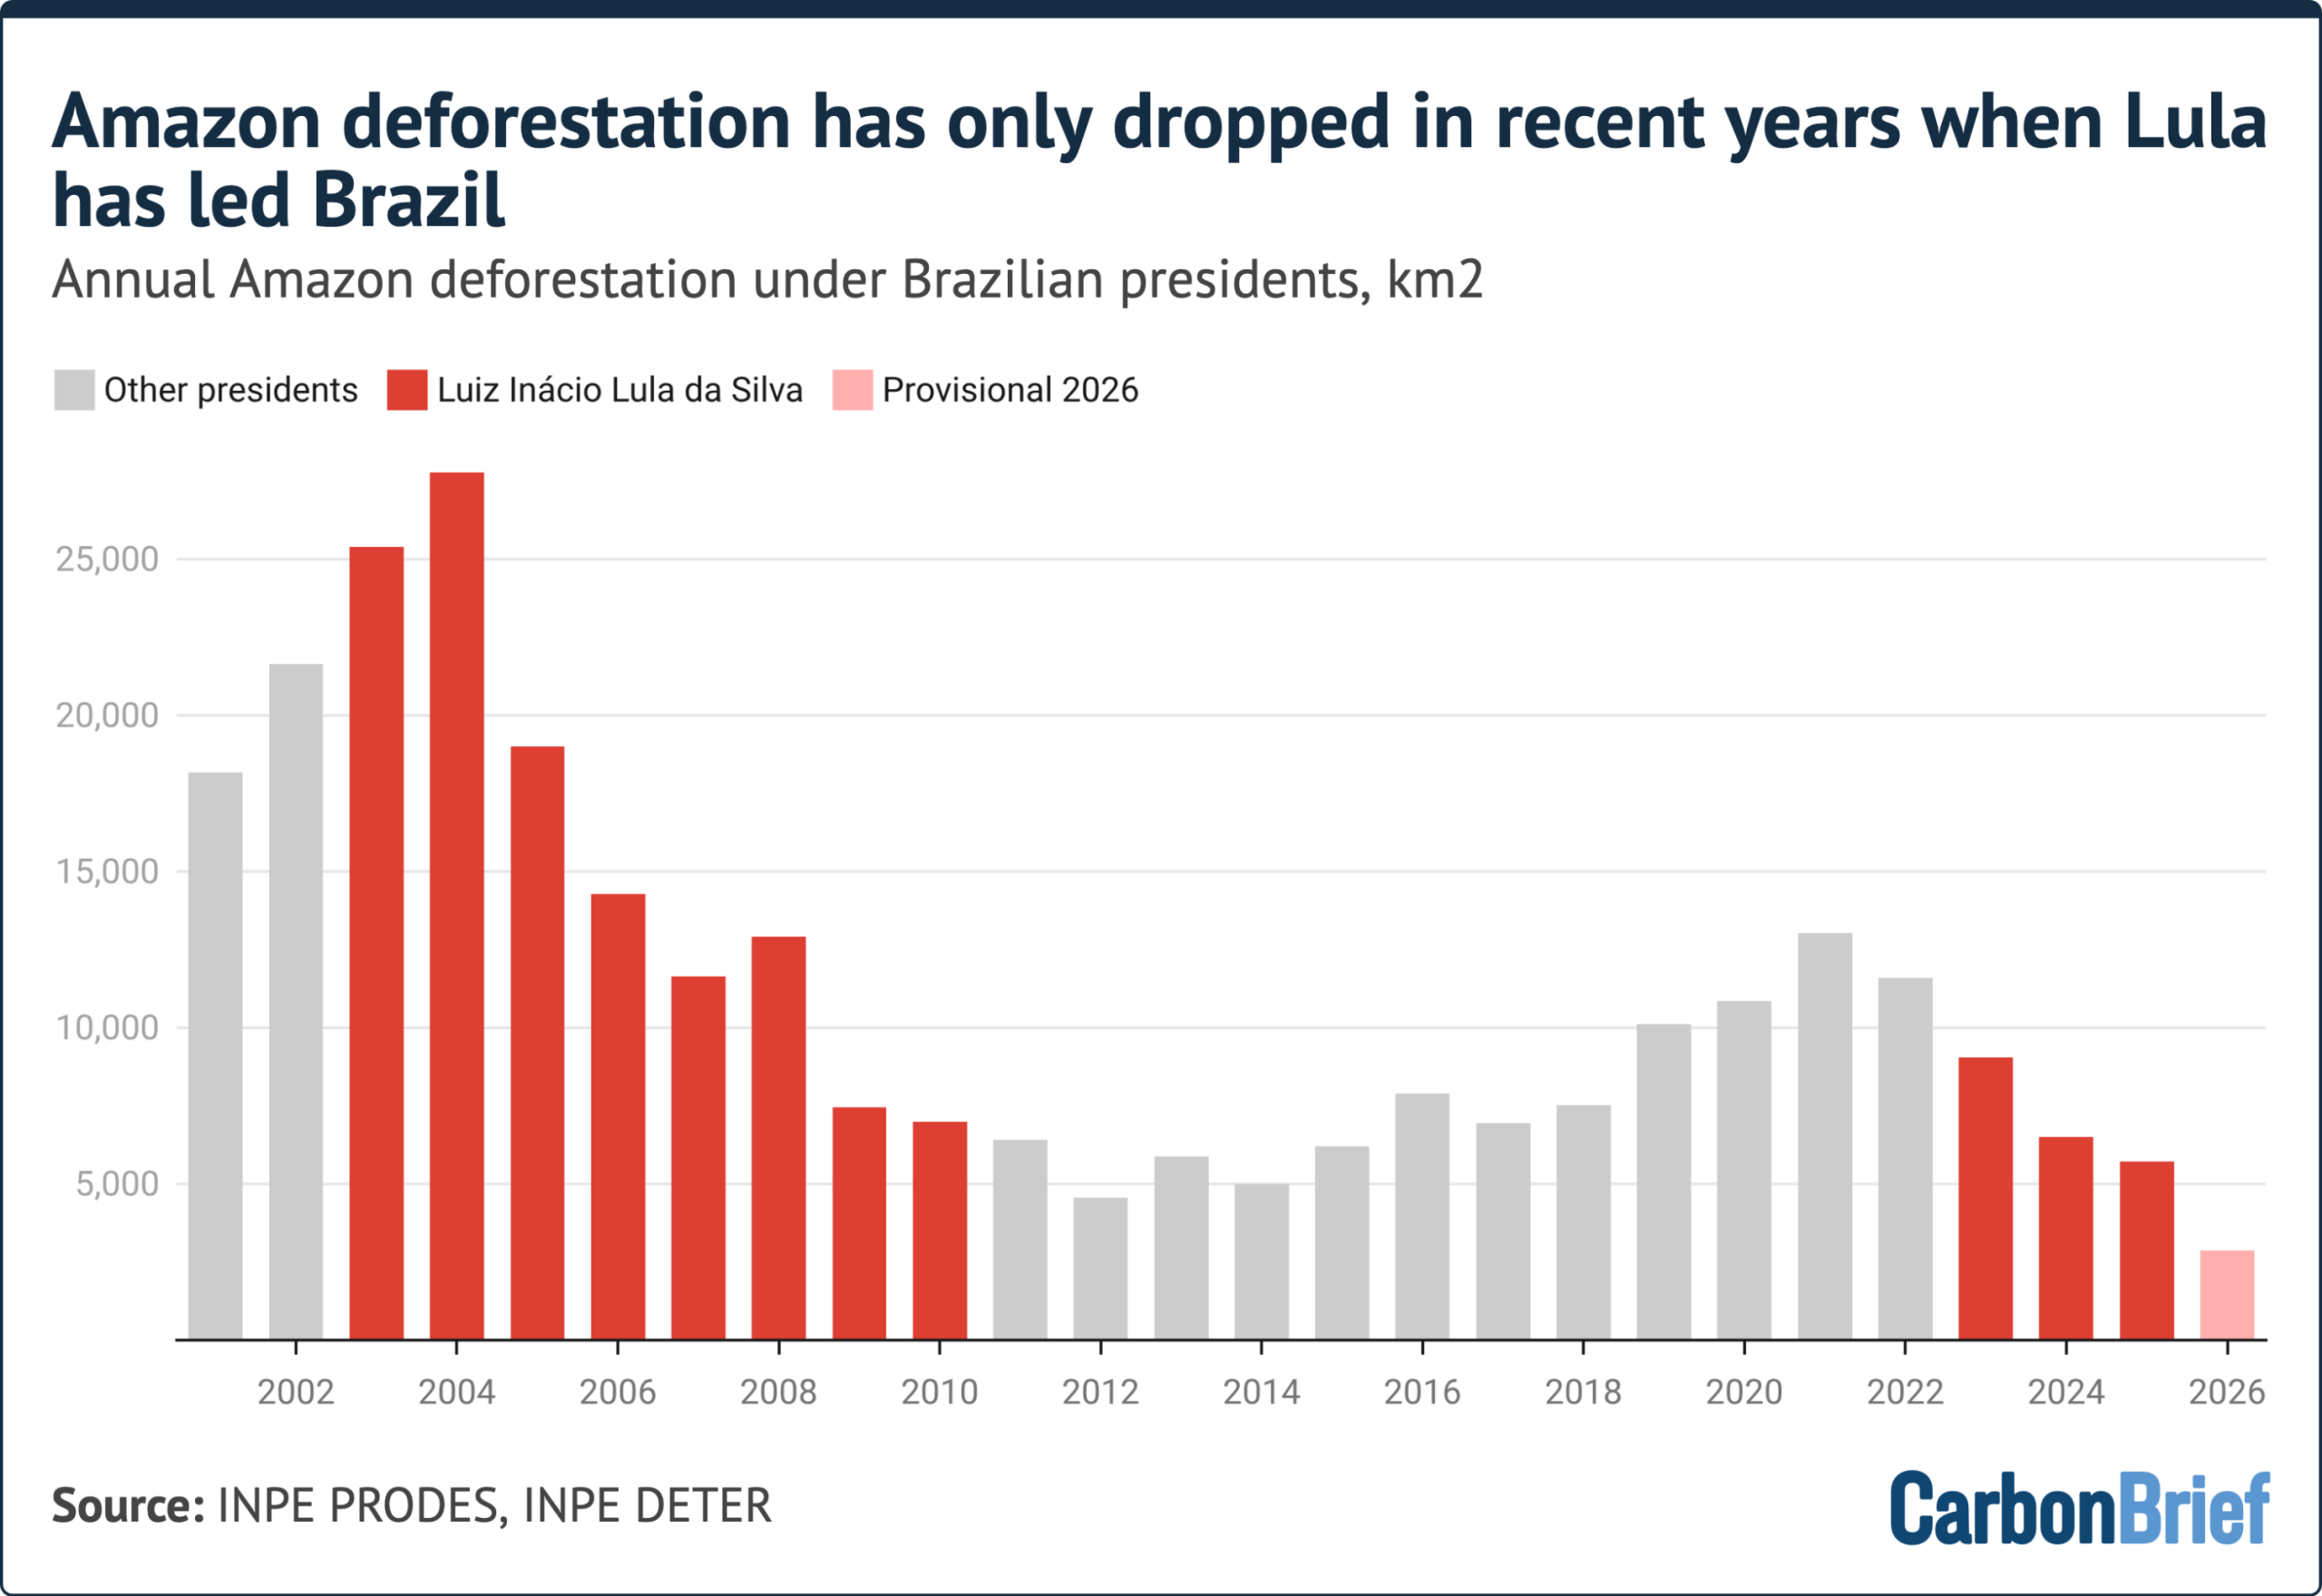
As the chart below shows, periods when Amazon deforestation fell in recent history all occurred during Lula’s three terms as president.
In contrast, experts say Flávio Bolsonaro, a climate sceptic who has indicated he will continue his father’s political agenda and favour agribusiness and mining, will likely drive a surge in deforestation. Angelo tells Carbon Brief:
“At the risk of sounding alarmist, I’ve been saying that Lula’s re-election is the only thing standing between us and a wide destruction of the Amazon.”
A Bolsonaro win would be a “tremendous disaster”, says Dr Patricia Pinho, deputy science director at the Amazon Environmental Research Institute, adding:
“I don’t think we can afford four years of increasing deforestation [and] violence against Indigenous peoples.”
Dr David Lapola, an ecologist focused on Amazon research at the University of Campinas in Brazil, says he believes deforestation “would certainly rise” and Brazil’s climate and deforestation goals “would be thrown in the trash bin”. He tells Carbon Brief:
“The Bolsonaro administration in the 2019-2022 period showed that the deconstruction of environmental policies and institutes can be done very, very quickly.
“In a matter of a few months, they can destroy what has been constructed over decades of environmental policy and activism in Brazil.”
‘Greenest’ policies
Lula has the “greenest” policy proposals of Brazil’s six top-polling presidential candidates, according to analysis by the Climate Observatory.
The analysis identifies 16 “positive and detailed” environmental commitments in Lula’s proposals, including reaffirming his “zero deforestation by 2030” goal.
Flávio Bolsonaro, on the other hand, has one positive environmental commitment and seven “clearly anti-environmental” proposals.
The right-wing politician has committed to zero “illegal” deforestation by 2029. However, he has also previously led an attempt to change the forest code, opening up large tracts of previously out-of-bounds forest for legal clearance by extractive industries.
Given this, Angelo tells Carbon Brief that he is sceptical about the 2029 pledge.
“The only way you can trust him on this is to think that he is going to revoke the forest code and make all illegal deforestation legal.”

Lula is also the only major candidate to list a clear target for cutting national emissions, sticking with Brazil’s existing goal to cut emissions by 59-67% by 2035, compared to 2005 levels.
Overall, the Climate Observatory notes that climate change and environmental issues “are off the radar for most candidates”, who are instead focusing on the economy and security issues.
Pinho adds that deforestation and the Amazon have not been at the “forefront” of this election, compared to 2022.
If Bolsonaro wins, up to 95% of the Amazon would fall under the leadership of right-wing national governments – including those in Bolivia, Colombia, Ecuador and Peru – reported Mongabay. It noted that presidents in all these nations “explicitly favour agribusiness and mining over environmental conservation”.
If no candidate receives a majority of votes in the first round of Brazil’s election on 4 October, a runoff will take place on 25 October, as has happened at every presidential election since 1998.
Soy moratorium and Brazilian congress
Other factors will also play a role in future deforestation in Brazil, regardless of the next president.
One is the effective end of the Amazon soy moratorium. This is a voluntary agreement signed by companies committing to not buy soya beans grown on land in the Brazilian Amazon that was deforested after 2008.
Conservation organisation WWF’s international director general, Kirsten Schuijt, previously described it as the “most impactful voluntary supply chain policy ever implemented”.
However, major grain traders withdrew from the agreement earlier this year, effectively bringing it to an end. Pinho describes this move as a “huge destruction” of Brazil’s environmental protections.
Research shows the moratorium prevented around 18,000km2 of deforestation in its first decade of operation from 2005-16.
In contrast, a 2026 study estimated that the end of the moratorium could result in 14,000km2 of additional deforestation in the Amazon by 2036.
Alongside choosing a new president on 4 October, Brazilian voters will elect state governors and members of congress, which will also factor into future environmental impacts.
Right-leaning parties, including the far-right Liberal Party linked to the Bolsonaros, currently hold half the seats of the two chambers of congress.
This has led to conflict between lawmakers and Lula. For example, in 2025, congress bypassed Lula’s veto of several aspects of a controversial piece of legislation dubbed the “devastation bill”.
Pinho says that the potential for a right-wing congress and president would be “devastating for the environmental and climate agenda”.
Lapola notes that a Flávio Bolsonaro presidency “would consolidate the view in Brazil that environmental protection is solely a matter of political preference, and not a crucial need of all people”. He adds:
“Land pillage, destruction of precious biodiversity and scorning of Indigenous peoples simply cannot be a nation’s project in the 21st century. We have got to be smarter than that, for sure.”
related
Q&A: What change of power in Colombia could mean for world’s fossil-fuel transition
Brazil’s biodiversity pledge: Six key takeaways for nature and climate change
COP30: Could Brazil’s ‘Tropical Forest Forever’ fund help tackle climate change?
Guest post: How Caribbean states are shaping climate legislation
The post Analysis: Lula presidency saved at least 20,000km2 of Brazilian Amazon since 2022 appeared first on Carbon Brief.
Analysis: Lula presidency saved at least 20,000km2 of Brazilian Amazon since 2022
This letter is a bit more direct and longer than most of those which I write, but I hope you will be okay with that, because the times seem to call for being plain.
A few weeks ago I got a text message from an old and dear friend —let’s call her Hannah.
I have enough shared life with Hannah that, whenever we talk, the conversation always feels current and effortless, despite gaps of months or even years.
Hannah has been talking with her son — we’ll call him Neil — who is a teenager and doing well in school, but wildly worried about the state of the world, including the imminent trajectory of global warming. Hannah and I don’t text each other other very often, but on this occasion she’s reached out with something visceral:
Neil has challenged me to point him to something hopeful, if I can find it. He says so far no one is showing any will to uphold the Paris Agreement. I am checking in to see how you still manage to have real hope.*
Then, just a few days later, the United Nations Environment Programme Limiting Overshoot report landed, containing the principal finding that it is likely the global temperature will soon exceed 1.5°C.
After that news, and the real time devastation in Nepal, and in the context of the broader state of the world, I found myself having multiple conversations with friends and colleagues about the structure of hope. I want to openly share that after a few of these exchanges, I metaphorically closed the blinds, and wondered how to feel, and what to do, because there is no avoiding the dreadfulness of the news, and what it means for the suffering of people and life on Earth.
But if you are fortunate enough to have time, space and security to do so, then after the darkness, you open the shutters and once again there is light. This is the structure of my innermost resolve.
* * *
Our lives — those of us living on our magnificent earth now — have the greatest possible purpose.
There is virtually no problem that we endlessly clever and creative, human beings cannot solve, when we work together.
And we are not just intelligent and ingenious; we are inherently social, nurturing and brave; capable of the deepest enduring love.
Each of the roughly 12,000 generations of humanity so far has made life possible for those who have followed, through acts of devotion.
Babies have been held and fed. Water and food have been found and shared. Shelter has been built. For 12,000 generations we have held the hands of our children.
Every single one of us was once carried in the arms of another, unable to walk ourselves. It is our thoughtfulness, kindness and care that have seen us through as a species. Sometimes this has been in the most exigent of circumstances, when enough of our ancestors did not give in, faced incredibly difficult things, to somehow make it through.
And so it comes to this. To what we now must do. We must do as 12,000 generations of people did for us.
The struggle to keep global warming to under 1.5 degrees may be over. The battle of return—to get our planet back to safe temperatures at emergency speed and scale — is just beginning. Upon this struggle depends the future of all we care about, and that of all life on Earth. The prospects of the next 12,000 generations are conditioned by our efforts now.
Our work now is to keep the overshoot as low as we can, make it as brief as possible, and do everything within our power to alleviate other pressures on nature. It is to take care of humanity — of one another — in the face of mounting climate and ecological damage. And by these efforts, create the conditions for future flourishing. Every fraction of every degree matters.
What must now be done is hard, much tougher than should have been necessary, because of the vested interests in coal, oil and gas and deforestation, and the failures of decision makers. And while renewable energy has surged, making the case for change much simpler, on the other side of the ledger there’s the reactionary and gangsterist turn of politics and the multiplier effects of wars and mass violence, with the existential destabilisation of big tech looming over all.
There is no sugarcoating the scale of difficulty. But what is necessary remains within our collective power. We must never, for one second, say that returning our planet to flourishing is impossible — many of the obvious solutions already exist; but even where transformation relies on reforms, technologies or capabilities that might sound fanciful, or historical changes that are unprecedented, this can be no barrier to our conviction. After all, much of what we take for granted today as ordinary features of social life, would have been considered impossible by every single generation before us.
The world has not been destroyed by nuclear war; we solved the growing hole in the ozone layer; Antarctica was kept sacrosanct from exploitation. Humanity has collectively triumphed before, and can do so again.
We can find the necessary social and political will to do what is needed because these are endlessly renewable resources. The necessary financial capital exists. Apart from the fossil fuel industry, the greatest barrier we face is to mistakenly concede that what lies before us is insurmountable. It is not.
We must avoid the siren song of fatalism. Because. It. Is. Never. Too. Late.
None of which is to be insensitive to the horrors already unleashed — the deadly and grotesque harm to people, places and species that cannot be undone; or to be blind to the impacts that are coming. But where we have the power to act, we also have the responsibility — and the extraordinary privilege — to do what must be done.
Although she is wounded, our planet is still alive and beautiful beyond all of our comprehension. Hundreds of billions of creatures live and thrive still upon this earth. Nothing has happened until it has happened, and life fights for life. Every beetle, every tree, all the fish in the ocean, the smallest of the geothermal shrimps, the greatest of the whales and the mightiest of the birds — all demand life every second of their existence, so that their species too may have future generations.
No individual has to know how to solve this alone. Indeed, finding some detachment and humility is essential to concentrate on the role that each of us can play.
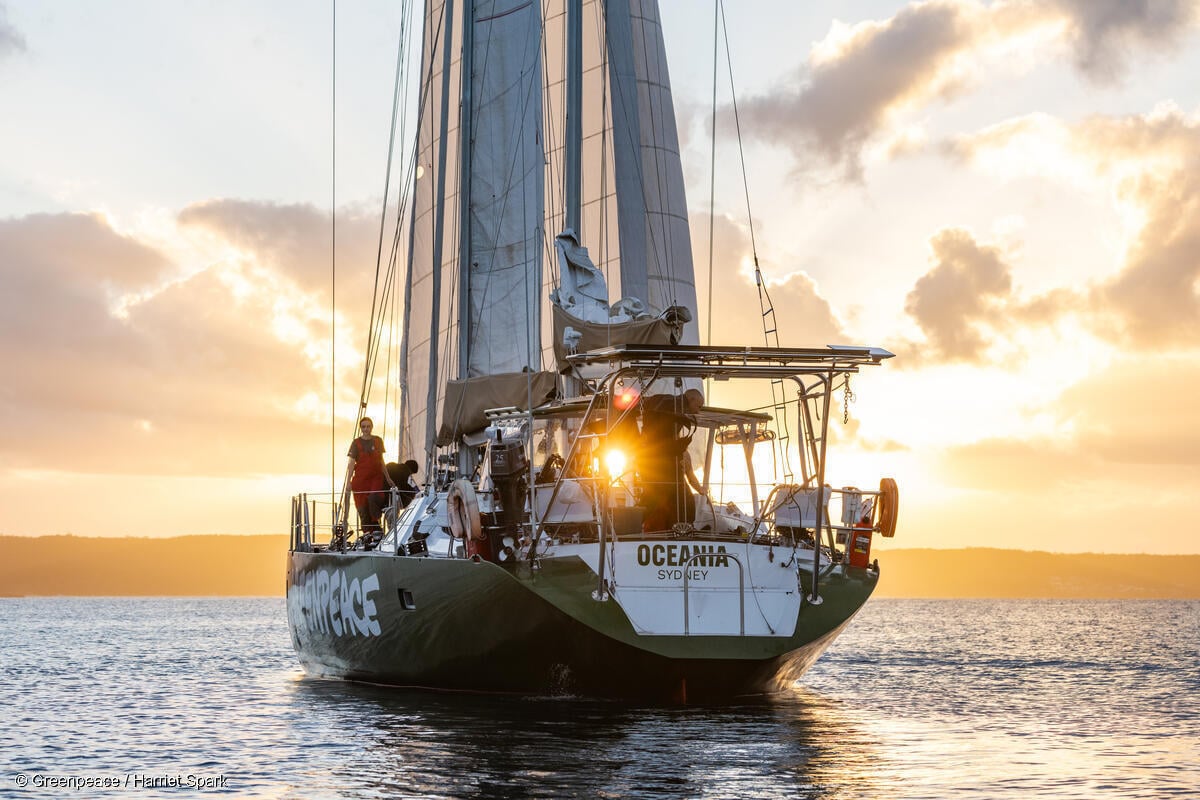
Hope is not merely a mindset or a story we tell ourselves. Collective power is not abstract; it is what we do, together, applying ourselves to the practical mechanics of change and contestation within society, by being part of the organisations and networks of people that are dedicated to effective strategies. It is why I am so committed to Greenpeace.
Working from without and within, there are opportunities to make rapid change within institutions, governments, businesses and communities to create the social, economic and political momentum for emissions reduction at speed and scale, reminding ourselves always of what remains possible, even if it hasn’t happened yet.
We can return the planet to safer temperatures. We can put technologies back in the service of people and life. We can return to the assumptions that seemed so obvious just one generation ago — that it is both possible, and our obligation, to build a better future for all people, and for life on Earth.
I did write back to Hannah and Neil, to say honestly to a treasured friend and her son, that yes, as a matter of faith, conviction, evidence and strategy, absolutely there is real hope. And this is a pledge not just to Neil and his generation, but to the next 12,000.
Together, we have the power. Together, we cross this bridge through the dark. To secure an Earth capable of nurturing life in all of its magnificent diversity.
We did not choose to carry this historic responsibility, but here we are. And it is so lucky that we are here.
I wouldn’t choose any other time to be here, alive on Earth, with you.




-
Climate Change1 year ago
Guest post: Why China is still building new coal – and when it might stop
-

 Greenhouse Gases2 years ago
嘉宾来稿:满足中国增长的用电需求 光伏加储能“比新建煤电更实惠”
-
Greenhouse Gases1 year ago
Guest post: Why China is still building new coal – and when it might stop
-

 Climate Change2 years ago
嘉宾来稿:满足中国增长的用电需求 光伏加储能“比新建煤电更实惠”
-

 Renewable Energy11 months ago
Sending Progressive Philanthropist George Soros to Prison?
-
Climate Change2 years ago
Bill Discounting Climate Change in Florida’s Energy Policy Awaits DeSantis’ Approval
-
Greenhouse Gases1 year ago
嘉宾来稿:探究火山喷发如何影响气候预测
-

 Climate Change2 years ago
Analysis: China’s CO2 falls 1% in Q2 2024 in first quarterly drop since Covid-19