2024年3月,中国的二氧化碳(CO2)排放量下降了3%。这标志着自2022年12月放宽防疫措施、重启经济活动以来,中国碳排放量连续14个月的增长告一段落。
Carbon Brief基于官方数字和商业数据进行的新分析显示,中国CO2排放量在2023年或已达峰。
2024年3月CO2排放量下降的驱动因素包括光电和风电的快速增长,这满足了电力需求增长的90%,以及建筑活动的减少。
石油需求增长也陷入停滞,表明疫情后的经济反弹可能已临近尾声。
如果中国能维持去年创纪录的清洁能源建设水平,该国有望在2023年实现碳达峰。
然而,整个行业和政府对清洁能源的增长前景看法不一。如果中国尚未实现碳达峰,如何弥合分歧将是决定碳达峰何时到来的关键因素。
该分析的其他关键发现包括:
- 尽管电力需求强劲增长,但光电和风电的增长推动化石燃料发电量份额从前一年的67.4%下降至2024年3月的63.6%。
- 由于中国房地产建设活动的持续萎缩,2024年3月钢铁产量下降了8%,水泥产量下降了22%。
- 电动汽车现在约占中国道路上汽车总量的十分之一,将汽油需求增长拉低了约3.5个百分点。
- 去年创纪录的太阳能新增发电装机中,约45%是规模较小的分布式光伏,导致看似出现了“数据缺失”问题。
为什么三月排放量出现下降?
根据中国国家统计局发布的初步能源消费数据,2024年第一季度中国的碳排放量总体显著增加。

今年1月和2月的碳排放量仍较2023年的低基数大幅增长,彼时中国经济仍因刚结束不久的清零防疫措施而受到抑制。
因此,与2023年同期相比,2024年第一季度的CO2排放量同比增长了3.8%,煤炭消费量增长了3%,石油消费量增长了4%,天然气消费量增长了11%。
转折点出现在今年3月份。由于该月份的煤炭消费量降低了1%,石油消费保持平稳,而水泥产量则下降了22%,导致3月CO2排放量同比下降了3%。尽管天然气消费量增长了14%,但由于其在中国能源结构中占比较小,从而影响有限。
如下图所示,自2022年12月放宽疫情限制措施后,中国的碳排放量从2023年2月开始回升。
因此,2023年1月至2月的同比比较仍然受到去年疫情导致的低基数影响,这使得3月的数据成为能够清楚地反映碳排放趋势的首个月度数据。
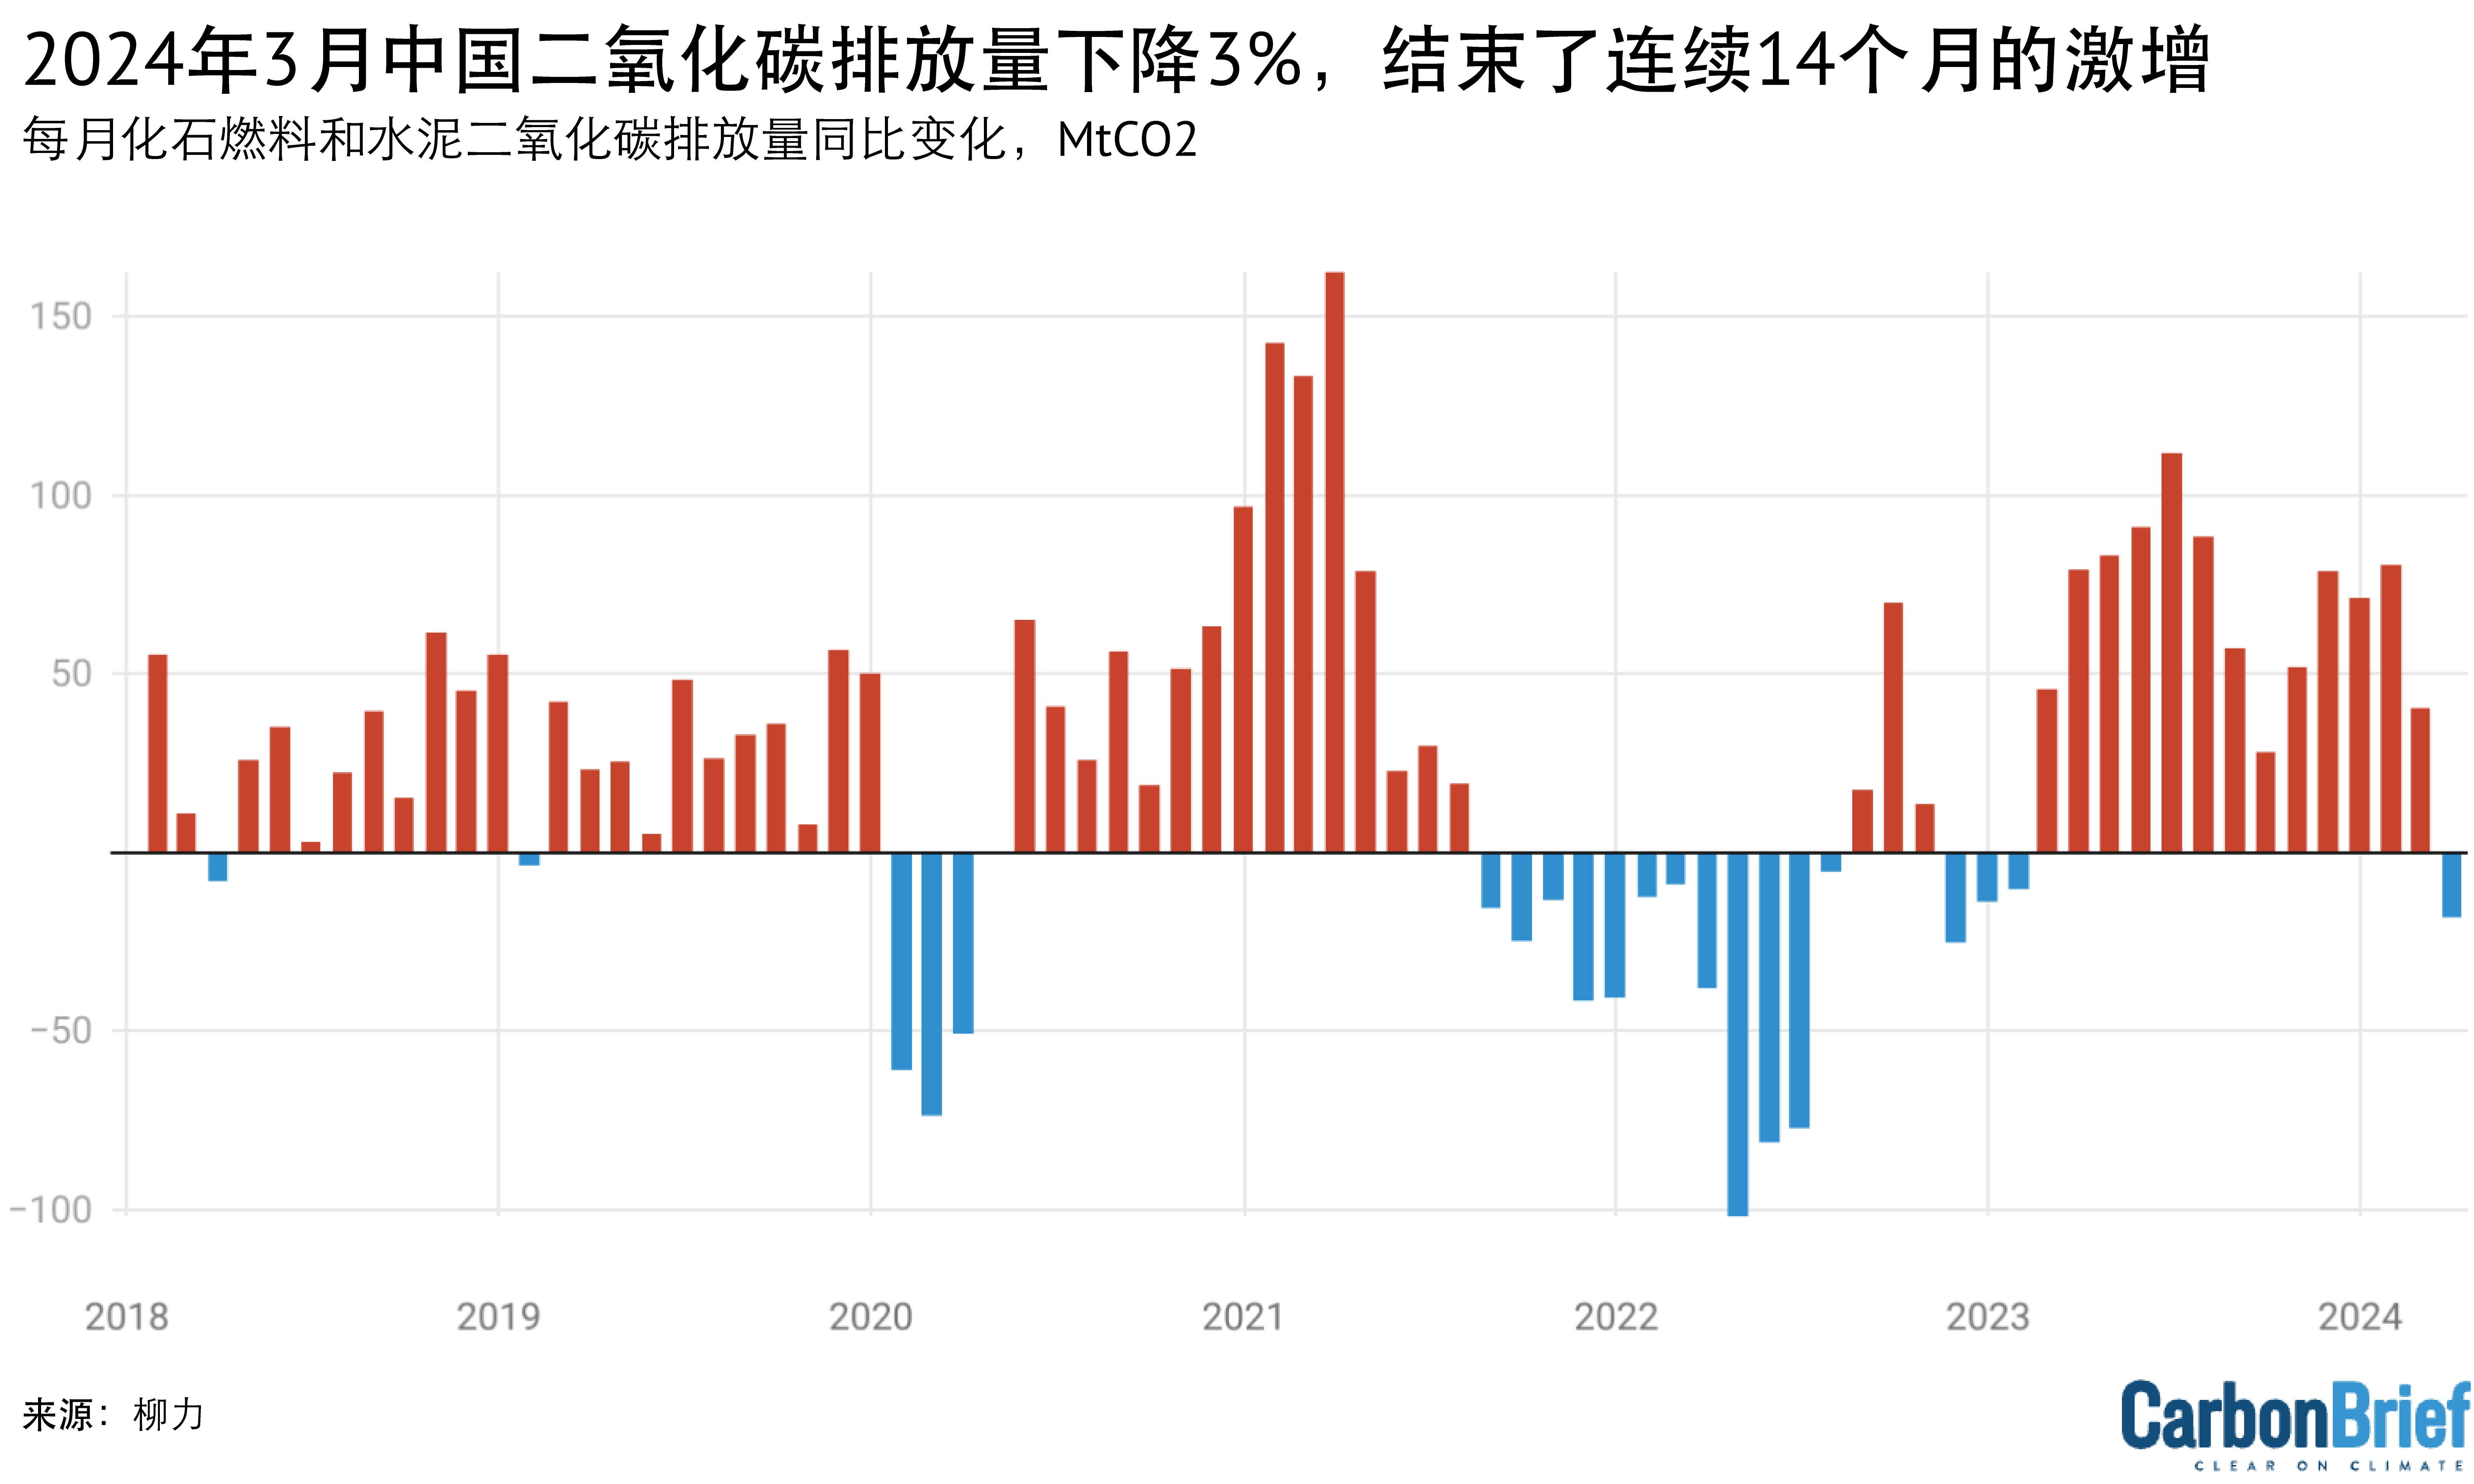
近年来,中国碳排放量增长的主要推动力来自电力部门(见下文)。
反之,3月碳排放趋势转为下降,主要原因也是电力部门的排放量增长的大幅放缓。由于光电和风电的强劲增长,电力部门3月的碳排放量仅同比增长了1%。
如下图所示,尽管电力部门的排放量企稳,但建筑业对钢铁和水泥的需求持续下降,这才是3月份碳排放量减少的最主要原因。
钢铁产量下降了8%,因此炼钢厂的主要燃料炼焦煤的产量也随之降低。水泥产量同比骤降了22%。
由于政府对房地产行业高杠杆的打击和对金融风险的管控,以及建筑行业过去的繁荣导致了产能过剩,房地产行业投资已连续第三年收缩,这使得上述排放趋势可能会继续维持。

尽管建筑业需求出现收缩,但中国对钢铁和其他能源密集型金属的需求并未出现预期的大幅下降。
这背后的原因是制造业的快速增长和对该行业的投资,而在设施建设和工业机械生产中都需使用金属制品。
但是,随着全球各种商品和大宗货物的市场逐渐饱和,这种制造业的增长不太可能持续下去。当局的经济政策现在强调“新质生产力”,这是推动经济增长摆脱对传统重工业的依赖的最新尝试。“新质生产力”指高端的制造和研发,这些领域的能源密集程度大多比中国的传统工业部门更低。
从2024年3月其他行业的情况来看,运输用油的需求在经历了几个月的强劲增长之后,变得与去年同期相比近乎持平。这表明疫情后的需求反弹可能正在逐渐消失。
航空燃料(+35%)和汽油(+7%)产量仍在增长,说明客运需求出现增长。但柴油产量增长停滞(+1%),原油加工量也仅增加了1%。
电动汽车的增长正显著削减石油需求量。根据过去十年的累计销售数据估计,电动汽车在道路上所有车辆中的占比从去年的7.0%增加到10.5%。这表明,电动汽车的普及使汽油需求增长降低了3.5个百分点。
天然气需求出现大幅反弹,同比增长14%。此前天然气价格高企导致需求下降。天然气消费的增长主要来自工业和家庭部门。
随着燃气电厂利用率有所恢复,电力部门的天然气消费量增长了8%,但这仅占总体增长很小的一部分。
天然气在中国能源结构中的占比曾连续增长了二十多年,在2021至2023年间有所下降,现在开始恢复增长。
近期推动碳排放量增长的一个因素仍在继续:化工行业的煤炭消费量增长了14%,延续了2022和2023年两位数的增长趋势。
尽管目前还没有足够的数据来估算4月份的CO2排放量,但当月的工业数据表明,3月排放下降的趋势仍在继续。
由于光伏发电满足了大部分的电力需求增长,火力发电量——主要来自煤电——缓慢增长了1.3%。钢铁、水泥和焦炭产量分别下降了8%、9%和7%,反映出建筑需求的持续减少。炼油量下降了3%。
国内煤炭开采量下降了3%,而进口量增加了11%,这意味着总供应量减少了5%。
天然气需求进一步强劲增长,进口量增长了15%,国内产量增加了3%。在能源密集型行业中,化工和有色金属行业的产量继续保持较快增长。
光电和风电满足需求增长
企稳的电力部门排放量值得关注,因为电力需求继续以7.4%高速增长,而受长期干旱的影响,水电利用率低于长期平均水平。
过去几年,工业用电推动电力需求迅速增长。3月,工业需求增长放缓,但服务业的反弹维持了整体需求的增长。
近一半的用电需求增长来自工业,其中有色金属、化工、机械和电子等行业是最主要的需求增长的领域。服务业贡献了需求增长的三分之一,主要源自批发和零售贸易,另有六分之一来自家庭用电。
在2022年历史性的热浪引发一波空调购买潮的推动下,家庭用电需求在过去几年也出现了激增,尤其是在以前没有空调的低收入家庭。
尽管电力需求快速增长,但由于分布式光伏电站的大规模部署,规模以上工业发电量增速放缓至3%。
(与大型集中式太阳能发电场相比,分布式光伏电站指的是装机规模较小的发电系统,通常安装在家庭和企业的屋顶上。)
总体而言,由于2023年光电和风电装机的创纪录增长,光电和风电发电量占比已达到22%,并在3月实现了近90%的同比增长。非化石燃料发电量占比从去年的32.6%上升至36.2%。

分布式光伏对发电的贡献越来越大,但这在一定程度上被中国月度电力数据的报告方式所掩盖。国家统计局只发布大型光伏和风力发电站的月度发电量。它还系统性地上修了前几年的数据,这表明其没有实时捕捉新进入市场的企业的发电量。
由于去年创纪录的光伏新增装机容量中有45%是分布式发电,对小型光伏装机的排除对这些数字的影响比以往大得多。
这在中国和海外引起很多困惑,特别是报告的用电量数据远大于发电量数据,这显然是不可能的,彭博社甚至称其为“数据缺失问题”。
然而,用电量和规模以上工业发电量之间不断扩大的差距表明,分布式光伏在满足用电需求方面的贡献越来越大。
与月报数据不同,中国的年度统计公报中没有“缺失”的数据,因为年度统计包括所有电厂,无论其规模。例如,2023年的年度统计公报显示,光伏发电量是月度统计的两倍,风电发电量则多出了10%。
事实上,如果按照月度数据中的装机容量和利用小时数来计算发电量,得到的数据与年度报告数据非常接近。这清楚地表明,尽管统计局的月度数据中没有纳入分布式光伏的发电量,但其的确为满足电力需求做出重大贡献。
清洁能源热潮继续
去年光电和风电新增发电装机容量约300吉瓦(GW),这推动了3月份碳排放量的下降。这种热潮在2024年前三个月加速,与去年相比增长了40%。
太阳能发电新增装机容量46吉瓦,同比增长36%;风电新增装机容量16吉瓦,同比增长50%。
通常来说,第一季度的新增装机容量增速一般较低,而且由于报告滞后,相当多的新增装机在年底才被报告。
强劲的同比增长表明,对新项目能否成功并网的担忧并未影响新增装机容量增加的步伐。即便今年剩下时间里增速会有所放缓,但迄今为止的数据表明,去年创纪录的增速可能会在2024年持续。
今年1月至3月,太阳能电池板产量在去年的高基数上又增长了20%,表明中国和海外的需求强劲。
电动汽车产量增长了29%,汽车总产量恢复了下降趋势,这使得电动汽车占比持续快速攀升,在第一季度达到了31%,而去年同期为26%。
由于光电和风电项目的经济效益显著,对新增装机的主要限制来自并网。因担心无法消纳新增发电量,去年多个省级电网运营商已开始限制新增光电和风电项目。
这凸显了中国电网运营上的短板,因为风电和光电占中国总发电量的份额仍然有限,仅为15%。相比之下,两者在欧盟电力系统中的占比为27%,德国、西班牙和希腊达到40%。
中国已开始采取行动解决该问题。国家发改委已开始放宽光电和风电并网的要求。这将增加风光项目投资者的不确定性,但提高了电网运营商的消纳能力,从而支持发电装机和发电量的增长。
国家发改委还发布了一项推动储能发展的政策,承诺到2027年,电力系统将能够支撑新增风光装机容量,同时将因电网问题而浪费的发电量比例保持在较低水平。
虽然光电和风电已开始满足大部分或全部用电需求的增长,但煤电投资仍在继续。第一季度,火电装机的新增速度同比略有放缓,但各省2024年的“重点项目清单”中包括超过200吉瓦的火电项目,其主要是燃煤电厂。
未来仍充满变数
中国3月份碳排放量的下降可能标志着自2020年以来碳排放的强劲增长出现了转折点。正如 Carbon Brief 去年秋天发布的一篇分析所述,目前清洁能源的增长率有可能使该国提前实现碳达峰。
因此,清洁能源增长是否会持续,是影响中国未来排放路径的关键问题。但是,外界对于未来风电和光电的发展速度仍存在很大分歧。
中国光伏行业协会在其“保守”情景中预测,2024年至2030年间年均新增装机容量为225吉瓦,比2023年的217吉瓦略有增加。在“乐观”情景下,这一数字将加速至每年280吉瓦。根据该协会预测,中国的太阳能总装机容量将从目前的660吉瓦,到2030年增加到2200至2600吉瓦。
据风电行业数据,要实现2060年碳中和目标,中国需要在2021年至2025年间每年新增超过50吉瓦的风电装机。从2026年起,每年新增装机超过60吉瓦。这是一个相对适中的轨迹,因为2023年风电新增装机容量已经达到76吉瓦。
另一方面,国家能源局局长章建华在最近一篇文章中写道,清洁能源的新增装机容量应保持在每年100吉瓦以上,但这不到2023年实际水平的一半。这意味着他认为最近的加速增长是反常的,可能难以持续。
与之类似,在国家能源局2024年的工作计划中,从总发电装机容量和非化石能源发电容量占比,可以推算出非化石能源新增装机的目标在170吉瓦左右。(尽管2023年工作计划的目标是160吉瓦,但实际新增接近300吉瓦。)
下图展现了对于光电和风电发展的不同愿景。深蓝色线代表了章建华的预期,即年新增装机容量将回落到2020年至2022年水平;浅蓝色和红色线是可再生能源行业预测的增长趋势,其大致保持在2023年的水平,或稳步增长。

到2030年,光伏行业协会和国家能源局就光电和风电的装机目标差距为1400至1800吉瓦。如果新增的清洁能源发电量在2030年能够取代煤电,那么碳排放量将比当前水平下降10至15%。到2035年,随着风电和光电进一步发展,碳排放量将比当前水平下降20至25%。
章建华在文章中指出了一些挑战,以解释为何他认为清洁能源新增发电容量水平较低,包括储能价格机制尚未健全,能源转型政策合力亟待加强,以及集中连片新能源发展用地、用海空间不足等。
尽管如此,减缓光电、风电和相关储能的新增装机速度将给中国经济泼上一盆冷水,因为这些清洁能源行业已成为经济增长的一个关键来源。
此外,最近对这些行业生产能力的大量投资,只有在清洁能源设备需求持续增长的情况下才能得到利用和回报。
政府雄心的减弱也反映在今年设定的较为保守的官方目标上。根据环保部最近设定的目标,2024年碳强度(每单位GDP的排放量)的目标降幅为3.9%。
尽管这一目标超过过去三年碳强度年均仅下降1.5%的水平,但考虑到GDP增速目标是“约5%”,该碳强度目标实际将允许碳排放量增长逾1%。
在2021年至2023年碳排放量快速增加之后,中国已经严重偏离了2025年和2030年的碳强度目标,而2024年的年度目标未能缩小这一差距。
3.9%正是实现“十四五”规划中碳排放强度下降18%的目标所需的年均下降幅度。因此,该目标避免了落后幅度进一步扩大,但对弥补迄今为止的进展滞后毫无作用。
国家发改委还设定了一个相对保守的目标,即到2024年将“化石能源强度”降低2.5%,这将允许碳排放量增加2%以上。
章建华还认为,在2026至2030年期间,清洁能源应满足70%的能源消费增长,这一目标也与清洁能源新增装机容量放缓的趋势一致。
这意味着,能源消费增长的30%仍将通过增加化石燃料的使用来满足,因此CO2排放量也将继续增加。
持续增长的碳排放量意味着中国将面临无法实现2030年的碳强度承诺的风险,而这是中国在《巴黎协定》下提交的国际气候承诺的一部分。因为假设GDP年均增长5%或更低,根据这一承诺,从2023年到2030年,能源部门的CO2排放量没有增加的空间。
因此,中国能否实现其气候承诺,取决于清洁能源增长是否会继续显著超过中央政府制定的目标,亦或是这些目标在未来是否会提高。
数据来源
本分析数据来源于中国国家统计局、国家能源局、中国电力企业联合会、中国海关官方发布的数据以及行业数据提供商WIND资讯。
电力行业煤炭消费量是根据煤炭发电量和燃煤电厂每月平均发热量来估算的,以避免官方煤炭消费量影响近期数据的问题。煤炭发电量根据火力发电总量和燃煤、燃气、生物质电厂报告容量和利用小时数计算,以得到综合火力发电数据。
当数据来自多个来源时,本文交叉引用不同来源并尽可能使用官方来源,调整总消费数控,以匹配国家统计局报告的消费增长和能源结构变化。
2024年第一季度的数据进行了调整,以匹配国家统计局初步官方数据中报告的整个季度的同比增长率。但无论有没有这种调整,三月份排放量下降的结论都成立。
二氧化碳排放量估算基于国家统计局默认的 2018 年燃料热值和中国最新国家温室气体排放清单中的排放因素。水泥二氧化碳排放基于截至 2023 年的年度估算。
对于石油消耗量,表观消耗量是根据炼油厂吞吐量计算,减去石油产品的净出口量。

The post 分析:月度碳排放量下降或表明中国已在2023年碳达峰 appeared first on Carbon Brief.
Climate Change
Palestine: Israel’s bombing has left Gaza vulnerable to climate change
Israel’s bombardment of Gaza during the conflict that broke out in October 2023 has wrecked progress towards adapting the enclave to climate change and left two million Gazans vulnerable to heatwaves, drought and disease, the Palestinian Authority (PA) said in a new climate plan submitted to the United Nations.
Palestine’s third nationally determined contribution (NDC), uploaded to the UN climate body’s website this week, says that while “the aggression on the Gaza Strip did not make the climate worse”, “it removed the housing, water and sanitation systems, health facilities, energy networks, roads and livelihoods through which people absorb a climate they were already struggling with.”
The 91-page document lists the types of infrastructure it says Israel has destroyed and notes how the destruction will worsen the impacts of climate change. It says the bombing of hospitals and rising hunger have make it harder for Gazans to cope with the health impacts of climate-driven heatwaves and waterborne diseases.
The destruction of water tanks, boreholes and desalination plants, meanwhile, have left Gazans struggling with the effects of water shortages and drought, while mass unemployment reduces people’s ability to afford climate-driven price rises. The erasure of most of the Strip’s homes makes it more difficult for people to avoid the sun’s increasing heat, the NDC said.
Many Gazans are now living in the ruins of collapsed buildings or in makeshift shelters and tents that offer little or no protection from high temperatures.
Palestine’s previous goals to cut emissions and adapt to climate change in Gaza, expressed in its last NDC five years ago, were based on a pre-war baseline that “no longer describes anything that exists”, the NDC says. Progress made since 2021 has now been destroyed, it adds.
Green reconstruction of Gaza
Instead of continuing to aim for these adaptation and emissions-reduction goals, the PA is now calling for the green reconstruction of Gaza. It says buildings should be constructed again in an energy-efficient manner with solar panels and served with modern water, waste and transport systems.
While the PA, controlled by the Fatah political party, continues to claim legitimate control of Gaza, the strip was effectively governed by Fatah’s rival Hamas between 2007 and the recent war. Control is now split between Israel and the political wing of Islamist militant group Hamas, after a US-backed ceasefire took effect in October 2025, although a UN-backed committee plans to take over.
The United Nations, European Union and World Bank have jointly estimated that Gaza needs $71.4 billion of investment in the next two years to recover and build back. This process should be Palestinian-led, they said in April.
But US President Donald Trump has said the US should “take over” and “own” Gaza and redevelop it as the “Riviera of the Middle East”. Israel’s right-wing prime minister Benjamin Netanyahu has said that Israel should control the territory with civil administration managed by Palestinians favourable to Israel.
With occupation, targets conditional
In the other part of Palestine, the West Bank, the Palestinian Authority carries out some government functions, but ultimate control rests with Israel, which has occupied the West Bank since 1967.
Because Israel controls planning in most of the West Bank, the NDC argues that the PA cannot pursue all the climate projects it wants. In addition, Israel restricts the movement of PA officials, making data collection difficult, and controls the West Bank’s electricity supply meaning that the PA cannot control whether it comes from dirty or clean sources of energy.
Given this situation, the NDC says that all of Palestine’s new climate targets are conditional but it will aim to reduce emissions 12.8% below a business-as-usual baseline by 2035 and 17.1% by 2040. If the Israeli occupation ends and Palestine regains full sovereignty over its land and resources, it will aim for reductions of 15.1% and 19.1% by 2035 and 2040 respectively under an “independence pathway”.
That could allow, for example, for greater electrification and reducing emissions per unit of growth, the document said.
To achieve the 2035 emissions-reduction target and adapt to the impacts of climate change, the PA says it needs $8.6 billion in total. This funding would be spent on measures like encouraging solar farms and rooftop solar and scaling up solar water heating to cover four-fifths of households. To complement the planned increase in solar power, the authority wants to modernise the electricity grid and install battery storage.
In the transport sector, it aims to promote the uptake of electric vehicles, develop bus rapid transit corridors and scrap old polluting trucks and buses. In Gaza in particular, it wants to deploy 66 electric buses when the conflict ends.

To adapt to climate-driven drought, the NDC includes initiatives to reuse wastewater through treatment plants, build desalination plants in Gaza to remove salt from seawater, and promote irrigation for farmers.
The new climate plan was prepared by Palestine’s Environment Quality Authority, with support from the United Nations Development Programme and the governments of Britain and Spain.
The United Nations recognised Palestine’s statehood in 2012 and it joined the UN’s climate convention and signed the Paris climate agreement – which requires countries to submit more ambitious NDCs every five years – in 2016.
The Israeli foreign ministry did not respond to a request for comment. But in late 2024, then Israeli climate envoy Gideon Behar told Climate Home News that the war and the resulting environmental destruction in Gaza was the fault of Hamas.
The post Palestine: Israel’s bombing has left Gaza vulnerable to climate change appeared first on Climate Home News.
Palestine: Israel’s bombing has left Gaza vulnerable to climate change
Climate Change
Analysis: UK solar power hits record high over summer 2026
Solar power generation in the UK reached a new record over the summer of 2026, as temperatures across the nation soared, according to new analysis by Carbon Brief.
Collectively over June, July and August, solar farms and rooftops generated 8.8 terawatt-hours (TWh) of electricity in the UK*, as shown in the chart below.

Speaking to Carbon Brief, Chris Hewett, chief executive of trade association Solar Energy UK welcomed the new record, adding that it was driven by “clear skies and continued growth in deployment”.
This surge in generation took place amid the hottest summer on record in the UK, with five heatwaves between May and August.
Summer 2026 was the sixth sunniest on record, with more than 620 hours of sunshine, according to the Met Office. England and Wales – which experienced the most extreme heat – saw their second-sunniest summers on record.
June 2026 was the hottest June in England since records began in 1884, according to Met Office data, while Wales and the UK as a whole experienced their second-warmest June.
It was the driest July for England and Wales since records began in 1836, with some parts of London seeing no rain at all in the month, while Wisley in Surrey had no rain for 62 days.
In England, temperatures peaked at 38.1C at Kew Gardens in London on 13 August.
According to the Met Office, this summer’s record mean temperature was made 130 times more likely by climate change.
Amid these hot and sunny months, solar power generation increased 23% from the same period in 2025. This is double the level of solar generation over the summer of 2021, according to Carbon Brief analysis.
While solar panels can be affected by periods of extreme heat, the longer hours of daylight and higher levels of irradiation over the summer more than offset any efficiency losses.
June, July and August all saw solar set new monthly records for solar generation – July saw the highest solar generation in a calendar month ever, with 3.3TWh meeting 15% of overall electricity demand for the month.
As of the end of August, the total UK solar generation in 2026 stood at 17TWh – 13% higher than the same point in 2025.
The number of solar farms and rooftop installations has grown substantially in recent years, helping to boost generation. Domestic rooftop solar accounts for around 29% of total capacity.
In 2025, the UK’s solar capacity reached 21 gigawatts (GW) by the third quarter of the year, according to UK government figures. This is a jump of 3GW, or 18%, year-on-year, as Carbon Brief reported in January.
(Capacity is the maximum output possible from an electricity generation, whereas generation is what was produced over a certain time period, such as a day, month or year.)
According to the University of Sheffield, the installed solar capacity is now nearly 24GW.
This includes nearly 172,000 solar installations that have been fitted across the UK since the start of 2026, according to recent government figures. In July alone, more than 19,800 rooftop solar panels were installed – the equivalent of one installation every two minutes.
In total, nearly 1.7m households in the UK now have solar panels installed.
Over 26 heatwave days this summer – periods of at least three days when temperatures exceed the Met Office’s county-level heatwave temperature threshold – UK households with rooftop solar panels avoided an estimated £86.7m in electricity costs, according to analysis by Utility Bidder.
Talking about the surge in solar generation this summer, Hewett says:
“[It] not only kept bills down for people with solar and batteries in their homes, but helped keep overall power prices much lower than they would have been if Britain had been relying on more gas generation during the day”.
Despite the record generation, no new half-hourly solar power output record was set in the summer of 2026. This still stands at 15.2 megawatts (MW) on 23 April 2026.
* This article refers to the UK throughout, but strictly relates to the island of Great Britain, made up of England, Scotland and Wales. Northern Ireland is part of the separate, all-Ireland electricity system.
related
Factcheck: 10 flaws in the Conservative report on ‘cheap power’
Q&A: What is ‘long-duration energy storage’ – and why does the UK need it?
Q&A: What does China’s 15th ‘five-year plan’ for renewables mean for climate change?
Analysis: Wind and solar power overtake fossil fuels in Germany for first time ever
The post Analysis: UK solar power hits record high over summer 2026 appeared first on Carbon Brief.
Climate Change
How this summer’s heat and drought impacted crops in Europe – in six charts
Farmers around Europe are dealing with the aftermath of a summer of extreme heat, drought and wildfires that were exacerbated by climate change.
Human-caused climate change is increasing the severity and likelihood of many extreme weather events around the world, which is increasing volatility for food producers.
This summer resulted in, for example, shrunken potatoes in the Netherlands, reduced carrot harvests in France, dried-up rice fields in Italy and scorched olive groves in parts of the Mediterranean region.
Global food prices are currently at their highest level since early 2023 due to “heatwaves and energy price dynamics”, according to the UN Food and Agriculture Organization.
Other factors such as blocked fertiliser supplies in the Strait of Hormuz and high fuel costs have also played a role in this year’s agricultural outputs.
In the six charts below, Carbon Brief provides a snapshot of the impact this summer’s extremes are considered to have had on crop production and yields across Europe.
1. Most EU countries expect to see declines in cereal production this year
2. Most countries are recording reduced crop yields
3. Around €2bn worth of cereal losses after June heatwave
4. UK yields of wheat, barley and oats are all due to drop in 2026
5. Maize production in France is due to hit a four-decade low
1. Most EU countries expect to see declines in cereal production this year

France, in particular, will see heavy losses in the amount of cereals – such as wheat, barley and oats – it produces this year, according to European Commission data.
French cereal production is expected to drop by almost 8 megatonnes (Mt) in 2026, compared to 2025.
The chart above shows that most European countries, aside from Bulgaria, will also see production losses this year.
Germany is due to see the second-largest losses in production, dropping by almost 4Mt compared to 2025.
Prof Til Feike, a cropping systems expert at the Julius Kühn-Institut, says many areas in Germany and Austria, as with other parts of Europe, have been “hit hard by a long-lasting dry period in combination with record-high heatwaves”.
This has resulted in dry grassland for animals and lower yields of maize, which is a “key fodder crop” for livestock. He tells Carbon Brief:
“In the long run, farming must adapt better to more extreme weather conditions, not only heat and drought, but also prolonged wet periods. So, there is no one-fits-all solution for climate change adaptation.”
2. Most countries are recording reduced crop yields
Heat and a lack of water have “substantially worsened” crop expectations this summer in western and most of central Europe, according to a recent bulletin from the EU Joint Research Centre.
Yields are expected to be “significantly reduced”, with local crop failures “likely” in areas such as France, southern Germany, northern and central Italy, and Hungary, it added.
The chart below shows that yields of cereal grains – which, here, refers to the tonnes of a grain grown per hectare of land – are expected to fall in most EU countries in 2026.

Slovakia, Austria and Hungary are expected to see the largest declines in cereal yields, reducing by more than one tonne per hectare in 2026 compared to 2025.
The recent EU bulletin noted that irrigated crops performed well in Portugal this summer – the country with the largest yield increases. Other crops relying on rainfall showed growing signs of heat stress, it added.
3. Around €2bn worth of cereal losses after June heatwave
The record heatwave that hit many parts of Europe in June contributed to an estimated €2-2.3bn in cumulative grain production losses, as shown in the chart below.

The intense June heat in western Europe would have been “virtually impossible” just 50 years ago, according to a rapid climate attribution study. It was the region’s hottest June on record.
The Energy & Climate Intelligence Unit (ECIU) thinktank analysed June and July 2026 grain forecasts from Coceral, a European grain traders association.
ECIU estimated lost supply by multiplying the change in tonnes of grains between these two months by prices for harvest delivery in 28 European countries.
Major grain producers France, Germany, Hungary and Spain accounted for 86% of the lost revenue, according to the ECIU.
Extreme heat is also expected to have a wider economic impact across the continent. Analysis from Triodos Bank found that this summer’s extreme weather could reduce the EU’s gross domestic product (GDP) by around 1% this year, or around €180bn.
4. UK yields of wheat, barley and oats are all due to drop in 2026
If current trends continue, the average yields for cereals and oilseeds will result in the UK’s worst harvest since detailed records began in 1984, according to ECIU.

Barley yields could fall by 15%, oats by 14% and wheat yields by 6% year-on-year, according to 2026 harvest surveys from the Agriculture and Horticulture Development Board, a non-departmental public body that provides agricultural data to the UK government.
ECIU said that, even if the situation improves, this year is still expected to be one of the five worst harvests on record. This means that four of the five worst harvests in the UK have occurred in the past decade.
Consumers will likely see higher prices and/or smaller vegetables in supermarkets as a result, Tim O’Malley, chairman of UK company Nationwide Produce, told BBC News in August.
Other crops, such as berries, have grown successfully in the extreme heat. But the Guardian noted fears this could dip later this year “as plants become exhausted from heavy cropping during the heatwave”.
5. Maize production in France is due to hit a four-decade low
France has been acutely affected by this summer’s extreme weather, with more than 7,300 excess deaths during heatwaves and a record number of weather stations recording temperatures of above 40C.
The country is the EU’s largest agricultural producer, but heat, drought and wildfires have affected many crops.
The chart below shows that maize production is set to drop by more than one-third (35%) year-on-year.

This could result in France’s lowest maize production since 1980, according to data from Agreste, the country’s agriculture ministry’s statistics service.
Due to the heat, “record-early” grape harvests have also been recorded in various parts of the nation since mid-July, reported Le Monde. In some cases, this means “smaller, less juicy grapes, which will yield less wine”, explained the newspaper.
6. Declines in EU grains since 2025

Overall in the EU, data and projections indicate declines in the output of cereal grains this year.
Cereal production is set to fall by 9% compared to 2025, according to the European Commission.
Just one year in the past decade – 2024 – recorded lower production levels.
Maize production is set to be particularly affected, with projections indicating a 13% drop, to 52Mt – the lowest level in the EU since 2007.
The post How this summer’s heat and drought impacted crops in Europe – in six charts appeared first on Carbon Brief.
How this summer’s heat and drought impacted crops in Europe – in six charts
-
Climate Change1 year ago
Guest post: Why China is still building new coal – and when it might stop
-
Greenhouse Gases2 years ago嘉宾来稿:满足中国增长的用电需求 光伏加储能“比新建煤电更实惠”
-
Greenhouse Gases1 year ago
Guest post: Why China is still building new coal – and when it might stop
-
Climate Change2 years ago嘉宾来稿:满足中国增长的用电需求 光伏加储能“比新建煤电更实惠”
-
Climate Change2 years ago
Bill Discounting Climate Change in Florida’s Energy Policy Awaits DeSantis’ Approval
-
Renewable Energy11 months agoSending Progressive Philanthropist George Soros to Prison?
-
Greenhouse Gases1 year ago
嘉宾来稿:探究火山喷发如何影响气候预测
-
Carbon Footprint2 years agoUS SEC’s Climate Disclosure Rules Spur Renewed Interest in Carbon Credits