Connect with us

Published

on

One balmy summer’s day in 2007, a trade union veteran with a Hells Angel beard and a penchant for disruption turned up at a town-hall meeting in Collie, Western Australia (WA), with the unwelcome news that the local coal industry was living on borrowed time.

“Absolutely got my head kicked in,” recalled Steve McCartney, state secretary of the Australian Manufacturing Workers’ Union (AMWU), whose no-nonsense, invective-prone manner belies a deep-seated altruism and care for those on the frontline of the energy transition. “They weren’t interested in anything I had to say. They kept reminding me there was 150 years of coal left in that hill outside town.”

Collie came into being in the 1880s after coal was discovered in the area. It soon became the heart of coal mining and coal-fired energy production in the state, and its two coal mines and three coal-fired power plants have powered the South West Interconnected System, WA’s main electricity grid, since 1931.

Today, 130 years on, coal still runs as deep through its culture as the rich seam of fossilised carbon beneath the ground, with around 1,800 of the town’s 9,000-strong population working in coal-related jobs.

But as the planet heats up and the need to move away from the main culprit – fossil fuels – becomes more urgent, this small town is a microcosm of the transformation underway in the global coal industry. As the world’s coal-producing regions grapple with how to decarbonise their economies by mid-century without devastating local communities, Collie offers a promising blueprint for a “just transition” away from coal.

Ending Australia’s coal dependence

The energy transition is set to cost nearly 1 million coal-mining jobs worldwide by 2050, and Australia is particularly exposed. The country is the world’s second-largest coal exporter, and nearly three-quarters of its electricity generation is coal-dependent – contributing over a third of its carbon emissions.


But as the country aims to shut 90% of its coal-fired power plants by 2035, Collie has successfully garnered close to A$700 million (US$445 million) in investment to help it attract new green industries, including battery energy storage, green steel, graphite processing and magnesium refining. The money will also go to retrain and repurpose the coal workforce and revitalise the town’s high street and tourist economy.

This plan, however, was not imposed from above by officials or corporate executives. Rather it is the result of a community-led, cross-sector collaboration, forged by almost two decades of painstaking struggle.

Having powered the region for over a century, Collie’s public coal-fired power plants, the Muja and Collie power stations, will gradually be switched off by 2029. That clearly threatens the future of the town’s coal mining firms, Griffin Coal and Premier Coal, and its sole private coal power station Bluewaters.

The Muja coal-fired power plant in Collie (Photo: IHRB/Oliver Gordon)

The Muja coal-fired power plant in Collie (Photo: IHRB/Oliver Gordon)

In response, the government, unions, businesses, and – most importantly – local people have jointly developed a transition plan that will support jobs, community stability and economic diversification.

“The world has no choice but to move on from coal – but coal communities like Collie need to have a renewed future that guarantees workers the support, income and opportunities they need to transition to new sustainable industries,” said Sharan Burrow, special advisor to the International Energy Agency’s Global Commission on People-Centred Clean Energy Transitions and former head of the International Trade Union Confederation (ITUC).

“Collie is a remarkable example that has all the right ingredients… It’s not a done deal yet, but it’s certainly on the right track.”

After Baku setback, activists call for ‘just transition’ to be front and centre at COP30

Anger, acceptance, action

After a decade of efforts by the likes of McCartney, Collie’s transition began in earnest in 2017 when the WA Government first announced plans to close Synergy’s Muja A and B sites. Initially, much of the community was in denial, recounted Ian Miffling, current President of the Shire (Mayor) of Collie. “People thought, ‘It won’t happen’. But gradually, it dawned on people that it was inevitable.”

Over the subsequent years, initial conversations evolved into hard plans. By the time the state government arrived to announce the staged retirement of Muja C in 2019, the town was ready for them, armed with a solid vision and principles to guide the transition.

“We wanted the town to decide its future, not the government,” McCartney explained. Residents emphasised the need for sustainable “jobs that create other jobs”, utilising the town’s long-established industrial skills – ones that wouldn’t leave future generations in the same plight. They also wanted to evolve from being a “one-job town,” recognising the vulnerabilities of relying solely on coal.

Steve McCartney, WA State Secretary of the Australian Manufacturing Workers’ Union (Photo: IHRRB/Oliver Gordon)

Steve McCartney, WA State Secretary of the Australian Manufacturing Workers’ Union (Photo: IHRRB/Oliver Gordon)

Jodie Hanns, member of WA’s Legislative Assembly for Collie-Preston, remembered the emotionally fraught task of announcing the coal-plant closure timelines alongside WA Premier Mark McGowan. “I had to stand in front of my husband, friends and neighbours and tell them their jobs at Muja power plant would have to end. It was one of the hardest days of my life.”

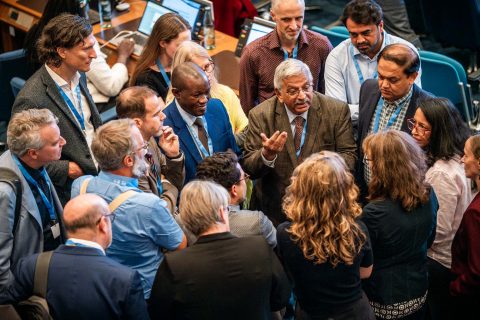
The establishment of the Just Transition Working Group (JTWG) in 2019 – and its state-run secretariat the Collie Delivery Unit (CDU) – was a pivotal moment. The JTWG brought together all the partners in the transition – the community, employers, government and unions. “We had everyone at the table,” said trade unionist McCartney. “Decisions could then be made without going back and forth to Perth.”

Sub-committees tackled specifics, from job creation to retraining, ensuring every worker had a personalised plan. “We wanted paid training to happen while people were still working, so they didn’t fall behind,” he added. “We saw what happened when Australia’s car industry transitioned: if you wait until after the closures to retrain the workers, it’s already too late.”

In 2020, the JWTG and the State Government published a Just Transition Plan for Collie built on four pillars: maximising opportunities for affected workers, diversifying the local economy, celebrating Collie’s history and promoting its future, and committing to a just transition as defined in the 2015 Paris climate agreement.



Financing the transformation

Collie’s approach has already yielded results. The WA Government has so far committed A$662 million to the cause, earmarked for retraining programmes, industrial diversification and infrastructure projects. The town will also benefit from the state’s wider A$3.8-billion renewable energy development programme, including a A$1-billion battery energy storage system (BESS) currently being constructed in Collie.

The funding support for the transition started in 2019, with the State Government committing $115 million to Collie support initiatives. As part of this, $38 million was allocated for new tourism attractions including public murals, adventure trails, redeveloping recreation sites and renovating the high street, which has since seen a surge of visitors.

In 2022, the WA Government announced that, alongside A$300 million for decommissioning Collie’s state-owned coal assets, $200m would be allocated to the Collie Industrial Transition Fund to support new large-scale industrial projects in priority sectors such as green manufacturing, minerals processing and clean energy.


Magnium’s new green magnesium pilot plant has been one of the beneficiaries. The facility produces low-carbon magnesium metal, a critical material for electric vehicles and other green technologies. It opened in January 2025, aiming for full-scale production by 2030. “We’re targeting 5% of global magnesium demand,” explained CEO Shilow Shaffier. “The full-scale facility will span 40 hectares, create over 1,000 construction jobs, and provide 400 permanent positions.”

Similarly, the Collie Battery Energy Storage System, run by state utility Synergy, will be one of the world’s largest battery systems. It will provide 500 megawatts of power with 2,000 megawatt hours of storage to the South West Interconnected System, which can power 785,000 average homes for four hours. Liz Baggetta, Synergy’s head of transition, said it offers a “great opportunity” to the company’s employees, with some already working on the project as part of their individual transition plans.

The town is pinning even greater hopes on Green Steel WA, another cornerstone of Collie’s economic diversification strategy. The company plans to build a 450,000-metric-tonne electric arc furnace, powered by renewable energy. The facility will recycle scrap steel into low-emission products, with the potential to cut 800,000 tonnes of CO2 annually compared to traditional steelmaking. The company is hoping to generate around 220 direct jobs in Collie, and hundreds more in supporting roles.

A drone shot shows Magnium’s green magnesium pilot plant, which opened in January 2025. (Credit: Bill Code)

A drone shot shows Magnium’s green magnesium pilot plant, which opened in January 2025. (Credit: Bill Code)

Tailored plans for workers

The final piece in Collie’s transition puzzle is its retraining programme. In 2022, the government announced a training support package that would expand the existing Collie Jobs and Skills Centre (JSC) to deliver a facility situated – very deliberately – in the middle of the high street to provide tailored career and training assistance to residents.

“We can’t train everyone at once – new industries are still evolving,” explained JSC manager Nat Cook. “So we adapt to meet changing needs, offering everything from resume writing to on-site consultations.”

Separately, Synergy has set up a Workforce Transition Program to provide individualised pathways for workers affected by the closure of the Muja and Collie power stations, offering retraining, redeployment, voluntary redundancy or retirement. “When the closure announcements were made, we spent six months listening to workers to understand their concerns and goals,” explained Baggetta, who heads up the programme. Based on these conversations, Synergy developed tailored plans to help employees navigate their futures.

Coal workers hold a union meeting. (Photo: IHRB/Oliver Gordon)

Coal workers hold a union meeting. (Photo: IHRB/Oliver Gordon)

And while Collie’s transition is still in its infancy, these efforts are starting to bear fruit. Maintenance workers at Griffin Coal have received a 43% pay rise, paid-time training, a 25% uplift to their redundancies, a A$30,000 retention package and the establishment of ‘work councils’. Similarly, Synergy workers have agreed wage increases of inflation plus 1.5% guaranteed until 2029, paid-time training and a three-month uplift to their redundancies.

“Just transition should change people’s lives right now, not sometime in the future; that is how you start to make the connection in a worker’s mind between climate action and their life changing for the better,” said Darcy Gunning, AMWU’s campaigns organiser.

The transition’s early successes are also filtering through to the town’s wider economy. Since 2019, Collie’s labour force has grown by 5.4%, its population by 4%, and building approvals have risen fivefold. Median house prices have surged 21% in the past year, while annual visitor numbers have also climbed.

A global blueprint?

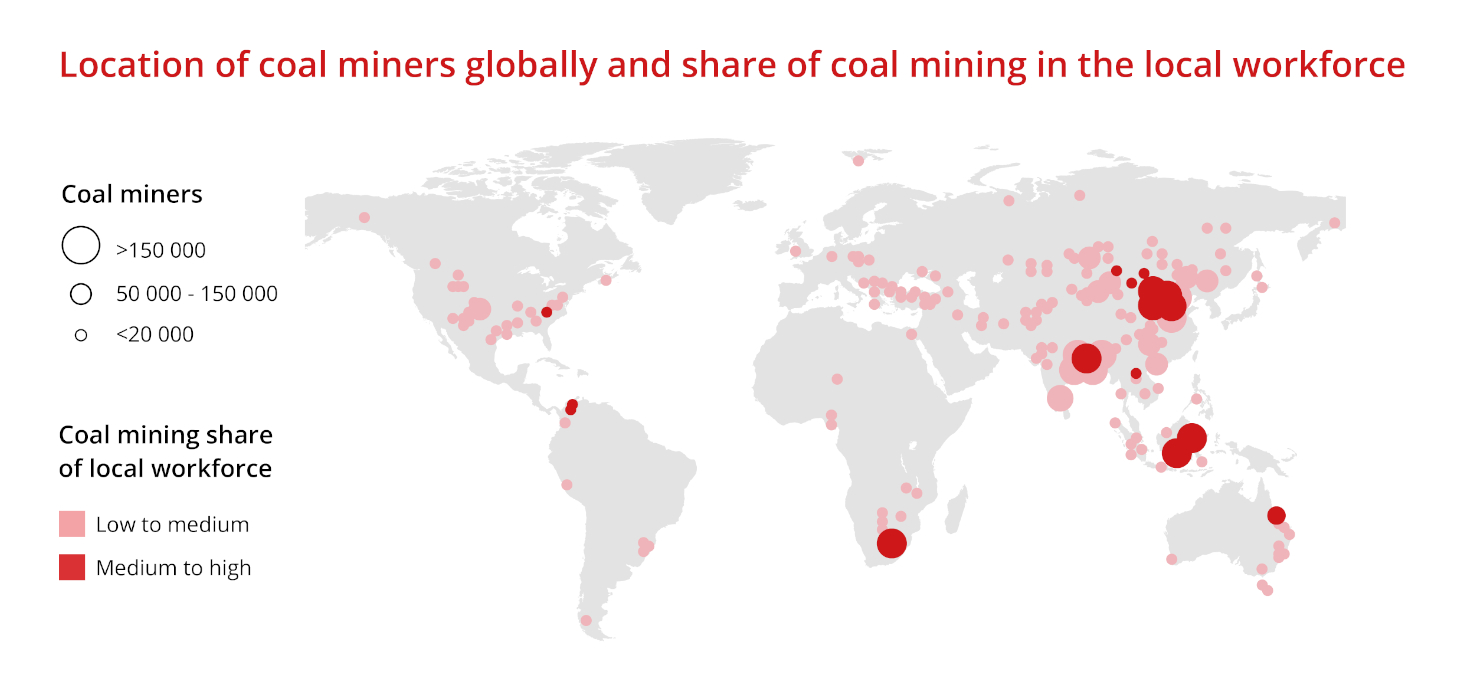
The global push toward net-zero emissions is accelerating the decline of coal, but the polluting fuel still provides 36% of the world’s electricity and supports the livelihoods of 8.4 million workers worldwide, with many regions almost entirely dependent on it to fuel their economies. For instance, the half a million coal workers of India’s Jharkhand and Chhattisgarh states, 90,000 of South Africa’s Mpumalanga province, and 80,000 in Poland’s Silesian coal basin are all staring down the barrel of their countries’ energy transitions.

Without proper transition strategies, these communities face high unemployment, social dislocation and growing inequality – the impacts of which will reverberate throughout their societies for decades to come.

Coal-reliant South African provinces falling behind on just transition

Globally, effective transition strategies are still thin on the ground, explaining why policy-makers and researchers in Australia and beyond are taking notice of Collie’s nascent success. Australia’s new Net Zero Economic Authority (NZEA) has recognised its potential as a model for other transitioning coal towns in the country. And according to mayor Miffling, the town has received enquiries about its plans from the United Arab Emirates, the US Eastern Seaboard and the Canadian province of Saskatchewan.


The Ewington coal mine near Collie (Drone shot: IHRB/Bill Code)

Rehabilitated mining land at Ewington coal mine (Photo: Oliver Gordon / IHRB)

The Ewington coal mine near Collie (Drone shot: IHRB/Bill Code)

Rehabilitated mining land at Ewington coal mine (Photo: Oliver Gordon / IHRB)

Collie has benefited from a set of unique conditions: a highly unionised workforce, historic ties to the Labor Party and state ownership of key assets like the Muja and Collie power stations. Such conditions, which enable collaboration across different economic actors, can also be found in Germany and Scandinavia, but remain rare elsewhere. “In places like in Appalachia [in the US], the absence of organised labour and political commitment often leads to disaffection and even the rise of far-right politics,” said Bradon Ellem, labour historian and co-author of a recent paper on coal transitions in WA.

Additionally, Collie’s compact size and proximity to emerging industries like green steel and renewables are a distinct advantage. Because of these specific factors, Caleb Goods, senior lecturer of management and employment relations at the University of Western Australia (UWA) Business School, and a leading expert on labour and energy transitions, believes the model’s replicability will be limited.

Large and more dispersed coal regions like Appalachia and Poland’s coal basin will find it much tougher to create enough new jobs and infrastructure, he said. “Even in Collie, bridge transition opportunities are only beginning to emerge,” he noted. “Reaching the finish line, where a community has secure, green job opportunities, is an incredibly hard task – and one that will look different for every region.”

Nonetheless, Goods praised Collie’s approach as a leading example of a “progressive and dynamic” consultation process that prioritises the voices of workers. “Not all are enthusiastic about the transition; some are sceptical or see coal as part of the town’s future. But they recognise the transition’s value for their children and the community,” he explained.

Union veteran McCartney knows how hard it is to get them onside, but is convinced there is no other route to success.

“If we don’t empower local people when we’re trying to create wholesale change inside their communities, then we’re in the wrong game,” he said.

This is an abridged version of original reporting by Oliver Gordon for JUST Stories – a global project from the Institute for Human Rights and Business dedicated to finding and telling stories of people working together to advance just transitions.

The post This Australian coal community is co-designing its own green future appeared first on Climate Home News.

This Australian coal community is co-designing its own green future

Continue Reading

Climate Change

Factcheck: No, Europe’s heatwaves are not being ‘caused’ by declining air pollution

Published

on

This summer has seen Europe suffer through a series of record-breaking heatwaves.

Amid widespread media coverage of the number of deaths and the influence of climate change, the UK’s Daily Telegraph reported on new research with the incorrect headline: “Heatwaves caused by fall in pollution.”

The article was shared on social media by Richard Tice – deputy leader of the hard-right, climate-sceptic Reform UK party – along with a number of prominent rightwing commentators.

Tice claimed that “net stupid zero is contributing to rising temperatures, not helping”, adding that “we have been gaslit and lied to”.

GB News followed up with its own article, incorrectly headlined: “Britain’s scorching heatwaves caused by falling pollution levels, researchers find.”

Scientists tell Carbon Brief that the framing of heatwaves being “caused” by declining air pollution is “wrong”.

While a drop in pollution has reduced the cooling impact it has had in the past, the scientists say, Europe’s summer heatwaves are primarily becoming more extreme “as a result of greenhouse-gas-induced warming”.

Another scientist adds that “any attempt” to link this research to net-zero policies is “simply wrong”.

Fast warming

The extensive reporting around Europe’s heatwaves in recent months has often mentioned that Europe is the world’s fastest-warming continent.

Europe has warmed rapidly since the 1980s

The new study in question aims to unpack why Europe’s summer temperatures are rising more quickly than other regions of the northern hemisphere’s mid and high latitudes.

The research – published in Geophysical Research Letters – explores the role of air pollution and, specifically, how it affects circulation patterns in the atmosphere.

(The study focuses on long-term trends in European summers and does not include the very recent heatwaves.)

Human-caused emissions of aerosols – tiny, light‑scattering particles produced mainly by burning fossil fuels – have long acted to “mask” global warming. This is largely because they absorb or reflect incoming sunlight and influence the formation and brightness of clouds.

To understand how the climate of Europe – or any region – is changing, scientists need to take into account a whole range of factors, says Prof Bjørn Samset, a research professor at Norway’s Center for International Climate Research (CICERO), who was not involved in the work.

This includes “greenhouse gases, aerosols, land-use change, natural variability and how they all interact”, he says, adding:

“The effects of air pollution on circulation, which is the topic here, has long been difficult to pin down.”

As European countries improved their air quality through the second half of the 20th century, the cooling effect of aerosols has gradually been removed.

This can boost heatwaves in two ways – directly, by letting more sunlight reach the land surface and, indirectly, by influencing the jet stream.

Using hundreds of simulations from nine climate models, the new study finds that a decline in aerosols is resulting in more frequent “quasi-stationary Rossby waves”.

Rossby waves are huge meanders in the jet stream. Occasionally, they become slow-moving – or “quasi-stationary” – which allows weather systems to get stuck over one region, leading to prolonged heatwaves.

These circulation changes have contributed to Europe’s rapidly warming summers.

However, while Europe’s heatwaves are being influenced by declining aerosols, it is “wrong” to say they are being “caused” by them, says Prof Erich Fischer, a climate scientist at ETH Zurich.

Headline in the Daily Telegraph, 22 July 2026.

Fischer, who was not involved in the study, tells Carbon Brief:

“Heatwaves are caused by high-pressure systems and are now much more frequent and intense because they are happening in a climate that is much warmer than 100 years ago as a result of greenhouse-gas-induced warming.

“The paper shows that the greenhouse-gas-induced summer warming had been temporarily masked by air-polluting aerosols. The full extent for European summers only becomes visible now as the air-polluting aerosols have declined.”

Samset adds:

“Air pollution never causes or removes global warming, it only temporarily moderates it.”

Study lead author Dr Pedro Roldán‐Gómez, an associate researcher at the Barcelona Supercomputer Centre, is quoted in the Daily Telegraph saying that “most” of the “excess warming” in Europe, beyond that of comparable regions in the northern hemisphere, can be linked to declining aerosols.

But, earlier in the article, the newspaper interprets this as, simply, “most of the extra heat experienced in Britain and Europe” is down to air pollution.

GB News uses a similar phrasing, reporting that “much of the additional warming across Britain and western Europe since the 1980s is linked to the sharp decline in airborne particles known as aerosols”.

This is “misleading”, says Fischer, while Roldan-Gomez tells Carbon Brief that this is a “tricky point”, which “could lead to wrong interpretations if not properly explained”. He adds:

“The contribution of greenhouse gases is, in any case, the most important factor.”

Headline on GB News, 23 July 2026.

Cleaner air

The Daily Telegraph’s article was seized upon by Reform’s Richard Tice to claim that “cleaner air” was causing higher temperatures, rather than CO2.

This continued his position – refuted by long-established climate science – that CO2 does not drive global warming.

Richard Tice on X on 23 July 2026

Tice also claimed in his post that net-zero policies are “contributing to rising temperatures”. Tice appears to be linking declining air pollution to a shift from fossil fuels to renewable energy.

Samset points out that net-zero became a goal “decades later” than the cumulative efforts to reduce air pollution since the 1980s and that it is “simply wrong” to link it to the study.

“The scientific community will keep working to understand how greenhouse gas warming and air pollution interact,” he says, but “nothing we do will change the fact that the consequences of global warming are due to human-induced CO2 emissions”.

Fischer adds:

“Let us not forget that cleaning up air-polluting aerosols is highly desirable. According to the World Health Organisation, 7 million people still die prematurely every year due to air pollution.”

Clean air legislation

Finally, the Daily Telegraph article and the study itself both attribute Europe’s declining air pollution from the 1980s onwards to the Montreal Protocol.

This is a “glaring error”, Samset says, and it is “surprising that it wasn’t picked up” in the peer-review process for the study. He explains:

“The Montreal Protocol did not deal with air pollution. It dealt with ozone-depleting gases and has been an extremely successful multi-national effort against environmental damage. “

Clean air legislation was already in place in many European countries by the time the Montreal Protocol was signed in 1987, says Samset.

In response, Roldán‐Gómez says that while the protocol did not target aerosols specifically, it “boosted the clean air policies”.

The post Factcheck: No, Europe’s heatwaves are not being ‘caused’ by declining air pollution appeared first on Carbon Brief.

Factcheck: No, Europe’s heatwaves are not being ‘caused’ by declining air pollution

Continue Reading

Climate Change

Access to finance ‘strengthens climate resilience’ among sub-Saharan women

Published

on

Empowering women through greater access to finance could “strengthen” households’ resilience to “climate shocks”, according to a new study.

Published in Climate Risk Management, it analyses the impact of financial access on “women-headed households” in sub-Saharan Africa.

The study finds that where women had formal financial access – such as through owning a bank account – households were more able to withstand short-term shocks.

It adds that “climate shocks”, such as extreme weather events and the impacts of climate change, can cause economic crises, which destabilise communities and households.

However, the authors say that in order to protect households from long-term climate vulnerabilities – including “droughts, floods and sea-level rise” – financial access would need to be paired with wider efforts to tackle gender inequality.

They add that the findings could have important implications for policy in sub-Saharan Africa, where many countries and households are vulnerable to climate disasters.

Financial inclusion

The study highlights that entrenched gender disparities mean many women still have unequal access to financial services in sub-Saharan Africa

For example, women are still less likely to have their own bank accounts and instead are often dependent on male relatives for access to finance.

The number of women with access to an account in the region had risen to 52% as of 2024, according to data from World Bank Group.

However, as shown in the chart below, the gap between men and women has also increased, rising from just under 5 percentage points in 2011 to 12 in 2024.

Chart showing that more sub-Saharan women now have bank accounts, but the gap to men has widened from 2011-2024
Share of population with bank accounts by gender over 2011-2024, %. Source: Global Findex Database, World Bank Group

Using survey data from Afrobarometer, the new study analyses 25,511 women-headed households across 37 sub-Saharan countries.

The authors use the Organisation for Economic Co-operation and Development’s (OECD) framework to measure “financial inclusion”. This looks at factors such as having a bank account, owning a mobile phone and having internet access.

Francis Anaisie, a co-author on the study, tells Carbon Brief the researchers were motivated by the UN’s sustainable development goals (SDGs). Anaisie, an economist at the University of Cape Coast, Ghana, says the study specifically looked at SDGs five and 13, on gender equality and addressing climate issues. He adds:

“Financial inclusion is one of the key policy tools for empowering women or for empowerment. But as to whether this actually translates into better climate outcomes for women is not known or is limited; this study seeks to address that gap.”

The study finds households with higher levels of financial access for women had higher levels of women’s empowerment, when this is defined as the ability to make choices and have control over economic and social outcomes.

This was checked by cross-comparing financial access against different measures of women’s empowerment, such as financial security, voting rights and connection to communities.

In particular, the study found that “financially included” women had greater political and economic empowerment, such as financial security and voting rights. On some measures of social empowerment, however, the link was weaker – financial access alone was not enough to erase cultural and social barriers to gender equality.

Women and climate change

It has been well documented that women are more vulnerable to the impacts of climate change than men.

Environmental shocks affect women disproportionately due to a range of factors. These include income disparities, higher rates of displacement and unequal access to land.

Financial inequality and barriers to economic resources, such as needing internet access to make digital payments, play a key role in climate vulnerability, says Tracy Kajumba. She is director for the Least Developed Countries initiative for Effective Adaptation and Resilience (LIFE-AR) interim secretariat at the International Institute for Environment and Development (IIED).

Kajumba, who was not involved in the study, explains to Carbon Brief:

“Women are on the front line doing farming, planting, harvesting and these things that are all impacted [by climate change]. If they don’t have the income to invest either in drought-resistant crops or water-saving technologies, it becomes difficult for households to adapt.”

Calculating climate resilience

The new study measures the impact of financial inclusion on women’s empowerment and, in turn, on climate resilience.

It evaluates a household’s ability to withstand and recover from “shocks and stressors” by using a UN Food and Agriculture Organization metric for “resilience index measurement and analysis” (RIMA).

For example, questionnaires are used to gather information about households in certain areas. The data is then used, together with key indicators, to quantify a household’s resilience to food insecurity, climate variability and economic crisis, amongst other risks.

The 25,511 households surveyed across sub-Saharan Africa were found to be relatively resilient overall and had a high capacity to bounce back from climate shocks. However, they had much lower ability to adapt, in order to build protective capacity in advance of extreme events.

In addition, the study finds that women’s financial empowerment had a positive impact on a household’s ability to “absorb” a climate shock, suggesting that financial access is critical for responding to climate change.

Community garden and climate adaption project, focusing on women's empowerment, Niger.
Community garden and climate adaption project, focusing on women’s empowerment, Niger. Credit: Joerg Boethling / Alamy Stock Photo

Increased empowerment through financial access enables women to make decisions about planting crops, to access credit in emergencies and to buy or sell food at a better price, the study notes.

For example, it says increased financial access and women’s empowerment help households to deal with the immediate consequences of an extreme weather event, such as a drought. This could be through building community mutual-support networks and by enabling access to savings, to keep the household running.

Anaisie says the study shows women’s empowerment has a significant impact on climate resilience. He tells Carbon Brief:

“If we include women in the financial system, in the case of any climate issue they can save, they can be independent, they can rely on investment to absorb these shocks. This empowerment will help them to be more resilient to climate shocks…We can make progress because SDG goals are all about inclusiveness. It’s all about inclusive growth.”

However, the study notes that financial access does not necessarily create long-term change, which would make the household less vulnerable to extreme weather in the first place.

The authors suggest that lasting structural and cultural change is important for bringing about long-term resilience. They say that policies to address gender inequalities would help bring this about.

They say such policies could include gender-sensitive agricultural credit schemes, subsidised climate insurance for women farmers in drought-prone regions, joint land-titling programmes and quotas for women in local climate-adaptation committees.

Such policies would have helped women impacted by recent severe floods in Ghana to protect their savings, Anaisie explains. He tells Carbon Brief: 

“Women are engaged in economic activities, especially informal activities. They have resources and money, but when the flood came in, many women lost that. If they had access to insurance, this flood wouldn’t have cost them that much.

“So, if the government comes out with financial initiatives, training, civic education and gender-focused initiatives, leadership training, women will be empowered and this will translate into their resilience with regards to climate change.”

Addressing climate vulnerability in sub-Saharan Africa

The study could have policy implications for sub-Saharan Africa, a region particularly vulnerable to the effects of climate change. The region faces increasingly extreme weather, heatwaves, droughts, wildfires and floods, as well as food scarcity and threats to crops.

The study suggests that policies to address structural and cultural barriers to women’s financial autonomy could be a key way to build climate resilience across the region.

However, it recognises that even where financial access is expanded, gender norms and cultural constraints continue to shape women’s social empowerment. This, in turn, affects their ability to adapt to climate change in the long term.

Ultimately, addressing structural inequalities is needed to minimise climate vulnerability, says Kajumba. She adds that supporting adaptation with financial access can allow households to absorb shocks without falling into poverty – and to rebuild after climate impacts.

Kajumba says that supporting adaptation with women’s financial access can allow households to absorb shocks without falling into poverty – and to rebuild after climate impacts. She adds:

“When they are supported [with] microloans, savings and all that, you will see change in income, change in households, change in health and education for the children as well.”

However, Kajumba notes that structural inequalities still “amplify” women’s vulnerability to climate impacts and make it harder for them to exercise agency and leadership. She adds:

“The tools that are being used are not always favourable for women…When we look at women in leadership and participation, you cannot lead or you cannot participate unless you have some level of income.”

The post Access to finance ‘strengthens climate resilience’ among sub-Saharan women appeared first on Carbon Brief.

Access to finance ‘strengthens climate resilience’ among sub-Saharan women

Continue Reading

Climate Change

State of the climate: Rapidly developing El Niño raises chance of record-warm 2026

Published

on

As 2026 passes its halfway point, the world is watching one of the most rapidly intensifying El Niño events in the modern record take shape in the tropical Pacific.

The developing El Niño is boosting expectations for global temperatures, both this year and next.

El Niño is the warm phase of a recurring climate pattern in the tropical Pacific that releases heat from the ocean into the atmosphere, temporarily raising global temperatures and reshaping rainfall and extreme weather around the world.

Carbon Brief’s “state of the climate” report in April gave 2026 a 19% chance of setting a new global temperature record.

That chance now stands at 35% – a near-doubling in four months – with virtually all of the change driven by ever-stronger El Niño forecasts.

The key findings from the first half of 2026 include:

  • The first six months of 2026 were the third-warmest start to a year on record – around 1.4C above pre-industrial levels – behind only 2024 and 2025. 
  • While the first few months of the year came in as the fourth or fifth warmest, both May and June were the second-warmest ever recorded as El Niño conditions took hold.
  • El Niño conditions arrived in April and reached the threshold for a “strong” event by June, when the Niño3.4 index reached 1.6C. Of the 667 model runs Carbon Brief examined, 91% project a peak later this year that is above the strongest El Niño in history.
  • The chance that 2026 beats 2024 as the warmest year on record has risen to 35%. Carbon Brief’s central estimate remains that 2026 will be the second-warmest year, at around 1.51C above pre-industrial levels.
  • Whether 2026 sets a record will depend on the dataset: the odds range from around two-in-three in NASA and Berkeley Earth data to around two-in-10 in ERA5 and one-in-10 in the JRA-3Q reanalyses.
  • June 2026 was western Europe’s hottest June on record, amid a heatwave that set hundreds of individual records. Nearly 9% of the world’s surface saw record June warmth.
  • The developing El Niño will have its largest impact on 2027, which Carbon Brief projects to be around 1.7C above pre-industrial levels – this would comfortably set a new record for the warmest year.
  • Arctic sea ice has spent 39 days of 2026 so far at, or below, record daily lows following its joint-lowest winter maximum in the satellite era.

Third-warmest start to a year

Carbon Brief analyses records from six different groups that report global surface temperatures: NASA GISTEMP, NOAA GlobalTemp, Hadley/UEA HadCRUT5, Berkeley Earth, Copernicus/ECMWF ERA5 and the JMA JRA-3Q reanalysis.

The first half of 2026 was the third warmest on record in every one of the six datasets, behind only 2024 and 2025. The figure below shows annual temperatures since 1970, along with the 2026 year-to-date average (January-June) for each group.

Chart showing that the first half of 2026 was the third warmest on record
Annual global average surface temperatures from the six groups (lines), along with 2026 temperatures so far (January-June, coloured dots). Note that HadCRUT5 and ERA5 dots reflect January-May, as their June values were not yet published. Chart by Carbon Brief.

January 2026 was only the fourth- or fifth-warmest January on record, as lingering weak La Niña conditions suppressed temperatures. Since then, each month has climbed the rankings.

La Niña is the cool phase of the El Niño-Southern Oscillation (ENSO). It typically brings wetter conditions to Australia, Indonesia and equatorial South America and drier conditions to the southern US.

March was second-to-fourth warmest across datasets, April the third and both May and June were the second warmest ever recorded, behind only the corresponding months of 2024.

The chart below shows how June 2026 (thick red line) came in around 0.08C below the June record set in 2024 in the average of the six datasets.

Meanwhile, Copernicus reported that global sea surface temperatures over the ice-free oceans set a new June record.

Chart showing that 2026 saw the second-warmest June on record
Average global surface temperatures for each month from 1940 to June 2028 from six forecasting groups, with lines coloured by decade. Chart by Carbon Brief.

A record-breaking El Niño

ENSO is the largest source of year-to-year variability in global temperatures.

The most common way to assess the strength of an El Niño or La Niña event is by looking at the sea surface temperature anomaly in the “Niño3.4” region of the tropical Pacific.

El Niño and its sister La Niña occur when temperatures in the tropical Pacific are more than 0.5C (El Niño) or less than 0.5C (La Niña) below normal, where normal is defined by removing the effects of long-term climate change.

The thresholds for defining the strength of an El Niño or La Niña are above/below 1C for “moderate” events, 1.5C for “strong” events and 2C for “very strong” (or “super”) events.

After two years dominated by La Niña conditions, the tropical Pacific flipped decisively in April when the Niño3.4 index crossed the 0.5C El Niño threshold. It subsequently reached 1C in May and hit 1.6C in June, marking one of the fastest onsets in the observational record.

In the first few weeks of July, the index shot above 2C, significantly outpacing the speed at which any prior El Niño events developed.

Forecast models expect even more to come.

An analysis by Carbon Brief of the median of 667 model runs from 14 different modelling groups suggests that sea surface temperatures in theNiño3.4 region could peak at 3.59C between July and December.

More than 91% of runs predict the strongest El Niño event in the modern record. The previous record was set during the event of 2015-16, when temperatures peaked around 2.75C.

This is shown in the chart below, which features a histogram of the likelihood of different possible 2026 El Niño peaks across all the models on the top. The forest plot beneath shows the best estimate and range of outcomes predicted by each individual model.

Chart showing that El Niño is on track to set a new record in 2026
Top panel: Model-weighted distribution of each member’s peak Jul-Dec 2026 Niño3.4 anomaly (red bars), with the dotted yellow line indicating the weighted median (+3.6C) and the dotted blue line the prior record peak (2015-16, 2.75C). Bottom panel: median and 10th-90th percentile peak for each modelling group, with its typical peak month. The figure includes 667 model runs from 14 different modelling groups (from the CFS, NMME, C3S, CanSIPS and SINTEX-F systems). Chart by Carbon Brief.

The median forecast in every one of the 14 models suggests a peak that exceeds the 2C “super” El Niño threshold, with most models peaking in November or December.

Some caution here is warranted, however. Raw model Niño3.4 anomalies are measured against a fixed climatology. Because the entire tropical ocean has warmed due to human-caused greenhouse gas emissions, the models tend to overstate event strength relative to the historical record.

A cleaner comparison uses the relative Niño3.4 index (RONI), which subtracts the average tropical ocean warming.

This relative measure suggests the median forecast peak for El Niño in the latter half of 2026 is 3.1C. The prior record stands at a lower 2.69C, set in 1982-83.

Nevertheless, 77% of model runs still show a new record event occurring. This is shown in the chart below.

Chart showing that El Niño is on track to set a new record in 2026, even once warming is fully accounted for
Top panel: Model-weighted distribution of each member’s peak Jul-Dec 2026 RONI (red bars), with the dotted yellow line indicating the weighted median (+3.1C) and the dotted blue line the prior record peak (1982-83, 2.69C). Bottom panel: median and 10th-90th percentile peak for each modelling group, with its typical peak month. The figure includes 667 model runs from 14 different modelling groups (from the CFS, NMME, C3S, CanSIPS and SINTEX-F systems). Chart by Carbon Brief.

In summary, on both indexes, the central expectation is now for the strongest El Niño in the observational record.

Model forecasts made in the spring and early summer have historically shown some bias toward overpredicting event strength. However, forecasts made after the spring are considerably more reliable.

Widespread record warmth and a massive European heatwave

The map below shows the temperature anomaly for the first half of 2026 in the ERA5 dataset, relative to a 1981-2010 baseline period.

Global map showing global mean surface temperatures for January-June 2026 compared to a 1981-2010 baseline, using data from ERA5.
Global mean surface temperatures for January-June 2026 compared to a 1981-2010 baseline, using data from ERA5.

It shows how the largest warm anomalies were found across the Arctic – particularly north of Scandinavia and Svalbard – as well as western Europe, the western US, northern Mexico, central Asia, western China, eastern Russia and the Antarctic Peninsula region.

The developing El Niño is clearly visible as a tongue of warm anomalies stretching along the equatorial eastern Pacific. Only a few regions – central Canada, Alaska and parts of the Southern Ocean – saw temperatures below the 1981-2010 average.

Where 2026 ranks against history is even more striking. The map below shows where the period of January-June 2026 ranked among all 87 years in the ERA5 record, which stretches from 1940 to 2026. Grid cells marked in red saw temperatures in the first half of the year that were in the top-five warmest years.

Global map showing January-June 2026 per-gridcell ranks in ERA5.
January-June 2026 per-gridcell ranks in ERA5. 30% of the global surface saw a top-five warmest first half of the year; 7.1% saw record warmth. No areas (0.0%) saw top-five cold.

More than 30% of the global surface had a top-five warmest start to the year and 7.1% saw its warmest on record, including much of western Europe, the eastern equatorial Pacific and the seas around Japan.

Not a single grid cell had a top-five coolest start to the year. In June alone, 8.9% of the world’s surface saw record warmth for the month. This is illustrated in the map below, where grid cells marked in red saw temperatures that were in the top-five warmest years and grid cells in blue in the top-five coolest.

Global map showing June 2026 per-gridcell ranks in ERA5.
June 2026 per-gridcell ranks in ERA5.

The standout regional temperature event was a heatwave that struck Europe in late June.

Western Europe had its hottest June on record, recording an average temperature of 3.05C above the 1991-2020 average and beating the record set only a year earlier, according to Copernicus. A heat dome over 22-30 June broke 10 all-time national heat records and around 400 long-record station records.

France set a new June national record of 44.3C, while the UK broke its June record on three consecutive days, reaching 37.3C. The humid heat drove a death toll estimated in the thousands.

A separate heat dome also brought record June temperatures to parts of North America in late June.

On track to be second warmest, but a real chance at first

Carbon Brief’s updated projection for 2026 as a whole combines the observed January-June temperatures with the latest El Niño forecast. It uses a statistical model trained on the historical relationship between the first half of the year, ENSO conditions and annual temperatures observed over 1950-2025, excluding major volcanic eruption years.

Carbon Brief estimates that 2026 will be around 1.51C above pre-industrial levels, with a 90% range of 1.45C to 1.57C, shown by the yellow dot in the chart below.

This is up from 1.47C in the projection set out in April – and is notably more certain now that half the year has passed.

This central estimate would make 2026 the second-warmest year on record, just below 2024 (1.52C) and ahead of 2023 (1.43C) and 2025 (1.41C).

Chart showing that 2026 is on track to be the warmest or second-warmest year
Annual composite temperatures over 1970-2025, the 2026 year-to-date value (January-June, red dot), and Carbon Brief’s 2026 annual estimate (yellow dot with the 5th to 95th percentile range). Chart by Carbon Brief.

Carbon Brief’s modelling puts the chance that 2026 beats 2024 as the warmest year on record at 35%, using the average of the six different surface temperature records assessed. It puts the chance that 2026 comes in above 1.5C at around 63%.

If it does, 2026 would be the second calendar year – after 2024 – where warming averaged above 1.5C, in a further sign that the world is rapidly approaching the Paris Agreement’s 1.5C limit.

A single year above 1.5C does not by itself constitute a breach of the goal, which refers to the longer term average temperature of the planet. This is defined as the midpoint of a 20-year period by the Intergovernmental Panel on Climate Change (IPCC).

These likelihood of a record have been climbing rapidly throughout 2026.

Global temperatures so far throughout the year have run well below the record-setting levels of 2024 – around 0.13C cooler over the first six months.

On their own, temperatures observed so far in 2026 would make a new annual record unlikely.

However, rerunning the projection using only the data available at the end of each month since March – including both the year-to-date observations and the El Niño forecast issued that month – shows a shifting picture.

Using March data, 2026 had just a 7% chance of setting a new record. That rose to 16% in April, 24% in May, 27% in June and 35% using the latest data in mid-July.

This is shown in the chart below.

Chart showing that the chances of a record-warm 2026 have risen five-fold since March
Columns show the probability that 2026 exceeds 2024 as the warmest year on record, based on data available at the end of each month; the line shows the corresponding forecast of July-December ENSO conditions (relative Niño3.4 index). Chart by Carbon Brief.

Notably, this rise has little to do with observed temperatures. The year-to-date anomaly has actually drifted slightly down, from 1.41C after March to 1.39C after June.

Observed temperatures and fewer remaining months of the year contributed only around four percentage points of the 28-point rise in the likelihood; the remaining ~84% of the change comes from successive upward revisions to the El Niño forecast for late 2026.

However, whether 2026 ends up becoming the warmest year on record may end up depending on which dataset is used.

Running the same projection gives odds of a 2026 record of around two-in-three for Berkeley Earth (66%) and NASA GISTEMP (65%), but only 35% for HadCRUT5, 24% for NOAA and just 13% and 9% for the ERA5 and JRA-3Q reanalyses, respectively.

This is shown below.

Six charts showing observed annual temperatures for 2026 and the projections for each dataset
Observed annual temperatures since 1990, with each dataset’s own 2024 record (dashed line) and the 2026 projection (median, 25-75% bar and 5-95% whisker), with the per-dataset chance of a 2026 record in each panel’s title. Chart by Carbon Brief.

The divergence between projections mostly reflects how exceptional each dataset’s 2024 was.

The reanalysis approaches recorded a particularly warm 2024, leaving 2026 more ground to make up. GISTEMP and Berkeley, on the other hand, project 2026 modestly above their 2024 values.

A repeat of the situation in 2015 where different groups disagreed on record rankings is a real possibility. Headlines in January 2027 may hinge on choices of dataset.

2027 likely to be the warmest year in human history

The biggest climate story of the developing super El Niño may not be 2026 at all.

Global temperatures typically lag in the tropical Pacific by around three months. So, an El Niño event peaking in November and December 2026 will have its largest warming influence on 2027.

We saw this same pattern occur in 1997-98, 2015-16 and 2023-24 – where the year in which the El Niño developed was warm, but the following year was record-smashing.

Carbon Brief has extended its projection into 2027 by using the historical relationship between year-over-year temperature changes and ENSO conditions in the preceding autumn.

This yields a best estimate for 2027 of around 1.71C above pre-industrial levels, with a 90% range of 1.49C to 1.93C. This is shown by a yellow square on the chart below.

Chart showing that 2027 is likely to set a new global temperature record
Observed annual composite temperatures 1970-2025 and Carbon Brief’s projections for 2026 and 2027 (medians and 5th to 95th percentile ranges). Chart by Carbon Brief.

That would give 2027 a 92% chance of setting a new global temperature record and a 94% chance of exceeding 1.5C.

Taking 2026 and 2027 together, there is a 93% chance that at least one of the two years sets a new record.

The 2027 estimate is more uncertain than the 2026 one. As with 2026, there are uncertainties in the projection due to unknowns around exactly how strong the El Niño peak proves to be and how quickly it decays.

However, even the low end of the 2027 range would put it among the warmest years on record and the central estimate of 1.71C would exceed 2024 by nearly 0.2C.

If these projections bear out, the 2020s will have delivered new global temperature records in 2023, 2024 and 2027 – and potentially 2026 too – with a number of individual years well above the 1.5C threshold.

The long-term warming trend, driven by human emissions of carbon dioxide and other greenhouse gases, has increased from around 0.18C per decade in the early 2000s to around 0.27C per decade today. El Niño and La Niña play a big role in determining which years along that rising path stand out as records.

Arctic sea ice at record lows

Arctic sea ice has spent much of 2026 in record-low territory.

Following the joint-lowest winter maximum in the satellite record in mid-March, daily extent has set or tied record lows for the date on 39 days so far this year, including extended spells in mid-to-late March and in early-to-mid June.

The most recent record-low days were in early July.

The chart below shows how Arctic sea ice in 2026 (dark red line) has been below the historical range (shaded red).

It also shows how Antarctic sea ice (dark blue), meanwhile, has remained below the 1979-2010 range for almost all of 2026 to date.

Chart showing that Arctic sea ice has been at a record low for most of 2026
Daily 2026 sea ice extent (bold lines) compared to the 1979-2010 historical range (shaded) and the record daily low from any prior year (dotted). Chart by Carbon Brief using data from NSIDC

As of mid-July, Arctic extent is a bit below the 1979-2010 historical range for the date, though it remains around 0.6m square kilometres (km2) larger than the record low for the date set during 2020’s exceptional summer melt season.

The trajectory over the coming two months will determine whether 2026 challenges 2012’s record September minimum. Early-summer conditions are a poor predictor of the September minimum, which depends heavily on summer weather.

Antarctic sea ice, meanwhile, is currently around 300,000km2 below the historical envelope, but has stayed well clear of the record lows set in 2023 and has not set any new daily records yet this year.

The post State of the climate: Rapidly developing El Niño raises chance of record-warm 2026 appeared first on Carbon Brief.

State of the climate: Rapidly developing El Niño raises chance of record-warm 2026

Continue Reading

Trending

Copyright © 2022 BreakingClimateChange.com