
Carbon tends to sit at the forefront of climate considerations, but there’s another important, interconnected piece of the sustainability puzzle that often gets overlooked: water.
Globally, 4 billion people face severe water scarcity for at least one month out of every year, according to the United Nations University Institute for Water, Environment and Health (UNU-INWEH).
Like with global warming, human activities have had a major impact on water systems. Not only are we often using too much water, but issues like land use change and rising temperatures also stress freshwater ecosystems and the water cycle.
If we ignore these issues, more water systems will be permanently damaged. That likely means more people will live with insufficient access to clean water, agricultural production will become more difficult and expensive, and many businesses will face economic risks, like supply chain delays and shortages.
Fortunately, there are ways to reduce water risks and even improve water systems.
One option is to purchase water credits. Similar to how carbon credits emerged as a solution for offsetting hard-to-avoid greenhouse gas emissions, water credits provide a market-based solution for conserving and restoring water systems.
Here, we’ll take a deeper dive into:
- What are Water Credits?
- How do Water Credit Projects Work?
- Water Credit Project Types and Examples
- Benefits of Water Credits
- Why Individuals and Businesses Should Buy Water Credits
What Are Water Credits?
If you’re familiar with carbon credits, you already get the gist of water credits.
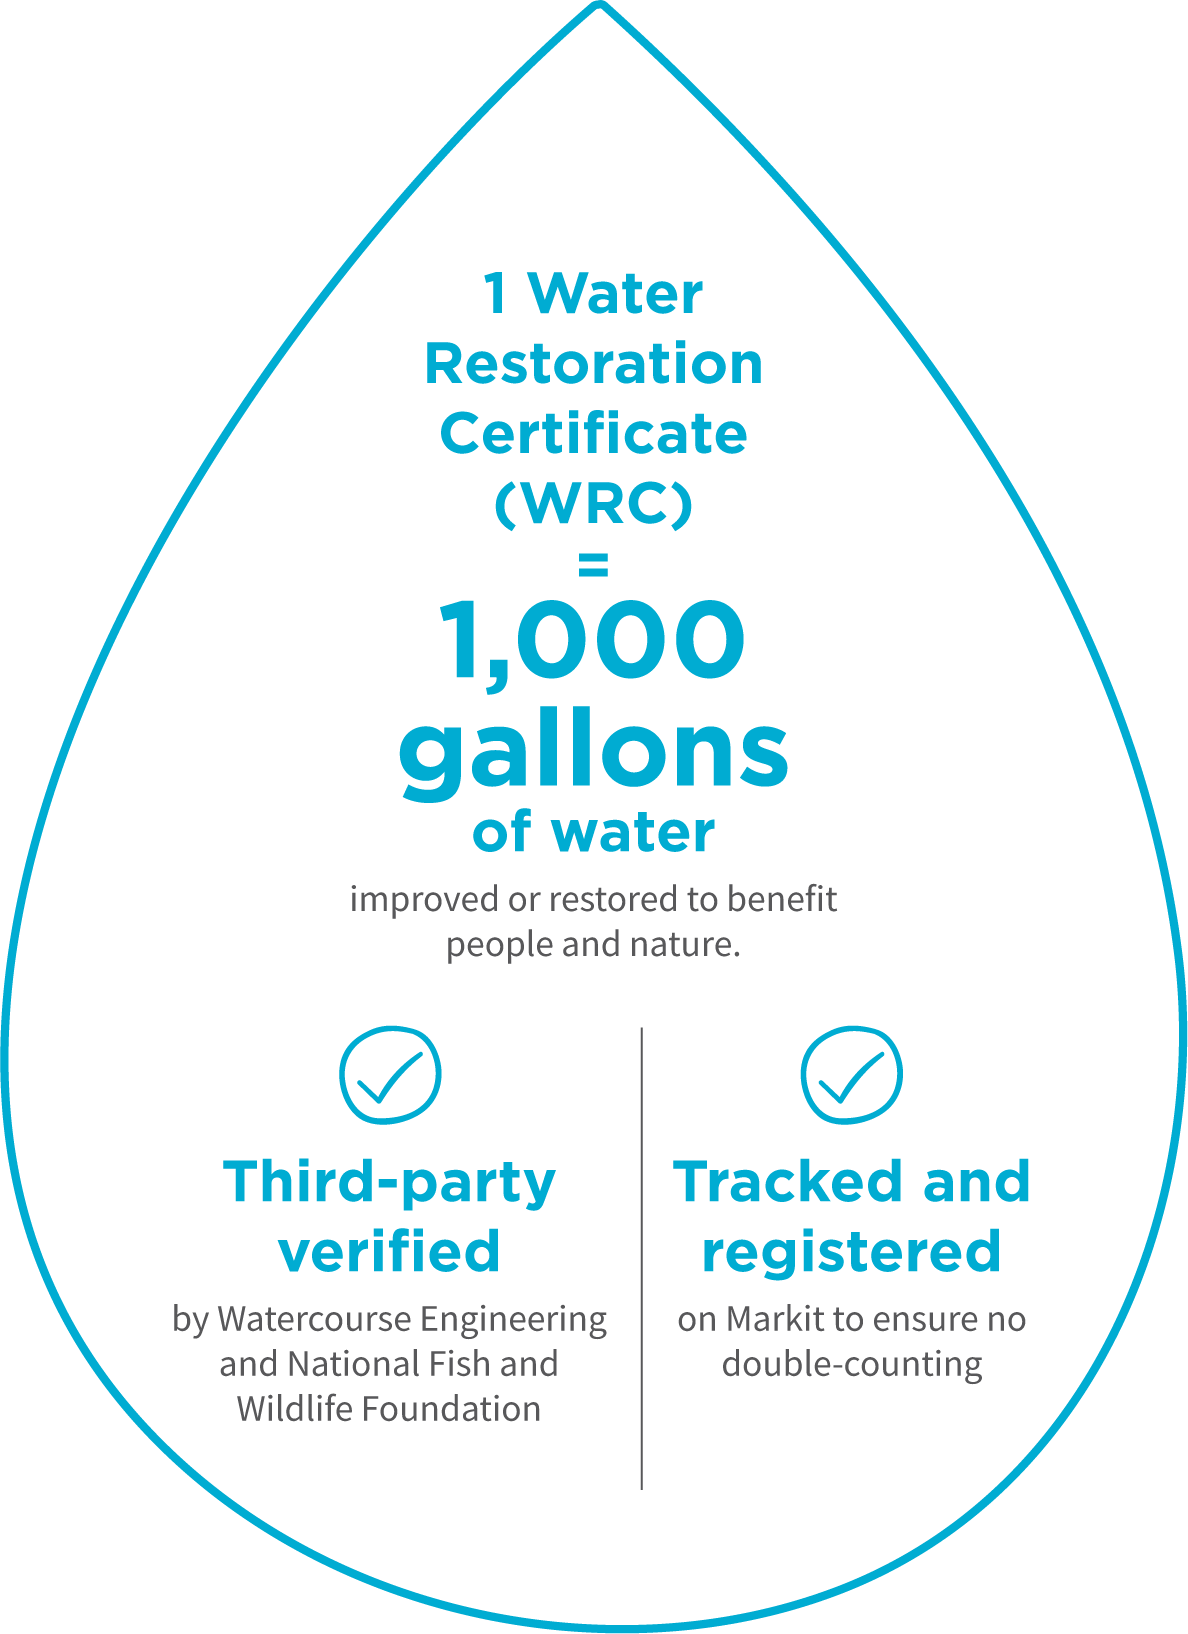
Similar to how one carbon credit represents one metric ton of carbon dioxide equivalent avoided or removed from the atmosphere, one water credit represents 1,000 gallons of natural freshwater flow that has been improved or restored.
Water credit projects involve protecting, restoring, or conserving water flows to ultimately help natural systems like rivers, wetlands, and aquifers, along with the communities that rely on them.
Source: Bonneville Environmental Foundation
For example, leading project developer Bonneville Environmental Foundation (BEF) issues Water Restoration Certificates® that are third-party verified, namely by Watercourse Engineering or the National Fish and Wildlife Foundation. All BEF WRC® projects are also tracked and registered on S&P Global’s Markit registry to avoid double-counting.
Other water credit programs exist, but BEF WRCs® are arguably the most established market-based solution for addressing your water footprint.
Terrapass offers BEF WRC® certificates that support projects like the Middle Deschutes River Flow Restoration project in Oregon, which in turn helps support a healthy ecosystem for local wildlife and communities.
Buy BEF WRCs® through Terrapass today.
How Do Water Credit Projects Work?
Water credit projects work similarly to carbon credit projects in terms of directing financing toward initiatives that support the restoration of natural freshwater flows and ecosystems.
Water restoration project developers like BEF work with farmers, conservation groups, and local irrigation districts to identify these opportunities and manage the projects. Water restoration projects also meet additionality requirements, meaning that without the funding from water credits, the projects would not be possible.
For example, funding might go towards the cost and effort of securing legal agreements that help restore river flows. This is necessary to help overcome challenges like “use it or lose it” water rights policies in the Western U.S. By maintaining a water source for ecological purposes, water rights holders can maintain their water rights while addressing old and inefficient requirements like the obligation to use all of their allotted water.
Note that since water issues are largely regional, best practice is to purchase credits from water restoration projects that help relieve water stress in the same basins where you’re using water. However, water credit projects are mostly concentrated in the Western U.S. where water stress is more severe, so matching projects to your location isn’t always possible. If that’s the case, buying a mixed portfolio of water credits can still compensate for your impact, it just might not directly address water issues in the areas you operate.
Water Credit Timing
Each water credit directly translates to 1,000 gallons of natural freshwater improved or restored over an 18-month cycle.
Note that while these projects might provide long-lasting water benefits, along with other associated environmental and social benefits, best practice is for buyers to only count water credits against their water footprint for the year in which these certificates are purchased.
To address your water footprint for multiple years, buyers can purchase water credits for each year they want to balance their water impact, similar to how you would purchase carbon credits corresponding to each year’s emissions.
Also note that water credits have vintages, which refer to the primary year when the water restoration took place. Like with carbon credits, best practice for water credits is to buy ones with recent vintages — generally within the last five years, but ideally within the past three. However, you don’t have to match vintages with the year of your own water consumption, as you’re still funding water improvements that help balance your own footprint.
Water Credit Project Types and Examples
BEF WRC® projects fall into one of three main categories:
- Restoring Flows: These projects often involve legal transactions like water rights transfers and partnerships with local groups to help keep water flowing in rivers and streams, rather than overly diverted, like for inefficient agricultural practices.
Example — Jordan River Flow Restoration: This project uses Environmental Water Transactions (EWTs) to help secure more water flowing from the Jordan River into the Great Salt Lake in Utah, which helps address the critical shrinking of this lake.
- Restoring Natural Systems: While similar to restoring flows, this project category focuses more on physical interventions to help restore freshwater systems like rivers and wetlands to their natural state, thereby increasing freshwater and potentially providing co-benefits like cleaner water.
Example — Pine Tree Brook Dam Removal: This project removes dams in the Pine Tree Brook in the Boston area to support the movement of local trout and improve water quality. For example, one of the dams on this brook was previously put in place to create a local ice rink, but that was no longer needed due to the 1950s construction of a nearby ice rink facility that does not rely on this water source. So, removing it helped return the brook to more of its natural order.
- Improving Efficiency: Some water credit projects focus more on conservation and efficient water use, which can thereby help retain or restore water in natural systems.
Example — Mason Lane Headgate: In Arizona, the Mason Lane Ditch diverts a tributary of the Verde River to irrigate agricultural land. This project funds the replacement of an inefficient headgate system with a modern, automated one to enable more precise control of the diverted water.
Benefits of Water Credits
In addition to directly supporting freshwater restoration, water credits provide a wide range of co-benefits, such as supporting:
- Groundwater conservation: Projects that minimize groundwater usage not only can improve water volume but also provide benefits like stabilization of river beds. That helps to avoid problems like sinking land and enables water systems to maintain natural filtration capabilities.
- Biodiversity: Water restoration projects often support biodiversity, like providing a healthier habitat for local fish and bird populations. That can provide associated environmental and economic benefits, like supporting pollinators and keeping local fisheries well-stocked.
One example of biodiversity co-benefits can be seen in the Merced County Seasonal Wetland Habitat project, which aims to provide an annual spring habitat for migratory birds in central California.
You can support projects like these by buying BEF WRCs® through Terrapass today.
- Recreation: Maintaining freshwater ecosystems helps provide communities with recreational opportunities, such as fishing, boating, and hiking. That can correlate with economic opportunities for these areas, while also supporting the health of local populations.
- Agricultural economies: The funding from water credits can directly support farmers and ranchers, providing an important income stream that can help mitigate issues like crop shortages. Long term, water credits can also support a more stable water supply that sustains these agricultural businesses season after season, even amidst increasing floods and droughts caused by climate change.
- Community empowerment: Water credits often involve working with tribal groups and other local communities. The economic, ecological, and recreational benefits can help protect these communities’ cultures and rights.
- Lower emissions: While water credits are separate from carbon credits, there can be interconnected benefits. For example, more efficient irrigation systems can use less water and energy. More reliable water supplies can also reduce the need for high-emitting fertilizers.
Why Individuals and Businesses Should Buy Water Credits
Water risk sometimes gets overshadowed by carbon emissions risk, but it’s important for both individuals and businesses to consider their water footprints. Buying water credits enables you to account for the impact of your water usage while supporting a broad range of environmental, economic, and social benefits.
In particular, consider the following:
For Individuals
You likely use far more water than you assume, particularly when accounting for indirect usage, like the water that went into making the jeans you bought. One survey from American Water found that most Americans think they use less than 100 gallons of water per day, when really total usage adds up to over 2,000 gallons daily, based on data from Water Footprint Network.
While it’s important to be mindful of your water usage, we’re all inevitably going to use water throughout our daily lives. So, purchasing water credits helps you take responsibility for the impact of this water usage while funding projects that have a wide range of co-benefits you may value.
For Businesses
Just as many companies acknowledge climate risk and commit to addressing greenhouse gas emissions, water scarcity and overuse can have direct economic effects on businesses, along with creating risks like reputational damage. By 2050, 31% of global GDP is projected to be exposed to high water stress, according to the World Resources Institute.
So, buying water credits can address your company’s direct water footprint and contribute to solving water scarcity and quality issues that can harm your operations going forward. Meanwhile, businesses can potentially increase goodwill with customers, employees, and the local communities where they operate by supporting water credit projects that have meaningful co-benefits.
Buying water credits can also align with other standards and certifications that many businesses value. Some examples include:
- WRI’s Volumetric Water Benefit (VWB) Accounting 2.0: Water credit projects can potentially align with this VWB accounting standard, and Bonneville Environmental Foundation was one of WRI’s partners involved in creating it. Still, consider looking into the details of this accounting standard and project specifics to determine alignment.
- UN Sustainable Development Goals (SDGs): Depending on the specific project, there can be benefits that align with multiple SDGs. For example, a project might align with SDG 6: Clean Water and Sanitation, while also supporting local economic development that aligns with SDG 11: Sustainable Cities and Communities.
- LEED Certification: Water credits can be matched to a building’s annual water usage and counted toward this green building certification.
- 1% for the Planet: BEF is an environmental partner of 1% for the Planet, so buying BEF WRCs® can qualify a company for membership.
- B Corp: Buying water credits can also count toward earning B Corp certification.
Ready to Support Water Restoration?
Terrapass makes it easy for you to balance your water footprint while supporting sustainable ecosystems and community development.
You can directly purchase BEF WRCs® through Terrapass today or reach out to speak with one of our sustainability experts who can help you build a custom portfolio of carbon credits and water credits that align with your sustainability goals.
Talk to a Sustainability Expert
The post The 2026 Complete Guide to Water Credits (WRCs) appeared first on Terrapass.
Carbon Footprint
Verra to Launch Scope 3 Standard in 2026: A New Era for Value Chain Carbon Tracking

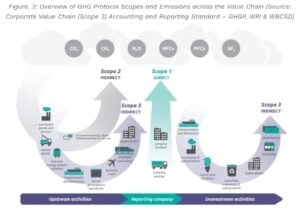
The post Verra to Launch Scope 3 Standard in 2026: A New Era for Value Chain Carbon Tracking appeared first on Carbon Credits.

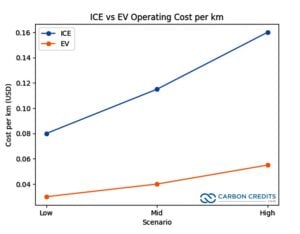
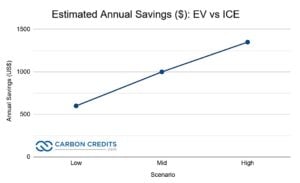
Rising global oil prices are driving up demand for electric vehicles (EVs), with Chinese brands emerging as key beneficiaries. Recent spikes in crude prices are driven by heightened tensions in the Middle East and disruptions in the Strait of Hormuz, a critical oil shipping route.
These factors have pushed Brent crude above $100 per barrel and created instability in fuel markets. This has pushed many consumers to rethink fuel costs and consider EV alternatives. Higher fuel prices increase running costs for gasoline and diesel cars, making EV ownership more economical in many markets.
Chinese EVs Gain Speed Abroad
Dealers in countries like Australia and parts of Southeast Asia see growing interest in Chinese EVs. This rise comes as fuel prices increase.
Showrooms selling Chinese new energy vehicles (NEVs) are seeing more test drives, customer inquiries, and rising order volumes. In Australia, the EV market share hit a record high of 11.8% for vehicle sales. Analysts say this jump is partly due to rising petrol prices.
Chinese manufacturers like BYD, GWM, and Chery are rapidly growing abroad. Some dealers see more walk-ins and more customers buying EVs.
China’s EV industry is now the largest in the world. In 2024, Chinese automakers produced over 12.87 million plug‑in electric vehicles (PEVs), including battery electric (BEV) and plug‑in hybrid models, accounting for nearly 47.5% of total automobile production. That figure marked a strong year‑on‑year rise and underscored China’s industrial scale and export readiness.

By late 2025, more than 51% of all new vehicles sold in China were electric — a major shift from just a few years earlier.
This domestic scale provides an export advantage. Chinese EVs often cost less than similar European and North American models. This helps them succeed in markets where fuel costs hit household budgets hard.
Fuel Costs Drive Behavior Shift
Rising oil prices are a major driver of these sales trends. Global crude prices have fluctuated due to geopolitical tensions. The Strait of Hormuz route carries around 20% of the world’s oil trade. These disruptions pushed crude prices sharply higher in early 2026.
In many countries, higher retail fuel prices translate into more immediate cost pressures for consumers. Reports from countries like Australia show petrol prices over $2.50 per litre. This rise is making consumers think about EVs to lower long-term costs.
Global EV Market Trends and Forecasts
The surge in Chinese EV exports aligns with broader global trends. Major industry forecasts suggest that global sales of battery electric and plug-in hybrid vehicles may top 22 million units by 2025. This could represent about 25% of all new car sales worldwide.
Global electric vehicle sales in 2025 reached nearly 21 million units, including both battery electric vehicles and plug‑in hybrid electric vehicles. This total represents a significant increase, roughly 20 % more than in 2024.
China’s share in this global growth is large. In 2024, Chinese manufacturers made up around 70% of all EV exports. This shows China’s key role in supply chains and manufacturing.
As oil demand growth slows due to EV uptake, some forecasts suggest that EVs could displace millions of barrels of global oil demand each day in the coming decade. By 2030, EV adoption could cut about 5 million barrels per day of oil use, according to major energy outlooks.
Trade Barriers vs Expansion
Despite strong export gains, barriers remain. Some regions have imposed tariffs and trade restrictions on Chinese EVs, and infrastructure gaps in charging networks can slow adoption. For example, tariffs exceeding 100% on certain Chinese EV imports in the U.S. have limited market share there.
However, Chinese OEMs are developing supplier and shipping capacity to support overseas demand. In 2025, China’s electric car makers expanded shipping through roll‑on/roll‑off carriers capable of transporting more than 30,000 vehicles, improving export logistics.
Emerging markets in Southeast Asia, Latin America, and Oceania are also showing rising EV interest. In the Philippines and Vietnam, dealerships see EV orders growing quickly. Some are even doubling their weekly sales, thanks to high fuel costs.
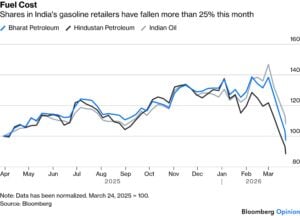
In India, where oil imports make up a big part of the economy, rising petrol costs make running traditional fuel vehicles more expensive. This has helped boost interest in electric vehicles, which are cheaper to operate when fuel is costly. Notably, the share of ICE retailers fell by over 25% in March.
Indian consumers and businesses view EVs as a way to shield against unstable oil prices. This also helps lower fuel costs, supporting the country’s move to electric transport.
What This Means for Energy and Transport Futures
The convergence of high oil prices and strong EV supply from China is creating a feedback loop. Higher fuel costs push consumers to consider EVs more seriously. Chinese manufacturers are well positioned to fill that demand with competitive pricing and large production scale.
The shift could speed up the move from fossil fuel cars to electric vehicles worldwide. This is especially true in price-sensitive and emerging markets. EV adoption also has implications for oil demand trends.
- As battery and charging tech get better and EV markets grow, oil use — especially in transport — might slow down or peak sooner than we thought.
At the same time, governments and industry groups are tracking these shifts closely. Policies that support charging infrastructure, EV incentives, and emissions standards will influence how quickly the global fleet electrifies.
Ultimately, the current oil price shock may have sparked a shift in global automotive markets — one where Chinese EVs take an increasingly central role in transport electrification worldwide.
The post Oil Shock Ignites Chinese EV Export Surge Around the World appeared first on Carbon Credits.

The U.S. is witnessing a surge in utility-scale solar development, driven by growing corporate demand for clean energy. Major tech companies like Meta and Google are securing long-term deals in Texas, combining renewable energy growth with economic and grid benefits.
This trend highlights how corporate commitments are shaping the future of the clean energy transition. Let’s find out.
Zelestra and Meta’s $600 Million Solar Deal
Madrid-based renewable energy firm Zelestra secured a massive $600 million green financing facility, signaling strong investor confidence in utility-scale solar. The funding, backed by Société Générale and HSBC, will support two large solar projects in Texas—Echols Grove (252 MW) and Cedar Range (187 MW).
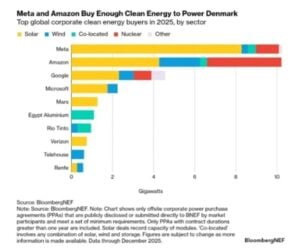
These projects are not standalone efforts. Instead, they are part of a broader clean energy partnership with Meta, one of the world’s largest corporate renewable energy buyers. Together, they form a portion of a seven-project portfolio totaling 1.2 GW under long-term power purchase agreements (PPAs).
Sybil Milo Cioffi, Zelestra’s U.S. CFO, said:
“This financing marks a significant milestone in the delivery of our largest U.S. solar projects to date. It reflects strong confidence from Societe Generale and HSBC in our strategy and execution capabilities and reinforces our ability to attract first-class capital to support our growth platform in the U.S. market.”
Zelestra is strengthening its presence in the U.S. energy market with innovative solutions for hyperscalers and corporate clients. It is developing around 15 GW of renewable projects across key markets. In February 2026, BloombergNEF ranked Zelestra among the top 10 PPA sellers to U.S. corporations.
Solar Powering Meta’s Climate Strategy
Meta continues to aggressively expand its clean energy footprint. The company has made renewable energy procurement a core part of its climate roadmap—and the numbers clearly reflect that shift.
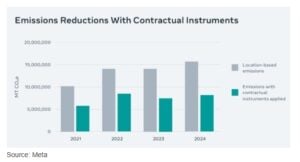
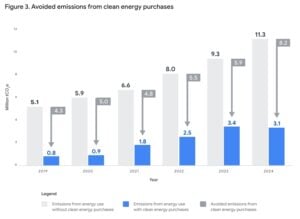
In 2024, Meta reported emissions of 8.2 million metric tonnes of CO₂e after accounting for clean energy contracts. In comparison, its location-based emissions stood at 15.6 million tonnes. This marked a sharp 48% reduction, largely driven by renewable energy purchases.
Moreover, the company has consistently maintained momentum:
- Since 2020, it has matched 100% of its electricity consumption with renewable energy.
- Over the past decade, it has secured more than 15 GW of clean energy globally.
- Overall, renewable energy procurement has helped cut 23.8 million MT CO₂e emissions since 2021.
As a result, Meta cut operational emissions by around 6 million tonnes in 2024 alone. At the same time, it tackled value chain emissions using Energy Attribute Certificates (EACs), reducing Scope 3 emissions by another 1.4 million tonnes.
Most of these deals were concentrated in the U.S., highlighting the country’s growing importance in corporate decarbonization strategies.
Importantly, this collaboration goes beyond just energy supply. It also aims to deliver broader economic benefits, including:
- Local job creation during construction
- Long-term tax revenue for the region
- Continued investment in local infrastructure
David Lillefloren, CEO at Sunraycer, said:
“These agreements with Google represent a significant milestone for Sunraycer and underscore the strength of our development platform. We are proud to support Google’s clean energy objectives while delivering high-quality renewable infrastructure in Texas.”
Additionally, the deal was facilitated through LevelTen Energy’s LEAP process, which simplifies and speeds up PPA execution. This highlights how innovative platforms are now playing a key role in scaling renewable deployment.
“Google’s data centers are long-term investments in the communities we call home,” said Will Conkling, Director of Energy and Power, Google. “This collaboration with Sunraycer will fuel local economic growth while helping to build a more robust and affordable energy future for Texas.”
Google, like Meta, has built a strong clean energy portfolio over time. Since 2010, it has signed over 170 agreements totaling more than 22 GW of capacity worldwide. Its long-term ambition is even more ambitious—achieving 100% carbon-free energy, every hour of every day, by 2030.
Why Texas Is Becoming the Center of Energy Transformation
All these developments point to one clear trend—Texas is rapidly becoming a global hub for clean energy and data center growth.
On one hand, the state offers strong solar resources, vast land availability, and a deregulated power market. On the other hand, it is witnessing a surge in electricity demand, especially from data centers and AI-driven workloads.
According to projections from the EIA, U.S. electricity demand could rise by 20% or more by 2030. Data centers are expected to play a major role in this growth. In fact, energy consumption from data centers increased by over 20% between 2020 and 2025.
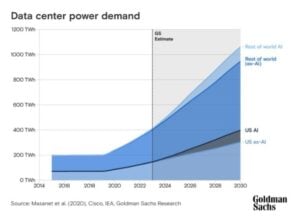
As a result, energy infrastructure in Texas is facing growing pressure. Rising industrial activity, extreme weather events, and rapid digital expansion are all contributing to grid stress. Yet, at the same time, this demand is driving unprecedented investment in renewable energy.
The EIA expects Texas to lead solar expansion in the coming years, accounting for nearly 40% of new solar capacity in the U.S. California will follow closely, and together, the two states will drive almost half of total additions.
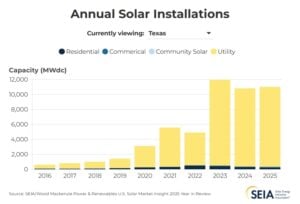
Even though the sector has faced temporary slowdowns, the long-term outlook for U.S. solar remains highly positive.
In 2025, the U.S. added 53 GW of new electricity capacity—the highest annual addition since 2002. Notably, wind and utility-scale solar together generated 17% of the country’s electricity, a massive jump from less than 1% two decades ago.
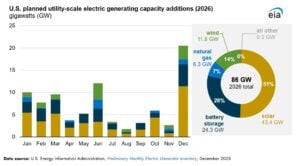
Looking ahead, growth is expected to accelerate again. Developers are planning to add around 86 GW of new capacity in 2026, which could set a new record. Solar alone is projected to account for more than half of this expansion.
Breaking it down further:
- Solar is expected to contribute 51% of new capacity
- Battery storage will make up 28%
- Wind will account for 14%
Utility-scale solar capacity additions could reach 43.4 GW in 2026, marking a 60% increase compared to 2025 levels.
Analysis: Corporate Demand Is Reshaping Energy Markets
Overall, the developments from Zelestra, Meta, Google, and Sunraycer highlight a broader transformation underway in global energy markets.
First, corporate buyers are no longer passive participants. Instead, they are actively shaping energy infrastructure through long-term PPAs. These agreements provide stable revenue for developers while ensuring a clean power supply for companies.
Second, financing is becoming more accessible. Large-scale funding deals, like Zelestra’s $600 million facility, show that banks are increasingly willing to back renewable projects with strong contractual support.
Third, regions like Texas are emerging as strategic energy hubs. The combination of rising electricity demand and favorable renewable conditions is attracting both developers and corporate buyers.
However, challenges remain. Grid reliability, permitting delays, and policy uncertainty could still impact the pace of deployment. Even so, the overall trajectory remains clear.
Clean energy demand is rising fast. Big Tech is leading the charge. And solar power is set to play a central role in meeting future electricity needs.
- READ MORE: Meta, Amazon, Google, and Microsoft Dominate Clean Energy Deals as Global Buying Slips in 2025
The post Texas Solar Market Heats Up with Meta and Google Investments appeared first on Carbon Credits.


-
Greenhouse Gases8 months ago
Guest post: Why China is still building new coal – and when it might stop
-
Climate Change8 months ago
Guest post: Why China is still building new coal – and when it might stop
-

 Greenhouse Gases2 years ago
嘉宾来稿:满足中国增长的用电需求 光伏加储能“比新建煤电更实惠”
-
Climate Change2 years ago
Bill Discounting Climate Change in Florida’s Energy Policy Awaits DeSantis’ Approval
-

 Climate Change2 years ago
嘉宾来稿:满足中国增长的用电需求 光伏加储能“比新建煤电更实惠”
-
Climate Change Videos2 years ago
The toxic gas flares fuelling Nigeria’s climate change – BBC News
-

 Carbon Footprint2 years ago
US SEC’s Climate Disclosure Rules Spur Renewed Interest in Carbon Credits
-

 Renewable Energy5 months ago
Sending Progressive Philanthropist George Soros to Prison?