Connect with us

Published

on

Besides the dust that cloaks pathways, windowsills and gardens, the towering grey heaps of discarded rock are another unwelcome reminder of the platinum mine next door to the South African township of Chaneng.

In and around the city of Rustenburg, the low-grade platinum ore that has made South Africa the world’s top producer of the silvery metal creates massive waste piled in large rocky heaps known as tailings. For every tonne of metal extracted, hundreds of tonnes of waste rock is left behind in huge piles.

The transition to cleaner energy system is expected to push up global demand for platinum group metals (PGM) – which include palladium and other precious metals, as well as platinum. They are used in hydrogen-related technologies such as fuel cells and electrolysers that split water molecules as well as in hybrid cars that need catalytic converters to curb pollution.

To secure supplies, mining companies are starting to make use of what was once considered waste.

Efforts to green lithium extraction face scrutiny over water use

Reprocessing mine tailings using new technology can be a more sustainable form of producing minerals and metals needed for the energy transition because it is expected to reduce the size of existing waste heaps and boost output without the need to open new mines, which can cause more environmental destruction and community displacement.

“Tailings reprocessing offers genuine benefits, reducing pressure for new mining [and] addressing existing environmental liabilities,” said Mathikoza Dube, an expert on critical minerals based in Rustenburg.

“It offers the world a pathway to secure supplies of energy transition minerals while remediating waste that’s contaminated communities for generations,” Dube added, cautioning it is not a “magic solution” and should be approached in a way that ensures local communities benefit.

In Chaneng, where the tailings dumps loom over backyards, residents are wary.

“Same theft in new clothes”

They fear the plan to reprocess mining tailings at the neighbouring mine – operated by South African platinum miner Sibanye-Stillwater – is being dressed up as sustainable when in reality it will mean more contamination, blasting, dust and no end to their community’s problems.

Despite decades of mining, unemployment in the area remains high, many people say they never received compensation for the loss of their agricultural land and most households still lack access to basic sanitation infrastructure.

Water testing carried out by SRK Consulting in 2009 found elevated nitrate levels exceeding World Health Organization guidelines in community boreholes, and health practitioners document dramatic increases in respiratory diseases.

“Now they want to dig up the waste piles and call it progress? Show us the ownership papers. Show us the rehabilitation plan. Otherwise, it’s the same theft in new clothes,” said Johannes Kgomo, a community leader.

    South Africa’s mining legislation requires that 26% of mining assets are held by historically disadvantaged people including Black South Africans, and Chaneng residents are demanding a stake of 15% to 30% in any tailings operation on their land, allowing them to have a say in how the business is run.

    They say that should be granted to them as compensation for the health and environmental problems they have endured as a result of the mine.

    The community is also demanding comprehensive water testing and treatment, adequately resourced clinics with respiratory specialists, compensation for destroyed agricultural land, infrastructure repair and long-term health monitoring.

    “We are not asking for handouts,” said Gideon Chitanga of the National Union of Mineworkers, which often takes the side of local communities in disputes with companies.

    “These people have already paid with their health, their water, their land. That contamination, that suffering – that is their investment. Now they want returns and decision-making power,” Chitanga added.

    A spokesperson for Sibanye-Stillwater declined to comment.

    A mining industry source, who asked not to be identified, said conversations with community members were ongoing.

    “Nobody disputes these communities have suffered. The question is how to structure ownership in a way that’s legally sound, financially viable, and genuinely empowering,” the source said.

    A lorry drives on a huge pile of grey rocks in South Africa
    A mine dump that is being reprocessed for minerals near Marikana in South Africa’s North West province (Photo: Fidelis Zvomuya)

    New technology boosts metal recovery in waste

    New reprocessing technology has made it economically viable to extract platinum group metals from tailings, and several operations are already underway in South Africa’s platinum mining belt, around the city of Rustenburg.

    Sibanye-Stillwater already operates multiple retreatment facilities, processing thousands of tonnes of waste ore monthly.

    Another South African miner Tharisa processes chromite from PGM tailings commercially. Chromite is used to obtain chromium, a metal used in the manufacture of wind turbines and some energy storage batteries.

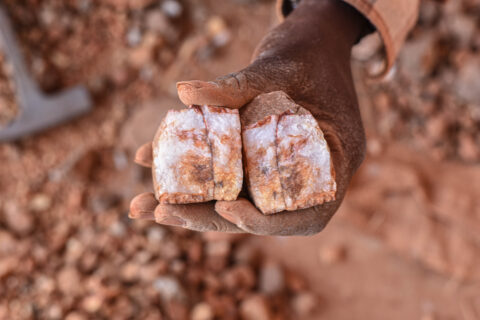
    “Historical tailings facilities contain economically viable concentrations that were unrecoverable with older technology,” said Leo Vonopartis from the University of the Witwatersrand’s BUGEMET research programme, which studies the geology of South Africa’s Bushveld Complex mining belt.

    Tailings in the area around Rustenburg can contain up to 2.5 grammes per tonne of combined platinum, palladium and rhodium – along with chromite. Vanadium, cobalt and rare earth elements have also been found.

    At current prices, which have rallied this year, it is worth extracting the rare metals, despite the challenges.

    Breaking with the cycle of extraction and injustice

    “The technology exists. The economics work. The question is whether we can structure these projects to genuinely benefit the people who have paid mining’s costs,” a spokesperson for one mining company said, asking not to be named.

    Without that, local expert Dube said, the reprocessing of tailings is scarcely better than other forms of mining.

    “Reprocessing tailings does not erase the damage that created them. If it is structured as extraction by another name – where companies profit and communities remain marginalised – we have just found a new way to perpetuate old injustices.”

    Australia’s COP31 Co-President vows to fight alongside Pacific for a fossil fuel transition

    Gesturing toward the tailings dam visible from her yard, Noxolo Mthembu recalls the days when her vegetable patch used to feed the family.

    “We used to grow spinach, tomatoes, pumpkins,” she told Climate Home News. “Now nothing grows. The dust kills everything. My children have asthma. My husband died of lung disease at 54.”

    Like many of her neighbours, she says any new cycle of mining activity – this time in the name of the clean energy transition – must not repeat the past.

    “Show me the ownership papers with our names. Show me the water treatment plant. Show me the clinic with enough staff. Then I will believe this time is different.”

    The post South Africa’s platinum mine dumps get a second look as clean energy lifts demand appeared first on Climate Home News.

    South Africa’s platinum mine dumps get a second look as clean energy lifts demand

    Continue Reading

    Climate Change

    From Baku to Belém and beyond: How we turn a climate finance roadmap into reality

    Published

    on

    Mukhtar Babayev is COP29 President and Special Representative of the President of Azerbaijan for Climate Issues.

    COP has entered “late-stage multilateralism”. We have already agreed the processes, targets and mechanisms to guide action. The system is now fully operational, resilient and delivering results. Success today depends less on what new things all countries agree and more on what individual actors achieve.

    And we are in a race against the clock, so there is a desperate need for speed. This will require new modes of working, rather than repeating the lumbering mechanisms of generations past. Our conversations at COP30 confirmed to us that the will and energy is there in bundles. It now needs to be directed.

    On finance, there is much to do. At COP29 we set the Baku Finance Goal to scale up support for the developing world to $1.3 trillion per year by 2035. This was no small ask.

      We are trying to intervene in the normal functioning of the world economy and channel the forces of global finance. Success will require great political will, sustained focus, and relentless action from all of us – the private sector, central banks, financial institutions, and everyone in between.

      But while the problems are easy to identify, the solutions are often missing. Efforts to reform the global financial system have been disjointed and the COP process needed a new framework to engage with actors outside our normal systems.

      More room for creativity outside negotiations

      In recognition of the need to try something new, countries mandated the Azerbaijani and Brazilian COP Presidencies to produce the Baku-to-Belém Roadmap to $1.3 trillion to set out the next steps. This was an innovative format, outside the negotiations and therefore given a free hand to be more creative.

      We opened the process to everyone. And while we promised that we would not be prescriptive, we were clear that we would be fearless at providing an honest look at a wide range of options.

      Countries have warmly welcomed the approach, and we were pleased to see the Roadmap recognised in COP30’s Global Mutirão decision. In Belém, they told us that while they don’t necessarily agree with every line, they still see the value of the exercise and want to build on it. This is a radical change from the normal process where we argue over every word and comma of each formal text.

      Practical next steps

      The Roadmap can act as a focal point and a coherent reference framework that incorporates existing initiatives. It identifies key action fronts and thematic priorities. And it concludes with practical short-term steps to guide early implementation.

      Many of these were designed to address the problems that COP presidencies have seen firsthand – lack of consistent data and reporting, uncertainty about forward projections, silos and a lack of continuity and interoperability between different processes.

      But we must acknowledge that this exercise has made some feel uneasy. They have feared that by broadening our focus, we are providing cover for governments not to fulfill their traditional responsibilities. And it is unacceptable that we have indeed seen cases of donors cutting funds and expecting the private sector to fill the gap.

      Donors must deliver in full

      So as we set out the Roadmap for all to follow, we have a duty to be unequivocal with governments. The COP29 negotiations to agree on the historic target for $300 billion per year in public funds by 2035 were hard. Now, there can be no excuses. We asked vulnerable communities to accept the limits of how much support they could expect. In equal measure, we insist that donors deliver in full, with developed countries taking the lead.

      COP30 fails to land deal on fossil fuel transition but triples finance for climate adaptation

      Too often, when we set a target for everyone, no one steps up, as collective responsibility undermines individual accountability. That must change. And in the Roadmap we have asked developed countries to work together on a delivery plan that explains how they will meet the $300 billion per year climate finance goal.

      Innovative approaches needed

      Late-stage multilateralism demands that we are ready to innovate with our processes. They did well to get us this far and they need to be preserved. But we also need to think outside the box on how we deliver the aims and objectives that we have set ourselves.

      COP30 showed that there is an appetite for new approaches and new ideas. The Baku-to-Belém Roadmap could be a template for one such evolution of the COP process.

      Now we need other ideas, more creativity and real-world action to show that this template can work. The COP29 Presidency will continue to work with everyone to find new solutions, scale promising initiatives and deliver on the promises we have all made.

      The post From Baku to Belém and beyond: How we turn a climate finance roadmap into reality appeared first on Climate Home News.

      From Baku to Belém and beyond: How we turn a climate finance roadmap into reality

      Continue Reading

      Climate Change

      Bittersweet

      Published

      on

      I write with a bittersweet announcement. I am moving on from Climate Generation at the end of December. It has been an honor to share my thoughts with you each month here.

      For 19 years, Climate Generation has been supporting educators, young people and communities to build climate change literacy and ignite action to arrive at a just and abundant world beyond the climate crisis. This critical and powerful work is essential and will continue with the current team and new leadership.

      My time with Climate Generation has been an amazing three years. I have appreciated each of you and the solidarity we built to continue the work despite unprecedented threats from the federal administration, entrenched climate change denialism and the erasure of critical resources. Climate Generation has persevered in spite of those challenges, filling a critical need in the climate justice movement. I am so proud of the work we have accomplished together in this time. Some of the highlights include:

      • Increasing the quality and impact of YEA! (Youth Environmental Activists!) programming with adoption of the Youth Program Quality Assessment tool and experiential learning frameworks.
      • Retooling our Window into COP program by leveraging relationships to send locally based, intergenerational, and mostly BIPOC delegations to the COPs (Conference of the Parties, also known as the United Nations Climate Talks)
      • Launching the Schools As Solutions Fellowship to support educators in becoming climate justice changemakers.
      • Adding two youth seats to our Board of Directors.
      • Helping to pass groundbreaking legislation, including the 100% Clean Energy bill, the Cumulative Impacts Bill (protecting environmental justice communities), and Ethnic Studies (bringing the experiences of ALL Minnesotans, especially those that have been marginalized, into our curriculum).

      Climate Generation has put together a Transition Committee with board and staff representation and is working with Mighty Consulting to bring in an Interim Executive Director. I deeply trust this leadership team and am confident that they will chart the path to carry Climate Generation forward.

      I am excited about the work that Climate Generation will continue doing to ignite and sustain the ability of educators, youth, and community to take action on the systems perpetuating the climate crisis. Together we are building a movement.

      In solidarity,

      Susan Phillips

      Susan Phillips
      Executive Director

      The post Bittersweet appeared first on Climate Generation.

      https://climategen.org/blog/bittersweet/

      Continue Reading

      Climate Change

      Guest post: How the Greenland ice sheet fared in 2025

      Published

      on

      Greenland is closing in on three decades of continuous annual ice loss, with 1995-96 being the last year in which the giant ice sheet grew in size.

      With another melt season over, Greenland lost 105bn tonnes of ice in 2024-25.

      The past year has seen some notable events, including ongoing ice melt into the month of September – well beyond the end of August when Greenland’s short summer typically draws to a close.

      In a hypothetical world not impacted by human-caused climate change, ice melt in Greenland would rarely occur in September – and, if it did, it would generally be confined to the south.

      In this article, we explore how Greenland’s ice sheets fared over the 12 months to August 2025, including the evidence that the territory’s summer melting season is lengthening.

      (For our previous analyses of Greenland’s ice cover, see coverage in 2024, 2023, 2022, 2021, 2020, 2019, 2018, 2017, 2016 and 2015.)

      Surface mass balance

      The seasons in Greenland are overwhelmingly dominated by winter.

      The bitterly cold, dark winter lasts up to ten months, depending on where you are. In contrast, the summer period is generally rather short, starting in late May in southern Greenland and in June in the north, before ending in late August.

      Greenland’s annual ice cycle is typically measured from 1 September through to the end of August.

      This is because the ice sheet largely gains snow on the surface from September, accumulating ice through autumn, winter and into spring.

      Then, as temperatures increase, the ice sheet begins to lose more ice through surface melt than it gains from snowfall, generally from mid-June. The melt season usually continues until the middle or end of August.

      Over this 12-month period, scientists track the “surface mass balance” (SMB) of the ice sheet. This is the balance between ice gains and losses at the surface.

      To calculate ice gain and losses, scientists use data collected by high-resolution regional climate models and Sentinel satellites.

      The SMB does not consider all ice losses from Greenland – we will come to that later – but instead provides a gauge of changes at the surface of the ice sheet.

      According to our calculations, Greenland ended the year 2024-25 with an overall SMB of about 404bn tonnes. This is the 15th highest SMB in a dataset that goes back 45 years, exceeding the 1981-2010 average by roughly 70bn tonnes.

      This year’s SMB is illustrated in the maps and charts below, based on data from the Polar Portal.

      The blue line in the upper chart shows the day-to-day SMB. Large snowfall events become visible as “spikes”. The blue line in the lower chart depicts the accumulated SMB since 1 September 2024. In grey, the long-term average and its variability are shown. For comparison, the red line shows the record-low year of 2011-12.

      The map shows the geographic spread of SMB gains (blue) and losses (red) for 2024-25, compared to the long-term average.

      It illustrates that southern and north-western Greenland had a relatively wet year compared to the long-term average, while there was mass loss along large sections of the coast, in particular in the south-west. The spikes of snow and melt are clearly visible in the graphs on the right.

      Left: Map showing the difference between the annual SMB in 2024-25 and the 1981-2010 period in mm of ice melt. Blue shows ice gain compared to average and red shows ice loss with respect to average. Right: Daily (upper chart) and cumulative (lower chart) SMB of the Greenland ice sheet, in Gt/day and Gt, respectively. (1Gt is equal to 1 cubic kilometre.) Blue lines show the 2024-25 SMB year; the grey lines and areas show the 1981-2010 average and variability; and the red line in the lower chart shows the record low SMB year of 2011-12. Credit: Polar Portal.
      Left: Map showing the difference between the annual SMB in 2024-25 and the 1981-2010 period in mm of ice melt. Blue shows ice gain compared to average and red shows ice loss with respect to average. Right: Daily (upper chart) and cumulative (lower chart) SMB of the Greenland ice sheet, in Gt/day and Gt, respectively. (1Gt is equal to 1 cubic kilometre.) Blue lines show the 2024-25 SMB year; the grey lines and areas show the 1981-2010 average and variability; and the red line in the lower chart shows the record low SMB year of 2011-12. Credit: Polar Portal.

      Lengthening summer

      Scientists have traditionally pinned the start of the “mass balance year” in Greenland to 1 September, given that this is when the ice sheet typically starts to gain mass.

      However, evidence has started to emerge of a lengthening of the summer season in Greenland – as predicted some time ago by climate models.

      The start of the 2024-25 mass balance year in Greenland saw ice melt continuing into September. This included a particularly unusual spike in ice melt in the northern part of the territory in September as well as all down the west coast.

      In a world without human-caused climate change, ice melt in September would be very rare – and generally confined to the south.

      Greenland also saw an early start to the summer melt season in 2025. The onset of the melting season, defined as the first of at least three days in a row with melting over more than 5% of the ice sheet, was on 14 May. This is 12 days earlier than the 1981-2025 average.

      The maps below show the extent of melt (red shading) across the ice sheet on 24 September 2024 (left) and 20 May 2025 (right). The blue lines in charts beneath show the percentage melt in 2024 (left) and 2025 (right), up to these dates, compared to the 1981-2010 average (grey).

      The melt season began with a significant spike of melting across the southern part of the ice sheet. This happened in combination with sea ice breaking up particularly early in north-west Greenland, allowing the traditional narwhal hunt to start much earlier than usual.

      Top: Map showing areas of Greenland undergoing surface melt on 24 September 2024 and 20 May 2025 (shaded red). Bottom: Percentage of ice sheet area seeing surface melt on each day of 2024 and 2025 (blue line), ending on 24 September and 20 May, respectively. The grey line shows the 1981-2010 average. Credit: Polar Portal.
      Top: Map showing areas of Greenland undergoing surface melt on 24 September 2024 and 20 May 2025 (shaded red). Bottom: Percentage of ice sheet area seeing surface melt on each day of 2024 and 2025 (blue line), ending on 24 September and 20 May, respectively. The grey line shows the 1981-2010 average. Credit: Polar Portal.

      Surface melt

      The ablation season, which covers the period in the year when Greenland is losing ice, started a little late. The onset of the season – defined as the first of at least three days in a row with an SMB below -1bn tonnes – began on 15 June, which is two days later than the 1981-2010 average.

      Overall, during the 2025 summer, a remarkably large percentage of the ice sheet was melting at once. This area was larger than the 1981-2010 average for three and a half months (mid-June to end of September).

      In mid-July, melting occurred over a record area. For three days in a row, melting was present over more than 80% of the area of the ice sheet – peaking at 81.2%. This is the highest value in our dataset, which started in 1981.

      The red shading in the maps below shows the extent of melting across Greenland on 19 July (left) and 30 September (right) 2025. The charts beneath show the daily extent of melting through 2025 (blue line), up to these dates, compared to the 1981-2010 average.

      Top: Map showing areas of Greenland undergoing surface melt (shaded red) on 19 July (left) and 30 September (right) 2025. Bottom: Percentage of ice sheet area seeing surface melt on each day of 2025 (blue line), ending on 19 July and 30 September, respectively. The grey line shows the 1981-2010 average. Credit: Polar Portal.
      Top: Map showing areas of Greenland undergoing surface melt (shaded red) on 19 July (left) and 30 September (right) 2025. Bottom: Percentage of ice sheet area seeing surface melt on each day of 2025 (blue line), ending on 19 July and 30 September, respectively. The grey line shows the 1981-2010 average. Credit: Polar Portal.

      Snowfall

      However, the SMB is not just about ice melt.

      There was a lack of snowfall in the early winter months (September to January), particularly in south-east Greenland, which is typically the wettest part of the territory. The months that followed then saw abundant snow, which brought snowfall totals up closer to average by the start of summer.

      A cold period at the end of May and in June protected the ice sheet from excessive ice loss. Melt then continued rather weakly until mid-July.

      This was followed by strong melting rates in the second half of July and again in mid-August.

      Overall, with both ice melt and snowfall exceeding their historical averages for the year as a whole, the SMB of the Greenland ice sheet ended above the 1981-2010 average.

      These increases in snowfall and melt are in line with what scientists expect in a warming climate. This is because air holds more water vapour as it warms – leading to more snowfall and rain. Warmer temperatures also lead to more ice melt.

      Total mass balance

      The surface mass balance is just one component of the “total” mass balance (TMB) of the Greenland ice sheet.

      The total mass balance of Greenland is the sum of the SMB, the marine mass balance (MMB) and basal mass balance (BMB). In other words, it brings together calculations from the surface, sides and base of the ice sheet.

      The MMB measures the impact of the breaking off – or “calving” – of icebergs, as well as the melting of the front of glaciers where they meet the warm sea water. The MMB is always negative and has increased towards more negative values over the last decades.

      BMB refers to ice losses from the base of the ice sheet. This makes a small negative contribution to the TMB.

      (The only way for the ice sheet to gain mass is through snowfall.)

      The continued mass loss observed in Greenland is primarily due to a weakening of the SMB – caused by rising melt combined with insufficient compensation of lost ice through snowfall.

      The figure below shows how much ice the Greenland ice sheet has lost (red) going back to 1987, which includes the SMB (dark blue), MMB (mid blue) and BMB (light blue). The analysis, which uses data from three models, is based on 2021 research published in Earth System Science.

      Despite a relatively high SMB, high calving rates meant that Greenland lost 105bn tonnes of ice over the 12-month period.

      This means that 2024-25 was the 29th year in a row with a Greenland ice sheet overall mass loss. As the chart shows, Greenland last saw an annual net gain of ice in 1996.

      Chart showing that 2024-25 was the 29th year in a row where Greenland's ice sheet lost mass overall
      Chart showing the surface (blue), marine (green), basal (yellow) and total (red) mass balance for the “mass balance years” 1987 to 2025. Figures are in Gt per year. Mass balance year 1987 is from 1 September 1986 to 31 August 1987; similar for other years. Credit: Carbon Brief, based on updates to Mankoff et al. (2021).

      Satellite data

      The mass balance of the Greenland ice sheet can also be measured by looking at the Earth’s gravitational field, using data captured by the Grace and Grace-FO satellite missions – a joint initiative from NASA and the German Aerospace Center.

      The Grace satellites are twin satellites that follow each other closely at a distance of about 220km, which is why they are nicknamed “Tom and Jerry”. The distance between the two depends on gravity – which is, in turn, related to changes in mass on Earth, including ice loss.

      Therefore, the distance between the two satellites, which can be measured very precisely, can be used to calculate loss of mass from the Greenland ice sheet.

      Overall, the satellite data reveals that Greenland’s ice sheet lost around 55bn tonnes of ice over the 2024-25 season.

      There is reasonably good agreement between the Grace satellite data and the model data, which, as noted above, finds that 105bn tonnes of ice was lost in Greenland over the same period.

      However, the alignment of the two datasets – which are fully independent of each other – becomes more clear once a longer time period is considered.

      In the 22-year period between April 2002 and May 2024, the Grace data shows that Greenland lost 4,911bn tonnes of ice. The modelling approach, on the other hand, calculates that 4,766bn tonnes of ice was lost.

      The figure below shows gain and loss in the total mass of ice of the Greenland ice sheet, calculated using Grace satellite measurements. It reveals that, over the past 23 years, there has been mass loss in the order of several metres along the coasts of Greenland, with the most significant losses seen on the western coast. Over the central parts of the ice sheet, there has been a small mass gain.

      The lower figure shows the contribution of Greenland mass change to sea level rise over the last 23 years, according to the satellite data. It illustrates that more than 5,000bn tonnes of ice have been lost over the time period – contributing to roughly 1.5cm of sea level rise.

      Gain and loss in the total mass of ice of the Greenland ice sheet based on the GRACE and GRACE-FO satellites, updated until July 2025. Shown is the month-by-month mass change in billions of tonnes (Gt) = cubic kilometres (km3). Credit: Polar Portal.
      Gain and loss in the total mass of ice of the Greenland ice sheet based on the GRACE and GRACE-FO satellites, updated until July 2025. Shown is the month-by-month mass change in billions of tonnes (Gt) = cubic kilometres (km3). Credit: Polar Portal.
      Greenland mass change’s contribution to sea level rise, where 100bn tonnes is equivalent to 0.28mm of global sea level rise. All changes are given relative to April 2002. Credit: Polar Portal.
      Greenland mass change’s contribution to sea level rise, where 100bn tonnes is equivalent to 0.28mm of global sea level rise. All changes are given relative to April 2002. Credit: Polar Portal.

      Warm over Europe and North America, cool over Greenland

      As always, the weather systems across the northern hemisphere play a key role in the melt and snowfall that Greenland sees each year.

      As in previous years, multiple heatwaves were observed in southern Europe and North America over the summer of 2025.

      And, just like in 2024, there was only modest heat in northern Europe – with the notable exception of Arctic Scandinavia – with a comparably cool and rainy July followed by a warmer and sunnier August.

      The high-pressure weather systems that bring heatwaves have a wide-ranging impact on weather extremes across the northern hemisphere.

      Strong blocking patterns over North America and Europe were repeatedly present in the course of the summer of 2025. In such a blocked flow, the jet stream – fast-moving winds that blow from west to east high in the atmosphere – is shaped like the Greek capital letter Omega (Ω).

      The jet stream bulged up to the north over Canada and northern Europe. West and east of these ridges, low pressure troughs were found at both “feet” of the Omega. One of these troughs was located over Greenland (top left panel in next figure).

      This resulted in widespread heat near the cores of these high-pressure systems, fuelling fires in several countries, including large wildfires in Canada. Smoke from these wildfires reached Greenland and Europe in late May.

      Unlike in previous years, no heavy precipitation events were observed near the “feet” of the Omega.

      If the Omega pattern is displaced by half a wavelength, the opposite – warm over Greenland, with cool continents – is also possible.

      This circulation pattern occurred in August 2025 and is shown in the top right panel of the figure below. The bottom panel depicts the large temperature variability in May 2025.

      Top panel: Left: Map showing cool summer weather in Greenland (in centre of map) and very mild conditions over northern North America and northern Europe as well as Asia in December 2024. Right: Warm weather over Greenland with cool continents in August 2025. Shading indicates temperatures that are warmer (red) or cooler (blue) than the long-term average for the time of year. The arrows show the circulation patterns in the atmosphere. Bottom panel: large temperature variability in May 2025. Credit: Polar Portal.
      Top panel: Left: Map showing cool summer weather in Greenland (in centre of map) and very mild conditions over northern North America and northern Europe as well as Asia in December 2024. Right: Warm weather over Greenland with cool continents in August 2025. Shading indicates temperatures that are warmer (red) or cooler (blue) than the long-term average for the time of year. The arrows show the circulation patterns in the atmosphere. Bottom panel: large temperature variability in May 2025. Credit: Polar Portal.

      The post Guest post: How the Greenland ice sheet fared in 2025 appeared first on Carbon Brief.

      Guest post: How the Greenland ice sheet fared in 2025

      Continue Reading

      Trending

      Copyright © 2022 BreakingClimateChange.com