


This post was written by Ed Robeck, Director of Education and Outreach at the American Geosciences Institute (AGI) and School of Rock October 2023 instructor.
On the transit from Reykjavik to Amsterdam during IODP expedition 400T, the seas are giving our group of science educators a lot to think about. Waves of 4-6 meters are moving the JOIDES Resolution in all directions (rolling, pitching, and heaving), and we are all feeling the effects of the storm as it does. In fact, those movements have forced us to slow our headway considerably from what would be normal speed, postponing our arrival by a day. So, of course, a bunch of us started science-ing about the situation.

Fortunately, one of the teachers, DaNel Hogan, has an app (Physics Toolbox Suite) on her phone, which provides the data we need to do some impromptu explorations. The app records acceleration in all three dimensions. Since the dramatic up and down motion was most unusual for us, we paid attention to the z-dimension acceleration first, which turned out to be about ±1 m/sec^2 most of the time, (in round figures—with extremes more like ± 2 m/sec^2 ). Knowing that the acceleration of gravity is 9.8 m/sec^2 , that measurement suggests that a person would experience an effective change in weight (but not mass, unfortunately) of ±10%. That is, a +10% acceleration on the ship’s upward movement, and -10% on the downward movement—or a total of 20% across the period of a single cycle. The period of the oscillations on the ship range from about 6 seconds to about 12 seconds—averaging 9 seconds, which happens to be almost exactly the time it takes to carefully ascend or descend a staircase on the ship. This means that a 150 lb. person would feel themselves change from about 135 lb to 165 lb while moving between decks—a 30 lb. difference in the weight the person would feel. That’s effectively the change from feeling like “I can fly” to something like “I just can’t take another step!” That was a change we could all identify with moving around the ship.

We were talking about this while sitting in the conference room where we spend most of our time, and we noticed empty chairs swinging around in unison. Sometimes they’d rotate about 20º before turning back, and sometimes rotating almost 180º. Is this inertia, suggesting that the ship is pivoting that much beneath them? Probably not. On the wall of the conference room there is a monitor that shows various data about our trip, including the heading (where we’re going) and the bearing (which way the ship is pointing). The two are diverging to varying amounts due to the strong wind off the port bow, (probably with a lot of noise in the signal). The variation we see of 10º – 20º would not support inertia as the main cause of the free-swinging chairs. After some discussion, we came to the shared interpretation that the chair movements have more to do with the chair’s center of gravity being offset from its axis of rotation. With each pitch of the ship, the center of gravity is raised, leading to added torque being generated, which leads to the chair swinging around until the center of gravity is on the low side. When the next movement in the opposite direction takes place, the chair swings the other way.
These are not entirely empty machinations. Some of it becomes important in the core labs. For example, we considered the fact that mass of core segments is important in many calculations of their properties. How does one calculate the mass of a sample when the scale is being accelerated up and down randomly? The solution is conceptually elegant. There are two scales—one with a sample and the other with known mass. The acceleration can be easily calculated based on apparently change in the force on the scale produced by the known mass, which provides a correction for a computer connected to both scales. That correction is applied to the sample reading to calculate its mass in real time.

There are other effects we are observing—sliding of smooth objects, rolling of anything laid on a round side (crayons on tables were especially fun)—all of which we’re getting used to and many of which are more straightforward to explain using a combination of friction, inertia, and gravity. Other effects are now feeling normal, too—loud bangs and vibrations from waves hitting the ship, sloshing of water on the deck, and creaking bookshelves. All in all, the waves have made for a voyage that is even more interesting than anticipated—and for those of us less affected by nausea—an opportunity to apply science to yet another experience provided by life on the JOIDES Resolution.





Ocean Acidification
Dr Heidarzadeh’s TV interview with SkyNews on the massive M7.7 Panama earthquake on 9 October 2026
Dr Heidarzadeh’s TV interview with SkyNews on the massive M7.7 Panama earthquake on 9 October 2026. Click here for the full story.

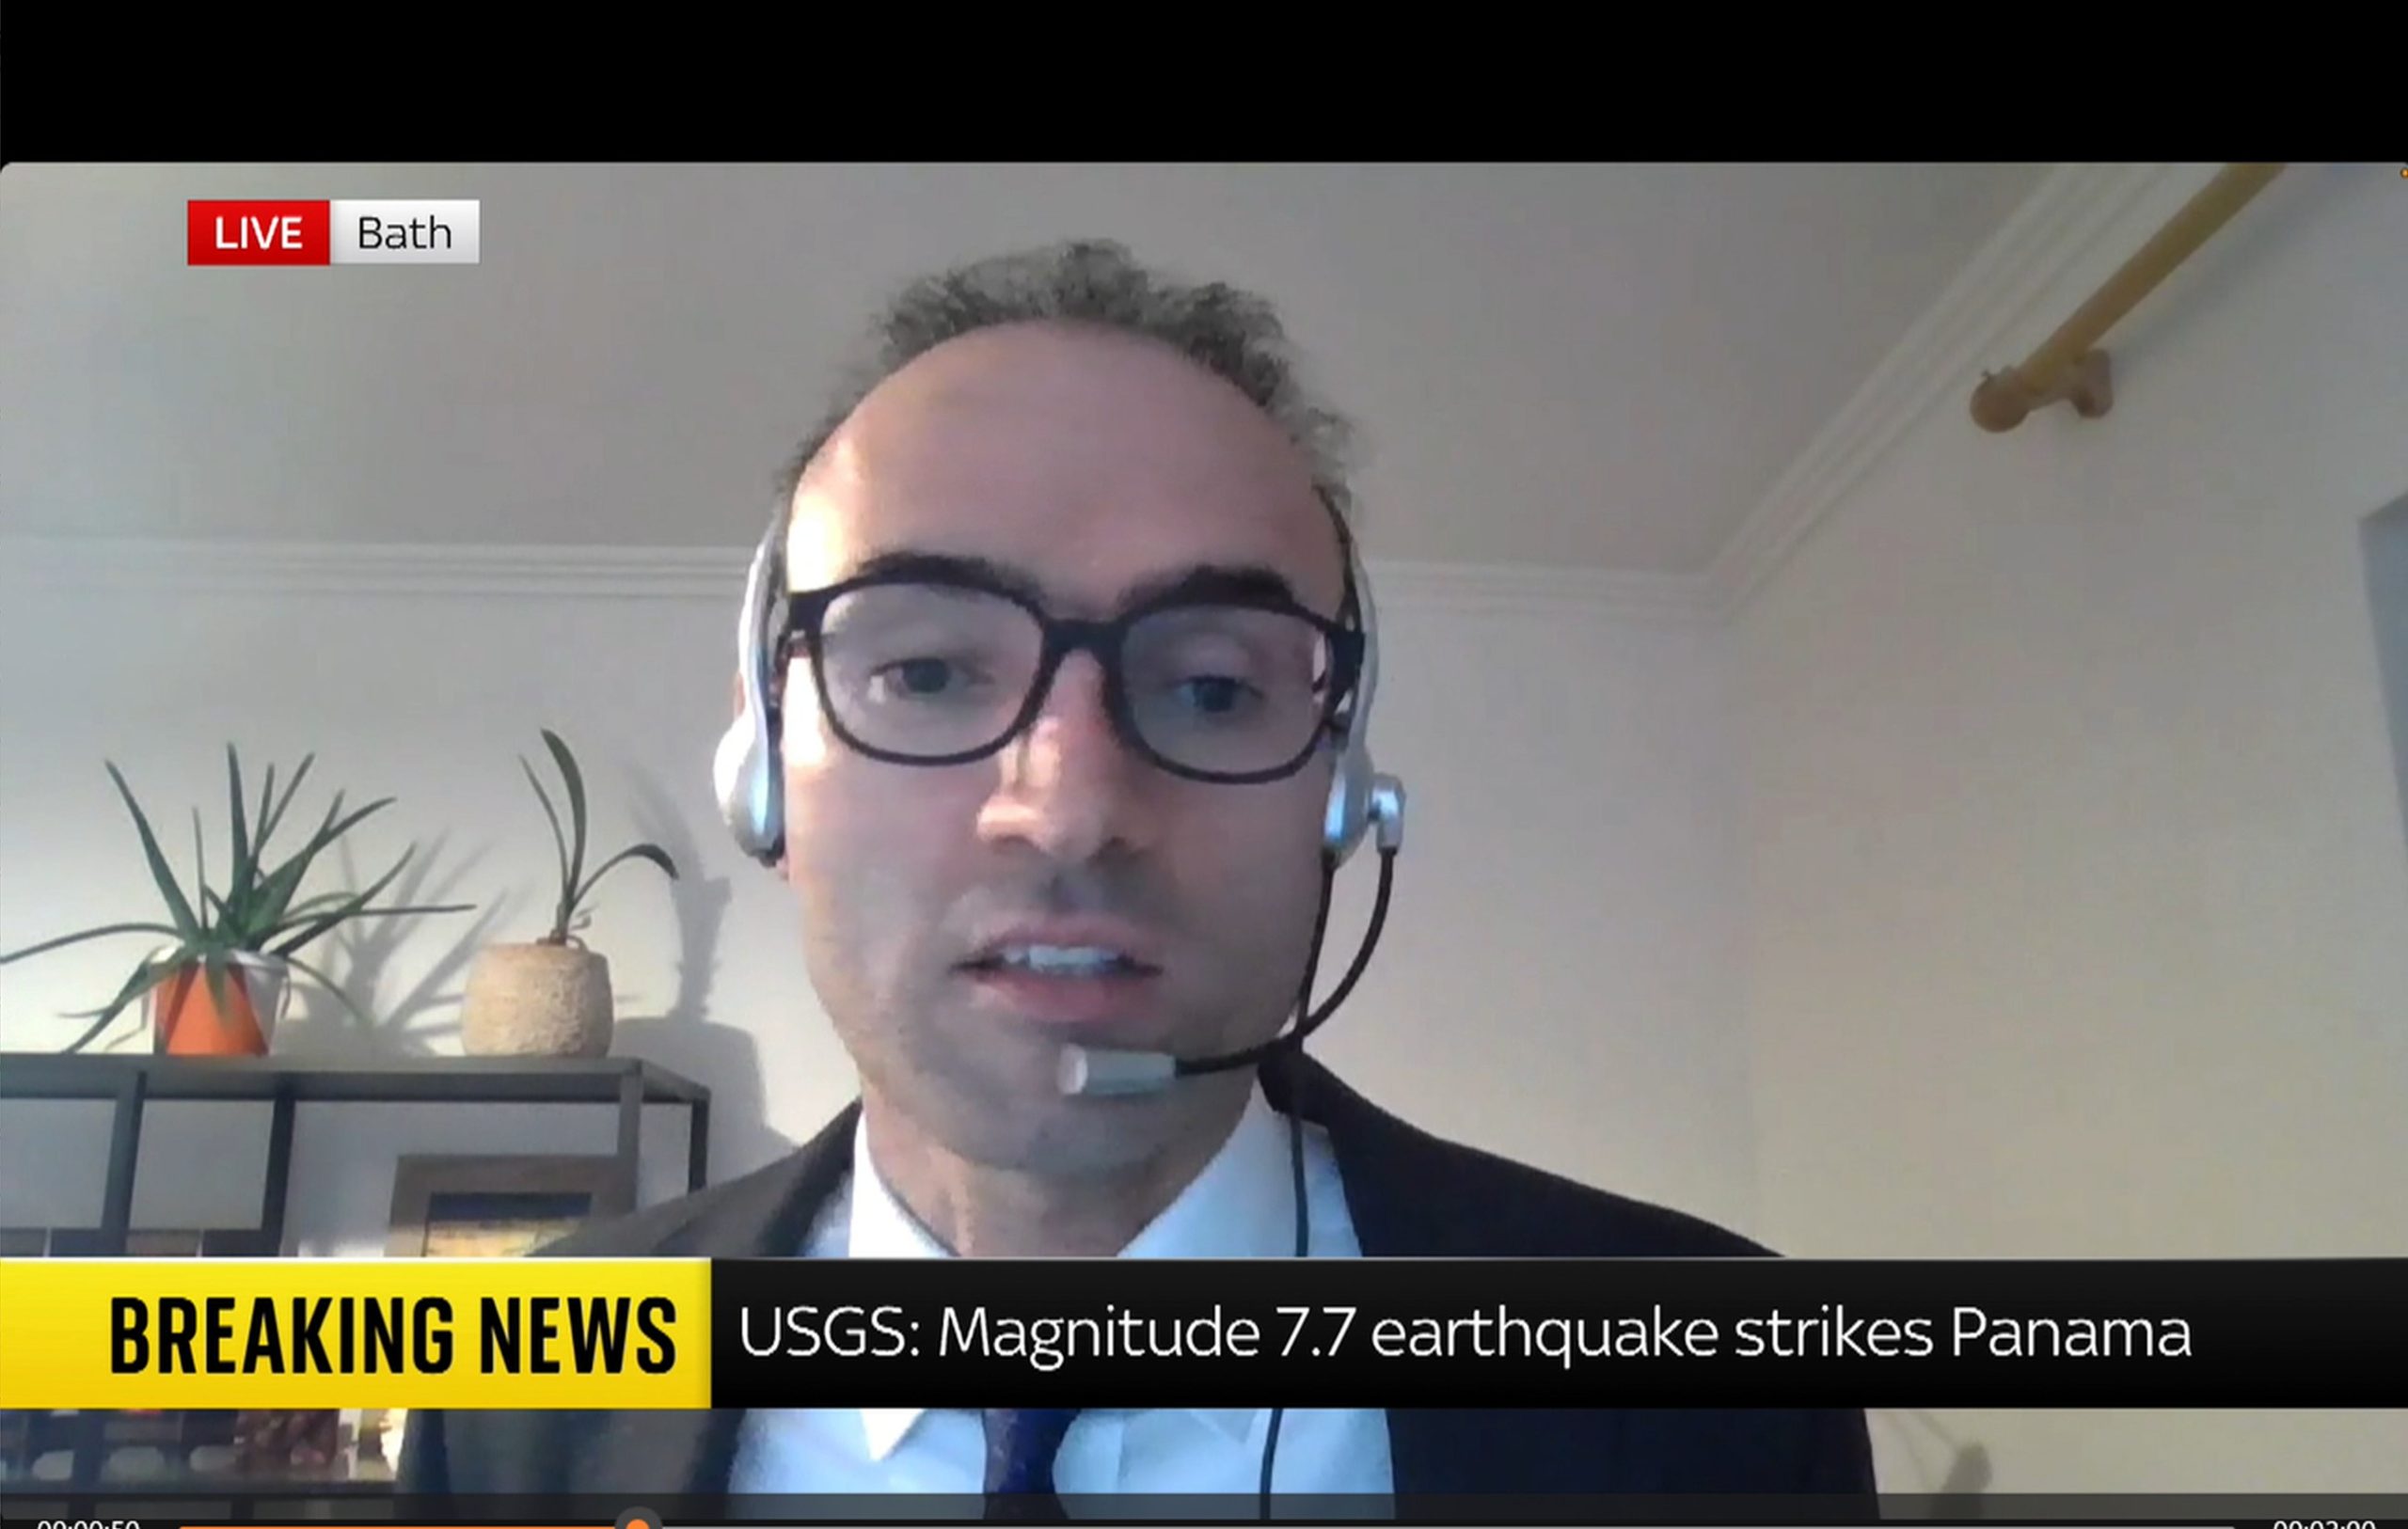
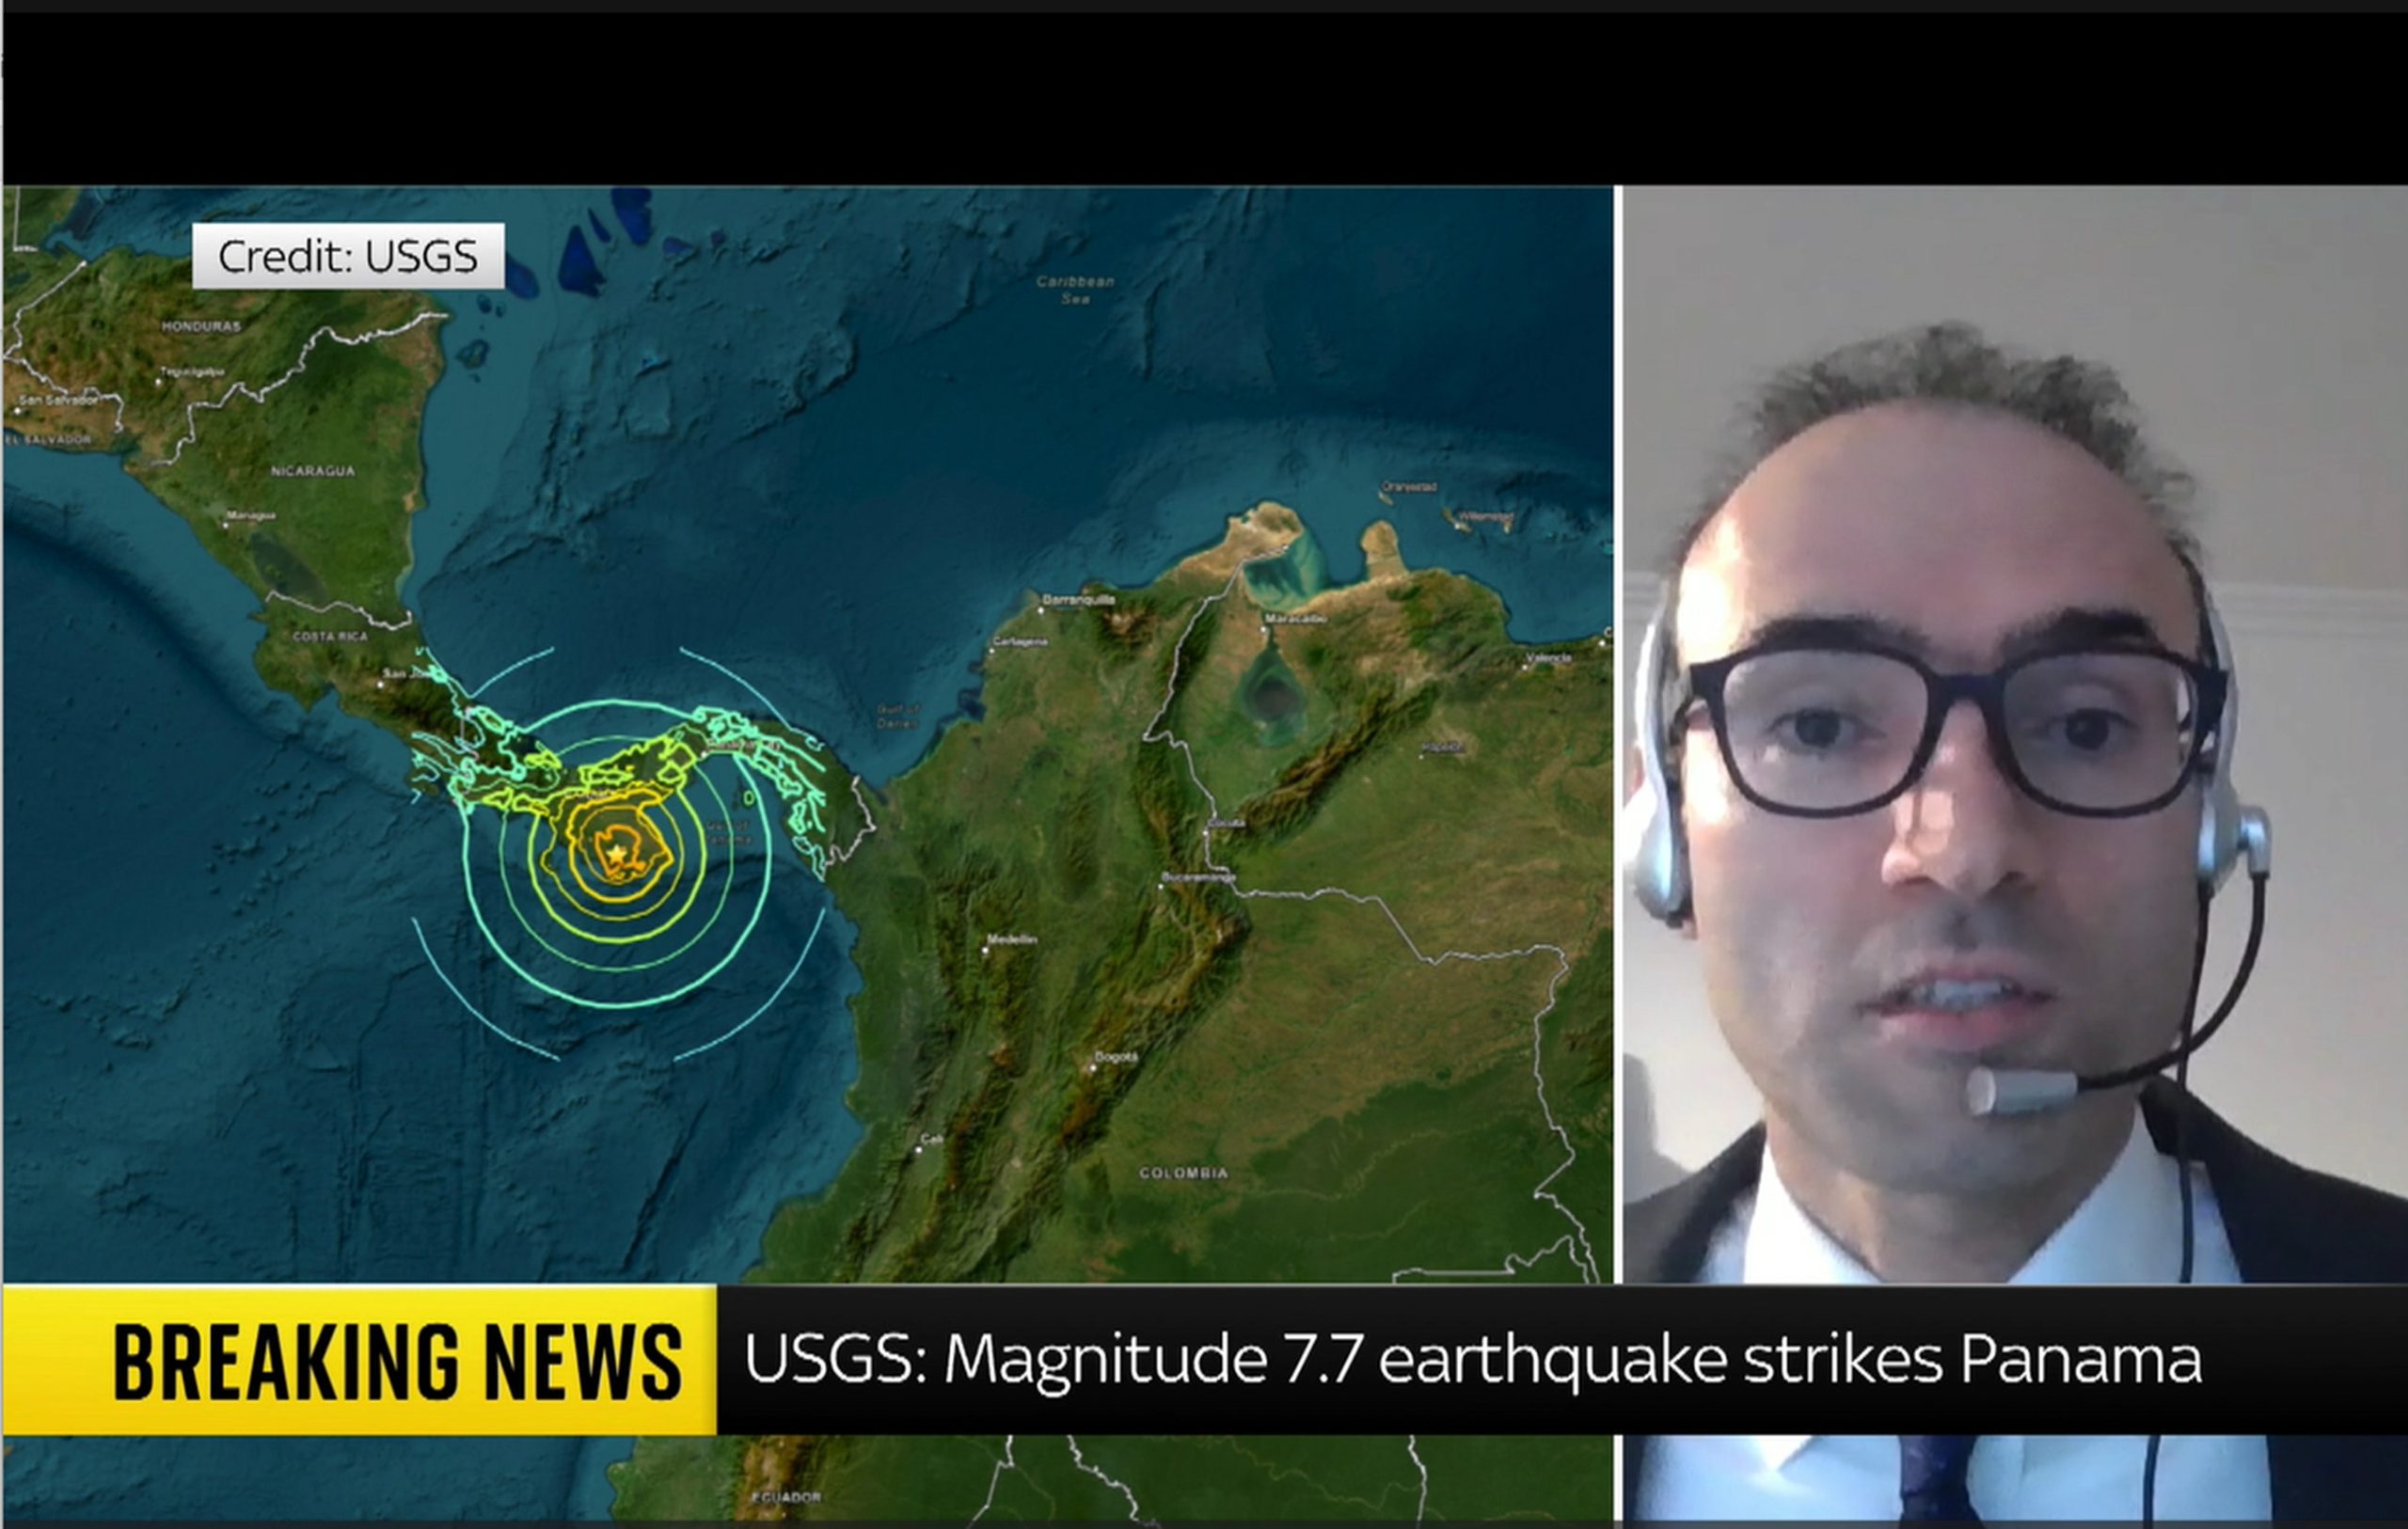
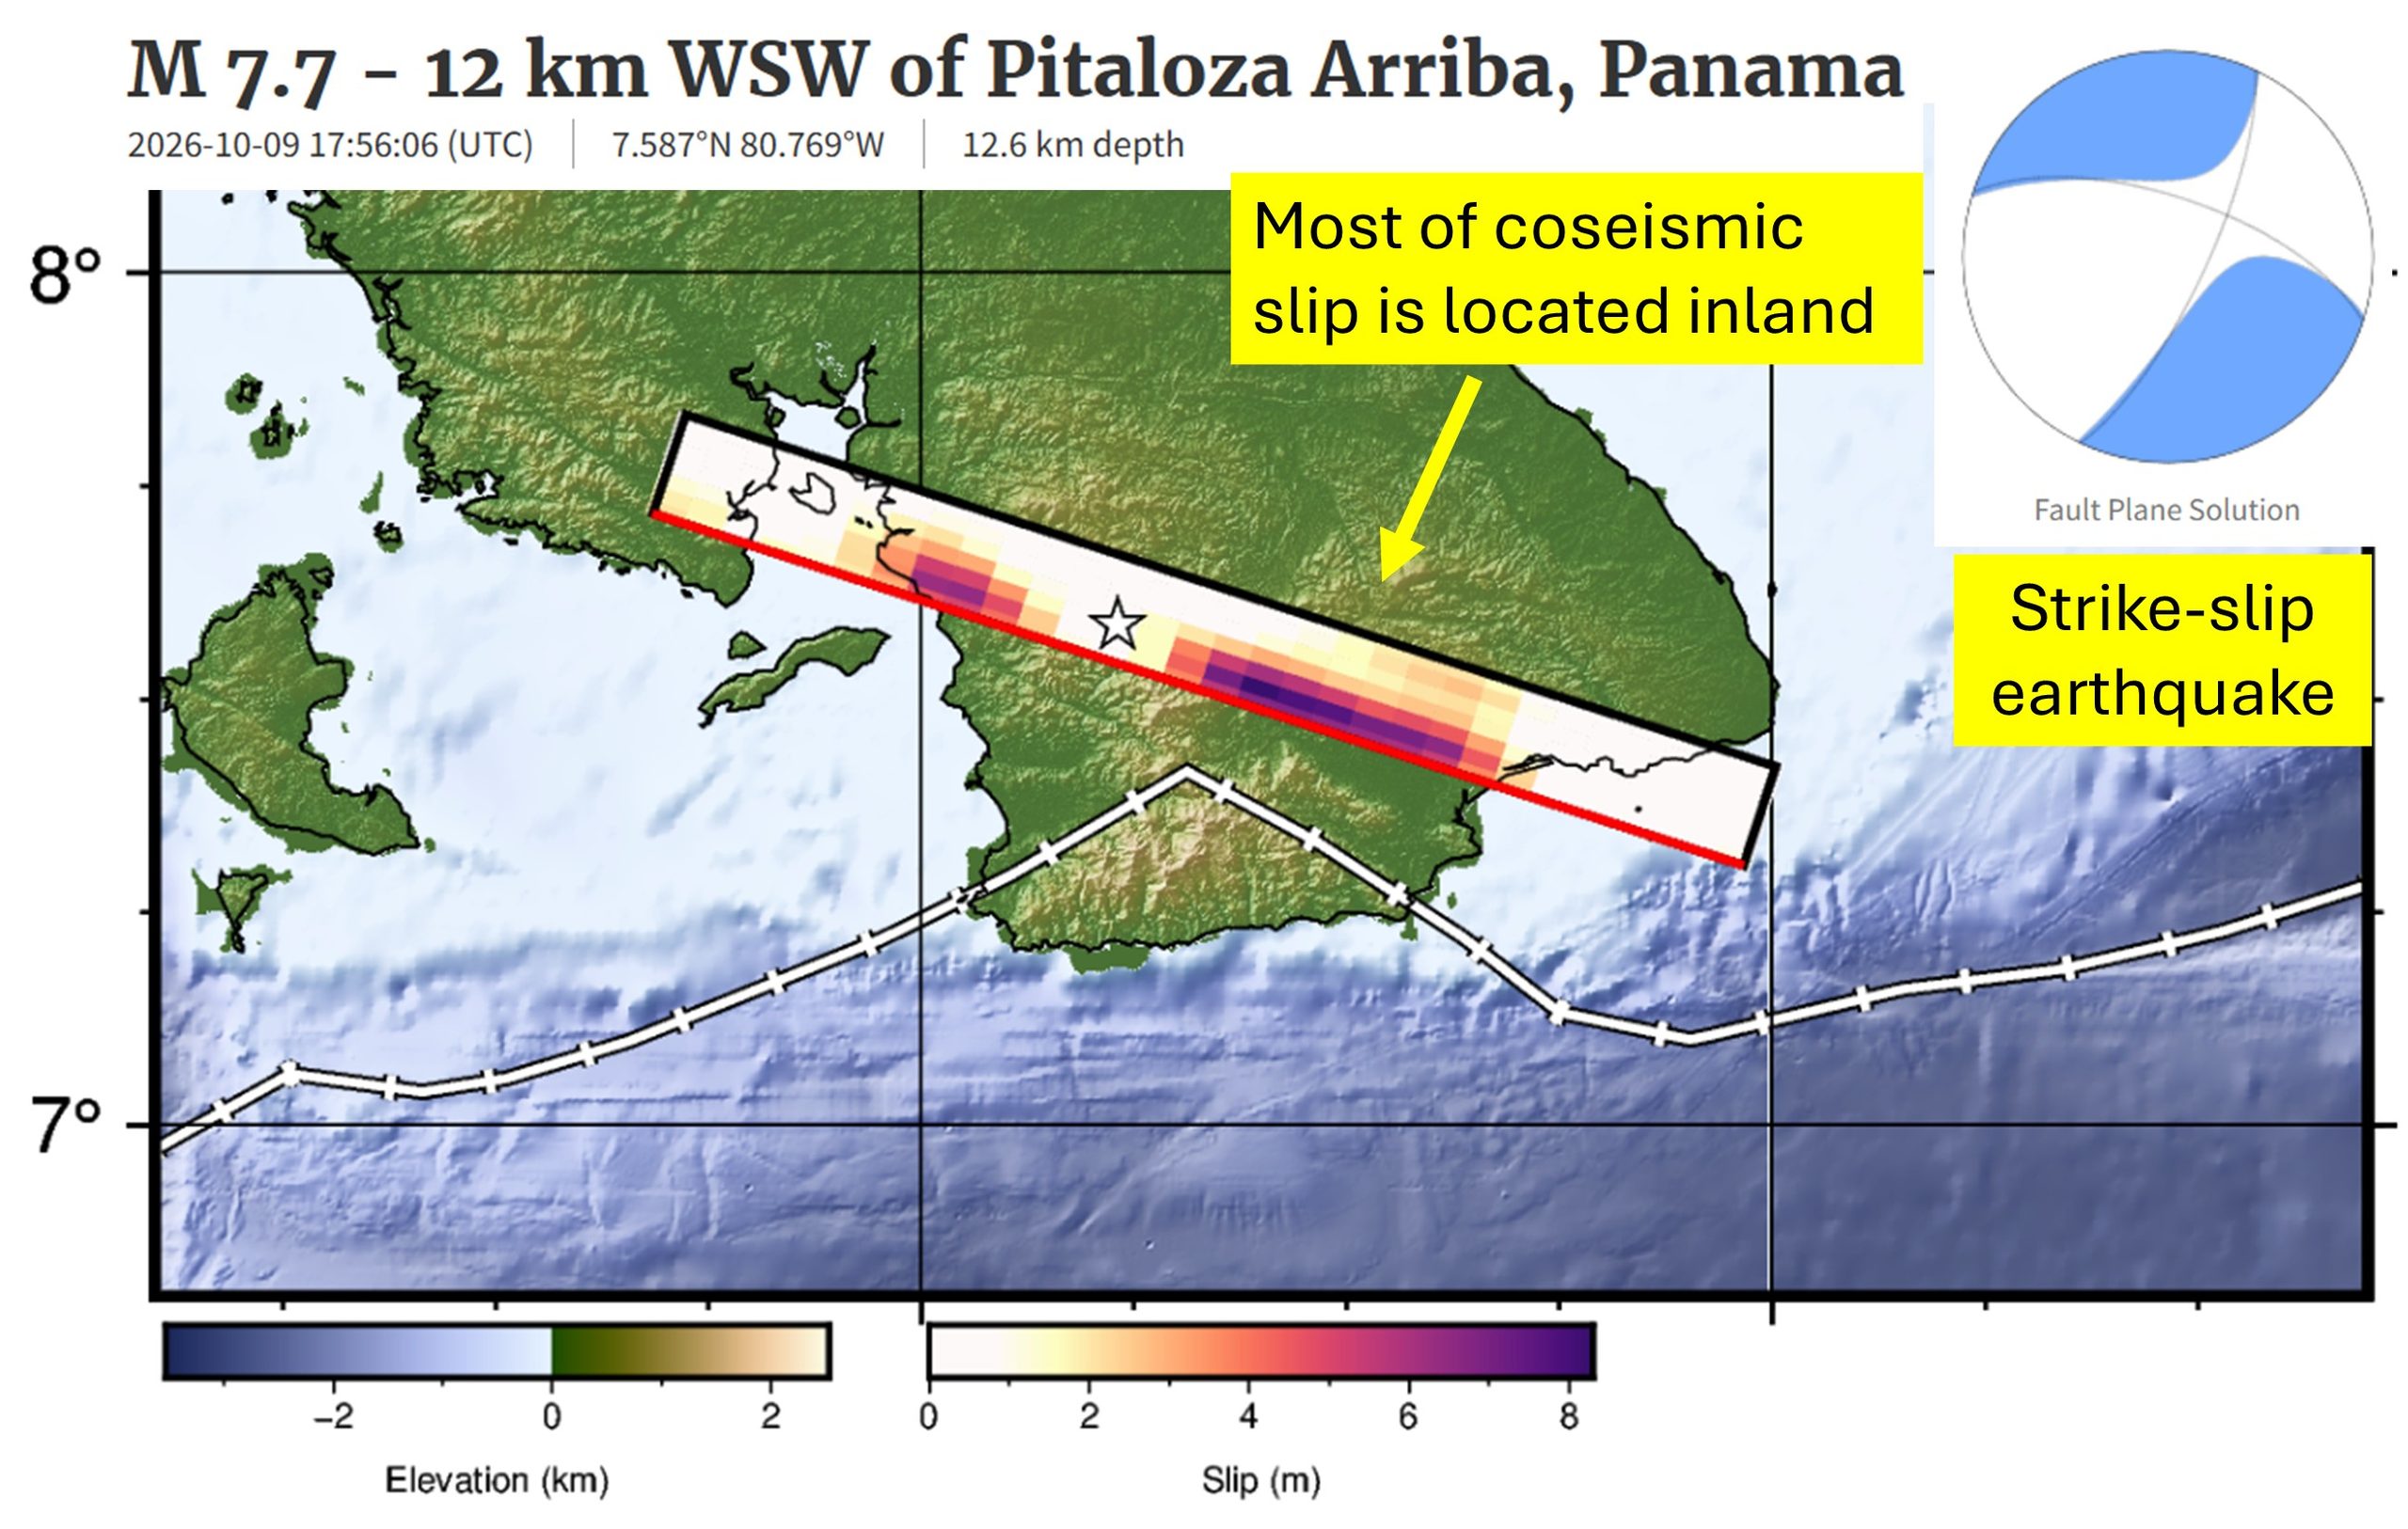
Dr Heidarzadeh’s TV interview with SkyNews on the massive M7.7 Panama earthquake on 9 October 2026
Our ocean is an incredibly vast and mysterious place. And there is no place where that is more evident than the deepest ocean area in the world: the legendary Mariana Trench. Located east of the Philippines, the Mariana Trench lies in the Mariana Archipelago in the western portion of the North Pacific. The greater area of the Mariana Trench Marine National Monument is made up of more than 95,000 square miles of ocean. Beneath these waters lie incredibly complex aggregations of submerged islands and volcanoes … and of course, an astoundingly massive trench.
Dive in with us to have your biggest questions answered about the famed Mariana Trench.
How deep is the Mariana Trench?
The deepest part of the Mariana Trench, known as Challenger Deep, is almost 36,000 feet below the ocean’s surface. For context, Mount Everest is about 29,000 feet above sea level, so the Mariana Trench is about 7,000 feet deeper than Mount Everest is tall. For one more comparison, the RMS Titanic lies at a depth of about 12,500 feet below sea level. The Challenger Deep is in waters nearly three times deeper than this ship’s final resting place.
Due to its enormous size, the Mariana Trench has at times been affectionately nicknamed the Grand Canyon of the ocean. This is certainly a picturesque image, but don’t let the mammoth size of this U.S. national terrestrial park fool you into thinking the Mariana Trench matches its size. The trench’s footprint is estimated to be 120 times larger than the Grand Canyon’s, and to reach the bottom of Challenger Deep, you’d need to descend through almost six Grand Canyons stacked on top of each other before you’d reach the seafloor.
Oh … and did we mention it’s five times wider than it is deep? It’s about 43 miles wide!
What is Challenger Deep, and how long would it take to reach it?
Challenger Deep is the deepest point of the Mariana Trench. Fewer than 30 people have ever journeyed to this area. The trek below the surface is long, dark and time-consuming, and it’s not an expedition considered lightly by scientists and explorers.
The first people to descend into the depths of this area in 1960 were oceanographers Jacques Piccard and Don Walsh, and it took them close to five hours to reach Challenger Deep. Since then, more advanced submersibles have been created, but it still takes two to four hours for modern vessels to reach such depths. For example, explorer and filmmaker James Cameron reached the seafloor in a little more than 2.5 hours in the first documented solo submarine dive to the area, and it took oceanographer Dr. Dawn Wright about four hours in 2022. It is crucial that these submersibles descend slowly and steadily beneath the surface, as the immense water pressure compounds with every mile a submersible descends. Speaking of pressure …
Get Ocean Updates in Your Inbox
Sign up with your email and never miss an update.
What is the water pressure at the bottom of the Mariana Trench?
If you thought the depth of the Mariana Trench was its only jaw-dropping feature, think again. Water pressure is one of the most important factors affecting deep-sea life. In the ocean, pressure increases by one atmosphere for every 33 feet (10 meters) of depth. One atmosphere (a unit of measurement for pressure equivalent to average air pressure at sea level) is equal to about 14.7 pounds per square inch (PSI), which is the approximate standard atmospheric pressure at sea level. If you were to convert atmospheric pressure into weight, one atmosphere is about the weight of a bowling ball. Stay with me, friends.
If a vessel were to dive 2,000 feet below the surface, the pressure would equal that of 60 bowling balls stacked atop every square inch of that submersible. But 60 bowling balls is simply nothing compared to the pressure in the Mariana Trench. The atmospheric pressure at the depths of Challenger Deep is equal to about 16,000 PSI. That pressure is about the same as the weight of an entire full-grown elephant on every square inch of a submersible!
Need a more extreme comparison? If a human were to be placed at the bottom of the Mariana Trench, the pressure would be equal to that of 50 jumbo jets piled on top of a person!
Do any animals live in the Mariana Trench?
The depths of the Mariana Trench come with immense pressure and extreme darkness, but somehow, life finds a way to survive. Organisms that live at an extreme depth, like that of Challenger Deep, have to be highly adapted to low temperatures (typically just above freezing), high pressure and virtually no light at all.
Species found in the depths of the Mariana Trench might look vastly different from animals from other ocean depths because their anatomy has been refined to thrive in harsh conditions. At such great depths, these animals typically depend on chemosynthesis (using nutrient-rich waters being pumped out of hydrothermal vents) or descending detritus (dead matter that has fallen from higher parts of the ocean) for food, such as whale falls. Just a handful of these animals include species of octopuses and squids, sea cucumbers, amphipods, sea jellies, shrimp, sea worms and some wild-looking fish!
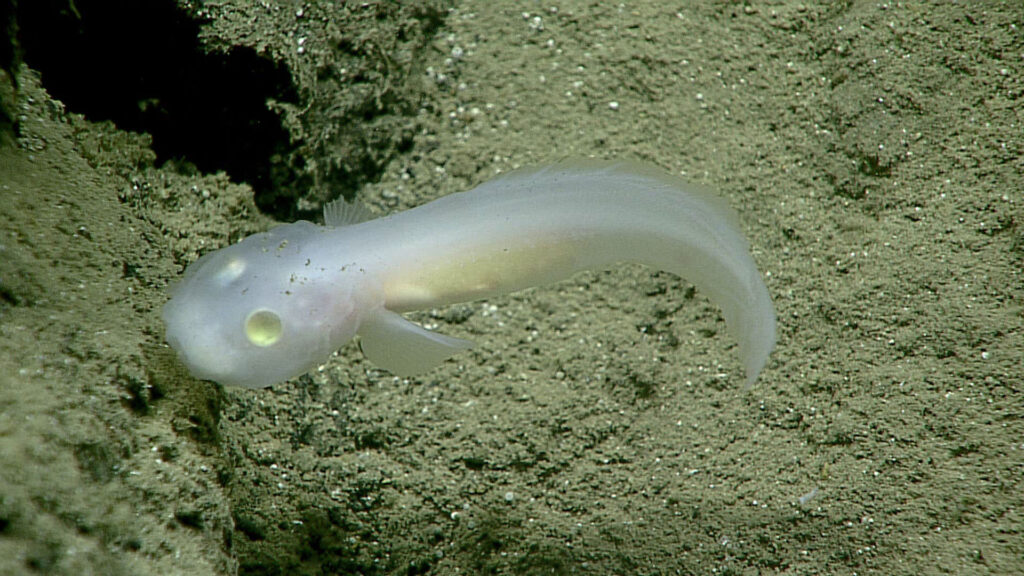
In 2025, more than 7,000 new species were discovered in the Mariana Trench, including the hadal snailfish (Pseudoliparis swirei). This is the deepest-dwelling fish currently known to science. Now, the fish has been dubbed “the Mariana snailfish.”
How was the Mariana Trench formed?
The process by which the Mariana Trench was created is a geologically fascinating one known as subduction. On the Earth’s surface, there are thin plates that cover the planet’s mantle, which is made of molten rock. If two of these plates collide, one pushes down into the Earth’s mantle while the other is pushed over the bottom plate. When this happens, a trench is formed from the drag of the bottom plate. This process can sometimes create incredibly strong earthquakes. The plates that forged the Mariana Trench’s creation are estimated to be up to approximately 180 million years old.
This trench was unknown to scientists until 1875. It was then that a team of explorers on the HMS Challenger measured the depth of the sea by simply lowering a weighted rope into the water. They were baffled when they measured that first portion of the seafloor to be five miles below the surface. And so was born the origin of some of the most daring deep-sea explorations known to mankind to date.
Is the Mariana Trench protected?
The Mariana Trench is in waters off Guam and the Mariana Islands. The region is protected from some human activities under its status as a marine monument. The creation of the Mariana Trench Marine National Monument signified that international, national and local leaders all recognize the importance of protecting this area.
However, just because the region is protected does not mean it’s not vulnerable to modern threats to ocean health. Plastic bags have been spotted in the Mariana Trench during several expeditions, highlighting the far-reaching impact of the marine debris problem. No corner of our ocean is safe from the ever-present threat of plastic pollution. The reality of a changing climate makes the future well-being of wondrous places like the Mariana Trench uncertain. What’s more: More than 70% of the global ocean has yet to be mapped. And what we don’t yet know about, we cannot wisely work to protect.
It’s up to us to work together to defend our ocean, from the sandy shores of our favorite beaches to the deepest, darkest parts of the sea. Together, we can work to protect our ocean as a whole, which ultimately helps protect treasured places like Challenger Deep.
Find out how you can join Ocean Conservancy’s wave of momentum to secure a healthy ocean and a thriving planet, forever and for everyone!
The post The Mysteries of the Mariana Trench appeared first on Ocean Conservancy.