

Promises to improve the UK’s food security feature in the election manifestos that have been published ahead of the vote on 4 July.
The Conservatives say they can provide a future where “national, border, energy and food security are put first”. Labour says that “food security is national security”.
Food supplies have been impacted by geopolitical conflicts, extreme weather events and rising costs around the world in recent months.
The UK government recently described its food security situation as “broadly stable”, but that it is facing “longer-term risks” from climate change.
Food security is “very low on the political agenda”, a food policy expert tells Carbon Brief, adding that “politicians really don’t yet get how important and how fragile the food system is”.
Below, Carbon Brief examines the range of factors tying into the UK’s food security, how they are impacted by climate change and how some of the biggest parties discuss these issues.
- How food secure is the UK?
- What have UK political parties pledged on food security?
- How does climate change impact food security?
- How can the UK food system better prepare for shocks?
How food secure is the UK?
In a broad sense, food security refers to people in a particular country or region having enough access to food.
This is achieved when “all people, at all times” have access to enough “safe and nutritious food” to meet their needs and preferences for an “active and healthy life”, according to a definition agreed at a 1996 World Food Summit.
Sufficient “access” to food depends on a number of different factors, including costs, supply, types of food, nutritional needs and where the food comes from. These factors vary on a national and local level.
Food security in the UK is “broadly stable”, according to the government’s first food security index released last month. However, this follows a “challenging period of global supply chain shocks”.
The government says that this stability should also be taken in the context of “longer-term risk from climate change”. (See: How does climate change impact food security?)
In terms of food supply, it says that the ratio of food produced in the UK to food imported from other countries was “broadly stable” in 2022, which is the most recent data available.
The UK produced 60% of its own food and 73% of “indigenous foods” that are natively grown, such as carrots and onions. This was a drop of 1% in each case compared to 2021.
Overall, the UK imports around 40% of its food, the government notes. As the chart below shows, these imports come from a range of countries, including the Netherlands, France and Ireland.

The UK produces most of the cereals, meat, dairy and eggs eaten by people across the country. It is much more reliant on imported fruit and vegetables than any other type of food, which is a similar situation to Ireland.
The chart below outlines the “production to supply ratio” of raw foods. The figures indicate, as a percentage, how much of each of the consumed food types are produced in the UK. So, for example, the UK produces 17% of the fruit and 55% of the vegetables it consumes. In contrast, the UK produces more lamb and milk than it consumes.

Different foods are imported from different countries around the world, such as citrus fruits from Spain, tomatoes from the Netherlands and India, and rice from Pakistan.
Supplies can, therefore, be hit by extreme weather abroad. This has happened numerous times, including when cold weather in Spain and Morocco led to severe shortages of lettuce, tomatoes and other crops in the spring of 2023.
In terms of production, the balance between home-grown and imported food is “integral to UK food security” as the country’s climate is unsuitable for products such as rice, bananas and tea, the government index says.
It adds that the government is “not complacent” about food security risks, especially from global “volatility”, climate change and biodiversity loss – all of which have “intensified” in recent years, it notes.
Another key aspect of food security is affordability. Food prices have risen substantially around the world in recent years.
Carbon Brief recently spoke to a range of scientists and policy experts about the reasons for this, which include geopolitical conflicts, extreme weather events, high input costs and increased demand.
In the UK, the overall cost of food and non-alcoholic drinks increased by 25% between January 2022 to January 2024, according to the Office of National Statistics.
Around half of the respondents to a Food Standards Agency survey of the general public said they are “highly concerned” about the affordability of food. This figure doubled over the course of three years – from 26% in 2020 to 51% in 2023.
The percentage of survey respondents classified as “food insecure” stood at 25% by January 2023. Food insecurity means having limited or uncertain access to adequate amounts of food, the FSA says.
These results show that “the majority of people are worried about food prices”, the FSA chief Emily Miles said in a statement.
Prof Tim Lang, an emeritus professor of food policy at City University of London, says that food security is “very low on the political agenda” in the UK. He tells Carbon Brief:
“Politicians really don’t yet get how important and how fragile the food system is and its reliance on not just fossil fuels, but over half a century of investment into a particular model of efficiency which has all been about cutting options, cutting slackness, or perceived slackness, in the food system.”
What have UK political parties pledged on food security?
In an interactive manifesto tracker, Carbon Brief recently examined the pledges made by the UK’s main political parties ahead of the election.
Both the Conservative government and the Labour opposition have been criticised by farming and food industry groups for not going far enough in their plans on food and agriculture.
The Conservatives say they can provide a future where “national, border, energy and food security are put first”. They pledge to introduce a legally binding target to enhance the UK’s food security.

They also pledge to deliver the goal for at least half of the money spent on food in schools, hospitals and other public sector services to be used for food produced locally or to “higher environmental production standards”.
This proposal from the Department for Environment, Food and Rural Affairs defined “locally produced” as food that is grown or made in the same region, or a neighbouring county, as it is consumed.
These “higher” standards of production include organic farms or farmlands showing integrated management of natural habitats and biodiversity, soil management, pollution control and nature conservation.
Queries from Carbon Brief to the Conservative press office asking for more detail on their food security policies were left unanswered.
Labour’s manifesto says that “food security is national security” and that the party will “champion British farming whilst protecting the environment”.

Similar to the Conservative goal, the party will set a target to produce half of food purchased in the public sector either locally or in a way that is “certified to higher environmental standards”.
Carbon Brief’s request for more detail on this policy from the Labour press office also went unanswered.
A letter from the National Farmers’ Union (NFU), the British Retail Consortium and other groups to the leaders of the Conservative, Labour and Liberal Democrat parties criticised the lack of focus on food security in their manifestos, the Guardian reported last week.
The letter said the groups “heard very little about food security” compared to defence and energy security in recent weeks, the newspaper said. It added:
“The lack of focus on food in the political narrative during the campaigns demonstrates a worrying blind spot for those that would govern us.”
The Conservative manifesto pledges to increase the UK’s farming budget by £1bn over the term of the next parliament.
Labour committed to maintaining England’s post-Brexit funding programme, the Environmental Land Management Schemes (read Carbon Brief’s Q&A here), but did not explicitly mention the UK’s agricultural budget.
NFU president Tom Bradshaw described this as “concerning”, the Daily Express reported. He told the outlet:
“Looking at the profitability of the farming sector, it’s on a knife edge.”
The Scottish National Party does not directly mention food security in its manifesto. It discusses agricultural funding, saying that the devolved Scottish government has received “no commitment from Westminster on any future funding for farming after 2025”.
The SNP calls for the UK government to increase farm funding and provide “certainty through multi-annual funding frameworks”.
The Liberal Democrats has pledged to introduce a “holistic and comprehensive national food strategy to ensure food security” alongside tackling food prices, ending food poverty and improving health and nutrition.
The party also promises to put an extra £1bn per year towards England’s Environmental Land Management Schemes.
How does climate change impact food security?
Extreme weather can harm food supply and production, therefore impacting food security.
Heatwaves destroy crops and endanger agricultural workers. Heavy rainfall floods fields. Drought reduces crop yields. Climate change is a key driver in the increasing frequency and severity of these extremes.
Farmers in the UK have recently been affected by “soggy and turbulent weather”, Bloomberg reported.

The UK had its eighth-wettest winter on record last year and a wetter-than-normal spring. Carbon Brief analysis shows that UK winters have become 1C warmer and 15% wetter in the past century.
Earlier this year, the Guardian reported that there could be food shortages and price rises due to this extreme weather.
This could lead to more shipments from abroad, but the newspaper said that “similarly wet conditions in European countries such as France and Germany, as well as drought in Morocco, could mean there is less food to import”.
In 2022, the heatwave which saw UK temperatures hit 40C for the first time pushed farmers “closer to the brink”, the Daily Telegraph reported at the time.
The hot, dry weather in July left farmers “watering crops which wouldn’t normally need watering such as sugar beet and maize”, the newspaper said, while “industry chiefs warned that very hot and sunny days were starting to stress apple trees and scorch fruit”.
It added that “fears that high temperatures will damage this year’s harvest in Britain, Europe and North America sent crop prices 7% higher last week, the biggest jump since the early days of the conflict in Ukraine”.

A rapid attribution analysis suggested that human-caused climate change had made the UK’s record-breaking heatwave at least 10 times more likely. A separate study found that climate change had made the droughts across the northern hemisphere in 2022 at least 20 times more likely.
Speaking to Carbon Brief for a recent article, Prof Andy Challinor, a professor of climate impacts at the University of Leeds, said that “climate change is beginning to outpace us because it is interacting with our complex interrelated economic and food systems”.
He added that the way food systems have been set up “has huge implications for stability and resilience – or lack thereof”.
Lang tells Carbon Brief that there is some “lip service [and] some good initiatives” to address risks from climate change and biodiversity loss, but he adds:
“There are great things going on, but they are small compared to the enormous change that needs to happen.”
How can the UK food system better prepare for shocks?
Lang says the next UK government has a “horrendous task” in tackling issues such as extreme weather, global shocks and other impacts negatively affecting food production.
He has been working on a report about UK food security and preparing for food shocks for the National Preparedness Commission, an independent body that promotes policies to prepare the UK for shocks. This is due to be released by the end of this summer.
Lang believes that a system change is necessary to deal with the range of different shocks and to tackle the food system’s contribution to climate change.
The global food system is responsible for around one-third of all human-caused greenhouse gas emissions. Within this, as much as half of those emissions come from rotted or otherwise wasted food, a 2023 study found.
In the UK, 12% of all greenhouse gas emissions come from agriculture. Livestock is by far the biggest contributor to these emissions, as shown in the chart below.

Around 70% of the UK’s land is used for agriculture. Globally, half of all liveable land is used for agriculture.
England’s National Food Strategy, published a few years ago, called for a rural land-use strategy to figure out the best ways to use land for nature, carbon sequestration, agriculture and other purposes.
The UK is due to release its delayed land-use report for England later this year. Before the general election was called, a conservative peer said the report would be published before the parliament’s summer recess.
A spokesperson for the Department for Environment, Food and Rural Affairs declined to comment on the current status of this report as it is an issue for the next government.
Food security should be a “central tenet” of this framework, the UK parliament’s Environmental Audit Committee said in December 2023.
The chart below highlights how land is currently allocated in the UK (left) and how much overseas land is used to produce food for the UK (right).

On next steps, Lang says that he would like to see a number of actions from the next government on food security. He tells Carbon Brief:
“We need a national council of food policy. We need to have high priority to agri-food reform. We have got to actually start a programme of educating and teaching people better how to do things. We have got to get a grip on the runaway food manufacturing industry.
“At the moment, the politics of food is just blame. And blame doesn’t get political change.”


The post Q&A: The state of the UK’s ‘food security’ in a fast-warming world appeared first on Carbon Brief.
Q&A: The state of the UK’s ‘food security’ in a fast-warming world

Brazil’s environment minister says he is “very optimistic” that the Tropical Forest Forever Facility (TFFF) – a new rainforest fund to channel private and public finance to developing nations – can meet a key $10 billion funding target this year, and is not at risk from his country’s elections next month.
The TFFF, launched by Brazil at COP30 in the Amazon last November and co-led by Norway, is intended as an alternative to traditional grant-based forest finance. The fund aims to raise $125bn in public and private capital, invest it in bond markets, and then pay countries that keep their forests standing from the annual returns. Donor contributions needed to get it going have tailed off after an initial burst.
Speaking to Climate Home News on the sidelines of Climate Week in New York, Brazilian environment minister João Paulo Capobianco pointed out that in less than a year since its official launch, the TFFF has already secured $7.3bn from governments.
“How many other initiatives can say that?” he asked. “Of course, if you have $7 billion, it’s easier for more countries to consider their own contribution. And not just countries – non-governmental organisations also. We are expecting even more support.”
-
As El Niño intensifies, we should be investing more in the world’s farmers
Finance to help agriculture adapt to a hotter world and more extreme weather is vital for food security – but new data shows it’s on a downward trend -
COP31 attendees told not to interfere in Türkiye’s “internal affairs”
Amnesty International says the provision in the hosting agreement could have a “chilling effect” on free expression in Antalya -
Threatened by rising seas, small islands secure right to keep their statehood
Efforts to protect marine ecosystems and coastal communities have risen up the political agenda at the UN General Assembly in New York



As its initial target, the TFFF aims to raise $10bn in seed capital from governments by the end of 2026, and still needs to fill a gap of $2.7bn. Its backers say that for each dollar in public funding, they can secure $4 from the private sector. Critics say the $10bn goal barely covers the fund’s expenses and would not allow it to make any significant payments to forest countries.
Because setting up its financial architecture, raising the starting capital and making the first investments will take time, experts say the TFFF is unlikely to generate any payments for developing countries before 2028.
Seeking new pledges
Capobianco told Climate Home News that Brazil is still in talks with potential new contributors to the fund, among them China, Korea and Japan, and said he hoped to see more pledges announced at the upcoming biodiversity and climate COPs in October and November. The Netherlands is expected to up its first small contribution and Canada may also come in, according to other sources close to the TFFF.
Because the fund was not created as part of the UN climate talks and is hosted by the World Bank, developing countries can contribute without taking on wider donor responsibilities for climate finance. Brazil and Indonesia – both large emerging rainforest nations – have each pledged $1bn to the TFFF.
Earlier in September, the UK became the latest country to pledge funding – promising a loan of £400 million (about $540 million). Capobianco welcomed the contribution and noted that Britain has also said it will keep “under review” the possibility of putting in more.
Currently the largest donor is Norway, which announced a $3bn pledge last year at COP30 in Belém. However, that pledge came with conditions, among them that the fund must reach $10bn in sponsor capital by 2026, and that Norway’s contribution can’t make up more than 20% of that total. Over the longer term, this means the fund must raise $15bn from governments to unlock Norway’s full investment.
Comment: UK’s budget juggling trick with rainforest loan for bus-fare cap needs transparency
Speaking at a forest finance event in New York, Norway’s environment minister Sigrun Aasland said the country’s pledge was made not “only out of solidarity but because of shared interests”, adding that protecting rainforests is critical for climate and biodiversity goals as well as for national security.
“Tropical deforestation matters to people in the Amazon and in the Congo. But let’s not forget that it also matters to global food production and to the cost of living in Oslo or in London,” she said.
At the event, Guyana’s minister of natural resources Vickram Bharrat said the TFFF is “one in a menu of options” to finance forest protection in developing countries. He added that to boost its capital “maybe we should put some amount of pressure on oil companies to contribute to the fund”.
Upcoming election “not a risk”
Brazil, which has been pivotal to getting the fund off the ground, is now heading into a national election that could see the country swing back to an anti-climate stance if right-wing candidate Flávio Bolsonaro beats current left-wing President Luiz Inacio Lula da Silva. Capobianco, however, said the election result does not pose a risk to the TFFF.
“It’s a global initiative, not a Brazilian initiative. We proposed the first idea, but nowadays it’s a global initiative,” he said. “We believe the investor countries and the tropical countries together have the possibility to continue this process.”
In Brazil, the first round of voting is scheduled for Sunday, October 4. If no candidate wins more than 50% of valid votes, a run-off ballot will take place on October 25.
COP30 roadmap to end deforestation will invite countries to draft domestic plans
In July, the TFFF board adopted a charter, which outlines the instrument’s objectives and values, including that 20% of the payments made to tropical countries will go directly to Indigenous people and local communities.
The charter also says the TFFF board may comprise up to 12 member countries during the initial phase. Currently, seven seats are filled by the Democratic Republic of Congo (DRC), Germany, Brazil, France, the Netherlands, Norway and Indonesia.
The board has also formally incorporated the Tropical Forest Investment Fund (TFIF) – the TFFF’s investment arm that will trade bonds in financial markets – hosted in Luxembourg.
The post Brazil confident new rainforest fund will reach $10bn donor milestone appeared first on Climate Home News.
Brazil confident new rainforest fund will reach $10bn donor milestone
Patrick Schröder is a senior research fellow at Chatham House’s Environment and Society Centre.
A climate summit serious about implementation cannot afford to leave major emissions reductions off the table. Yet, that is the risk COP31 faces unless it makes reducing raw material use central to the way countries decarbonise their economies.
On the sidelines of the UN General Assembly in New York last week, COP31 host Türkiye laid out proposals to accelerate emissions cuts in the next decade. Its plans include global goals to increase the share of recycled products in material use to at least 15% (up from 6.9% in 2025) and halve waste generation by 2035.
COP31 offers an opportunity to connect efforts to improve material circularity with stronger national climate commitments and mitigation pathways. But these targets could be a lot more ambitious.
The case for circularity
The Paris Agreement cannot be delivered through cleaner electricity alone. We must also reduce the emissions that are embedded in the way we extract resources, manufacture products, build infrastructure and dispose of waste.
Circularity principles are pivotal to credible mitigation pathways: designing technologies and products to last, repairing and reusing them, and reducing demand for virgin resources.
The scale of the opportunity is striking. A recent European Environment Agency review found that adopting such principles could deliver average global emissions reductions potential of 52% in the waste sector against a business-as-usual scenario, 48% in construction and buildings, 28% in transport and mobility, 26% in industry and 24% in agriculture.
-
Recycling could meet half of Europe’s critical mineral needs by 2050
A new report by an EU-funded research project says the bloc could harness its “urban mines” to reduce its dependence on China for energy transition minerals -
China maximises battery recycling to shore up critical mineral supplies
Beijing is bracing for a tsunami of spent EV batteries by taking steps to boost recycling – a strategy that could also cut its reliance on imports of clean energy minerals -
The Canadian city betting on recycling rare earths for the energy transition
As countries scramble to secure critical minerals, Kingston’s burgeoning clean tech ecosystem is attracting startups to create circular supply chains and reduce reliance on China


These figures make a compelling case for raising circularity ambitions across the economy, offering the promise of far more than better recycling bins.
In fact, recycling minerals used in cleantech equipment, for example, illustrate the extent of the emissions savings available. The carbon footprint of minerals and metals recovered from secondary sources is up to 80% lower than those produced from new mining and processing, according to the International Energy Agency.
A major EU-funded project estimates that recovered materials could substitute up to 56% of Europe’s primary critical raw material requirements by 2050, provided they achieve the necessary quality. The main takeaway goes beyond Europe: yesterday’s products can become tomorrow’s strategic resources while mitigating climate change.
In this light, a target to increase the share of recovered material use to 15% isn’t enough.
The evidence-based Circularity Gap Report found a 17% target by 2032 is possible and could unlock additional emissions reductions amounting to several gigatonnes of CO2.
Reducing material demand
A higher circularity metric is only part of the answer, however. An economy can increase its recycling rate at the same time as extracting more primary materials if total material demand keeps growing.
The tougher issue governments need to address is identifying what reductions in primary material use are needed.
The Circularity Gap Report uses an indicative benchmark of eight tonnes of virgin materials consumed per person annually. This is already being translated into policy: Germany’s 2024 circular economy strategy aims to reduce primary resource consumption, with the German Federal Environment Agency identifying six to eight tonnes per person as an ambitious target.

Reducing primary material demand will require a closer integration of energy and resource policies. Efficient EVs charged with solar power can complement better public transport and walkable cities, while batteries designed to be repaired and reused for stationary energy storage before being recycled will reduce the materials footprint of transport and clean energy services.
Coordinated infrastructure development and urban planning can prevent unnecessary overbuild, while renovating existing building stock reduces demand for new steel, cement and aluminium, which are emissions-intensive to produce. Connecting industrial waste heat to district heating networks can further reduce energy demand and emissions.
What governments should agree at COP31
COP31 can translate this approach into three concrete commitments.
First, governments should agree a stronger circularity ambition, supported by material-footprint indicators and milestones. The presidency should seek recognition of these priorities in negotiated outcomes, alongside concrete delivery partnerships under its COP31 Action Agenda.
Second, countries should include quantified circular economy measures in their updated nationally determined contributions (NDCs) and implementation plans. Such measures should include reuse, material efficiency and circularity targets, as well as transparent estimates of emissions savings that avoid double counting across sectors. By the end of 2025, countries had developed 101 national circular economy roadmaps and action plans, yet these often remained disconnected from their NDCs.
-
Self-taught mechanics give second life to Jordan’s glut of spent EV batteries
As EV sales boom in Jordan, a lack of formal infrastructure for dealing with end-of-life batteries is leading to some innovative solutions -
Indian start-ups mine e-waste for battery minerals but growing industry has a dark side
Recycling e-waste can unlock a vast and sustainable supply of transition minerals but in India the sector relies on a neglected informal economy


Third, climate finance should support the delivery of circular solutions such as material recovery at scale, investments into circular critical mineral value chains beyond mining, developing a circular plastics economy, and designing buildings and cities that support material reuse. Developing countries need technology, affordable finance and support to deliver these ambitions, including for the informal workers whose livelihoods depend on recovering and recycling materials.
The test for COP31 is to reach an agreement that can start the transformation of our production and consumption systems and how they are financed.
A headline circularity target will achieve little without policies that address absolute resource demand and deliver measurable emissions cuts. But COP31 offers an opportunity to make circularity a central element of climate policy, with targets strong enough to matter and institutions equipped to deliver them.
The post COP31 must aim higher to cut emissions from the use of materials appeared first on Climate Home News.
COP31 must aim higher to cut emissions from the use of materials
An exceptional El Niño is building. The World Meteorological Organization (WMO) says it has intensified to very strong levels and is likely to last at least through February 2027. If its current trajectory holds, it could become stronger than anything seen since WMO monitoring began four decades ago.
That is bad news for agriculture. El Niño – a naturally occurring weather phenomenon – can scramble rainfall patterns across the world, bringing drought to some regions and floods to others. And this time it is unfolding against the backdrop of a significantly hotter climate, with farmers already contending with unreliable growing seasons, extreme heat and less predictable rainfall because of global warming.
El Niño expected to bring next record-hot year as soon as 2027
We are seeing the consequences already. In Sri Lanka, drought linked to El Niño has dried wells and reservoirs and cut into crops and farmer incomes. Indonesia is experiencing its worst wildfire season in 11 years, with prolonged drought and extreme heat exacerbated by El Niño. And in Peru, authorities are preparing for the opposite extreme: intense rains, flooding and landslides which the national civil-defence agency says could affect around 1.2 million people.
These impacts will multiply as El Niño intensifies.
And yet, just as the risks to food production are rising, the money available to help farmers withstand them is shrinking.
10% funding decline in 2024
A forthcoming analysis from the Food and Agriculture Organization (FAO) shows that climate-related development finance for agrifood systems is moving in the wrong direction. In 2024, the latest year for which data is available, it fell by 10 percent compared with a 2 percent overall decline. The sectors that put food on our tables — crops, livestock, forestry and fisheries — received just 5 percent.
Yet this is precisely the moment when climate investment in agriculture needs to grow, not shrink. It can help communities adapt, build resilience and protect food security, while unlocking larger flows of public and private finance. Agriculture feeds us, supports the livelihoods of well over a billion people, and is often the first sector hit by drought, floods and extreme heat. Cutting that investment now is a false economy.
One failed harvest can plant the seed for the next crisis, forcing farmers to eat the seed they have saved for planting, sell livestock or tools, or take on debt. It can also deepen food insecurity, disrupt supply chains and drive up prices, showing up months later in supermarket aisles far away.
The Central American Dry Corridor, stretching through much of the region, shows both how exposed farmers are, and what investment can do. Based on an analysis of 41 years of satellite observations, FAO finds that some crop and pasture areas there face more than a 50 percent chance of agricultural drought over the coming months.
About half of Central America’s 1.9 million producers of maize, beans and other basic grains live in the Dry Corridor. Many grow food both for sale and for their own families. When a harvest fails, they lose both income and dinner.
El Salvador project conserves water and soil
In El Salvador, which lies within the Dry Corridor, more than 50,000 farmers have adopted practices to better withstand drought and increasingly unreliable rainfall through RECLIMA, a project financed by the Green Climate Fund and implemented by FAO in partnership with the government of El Salvador. It has substantial national co-financing, including from the country’s Environmental Investment Fund.
El Niño can intensify El Salvador’s annual mid-season dry spell, known as the canícula, turning it into a longer, harsher drought just as maize needs water most.
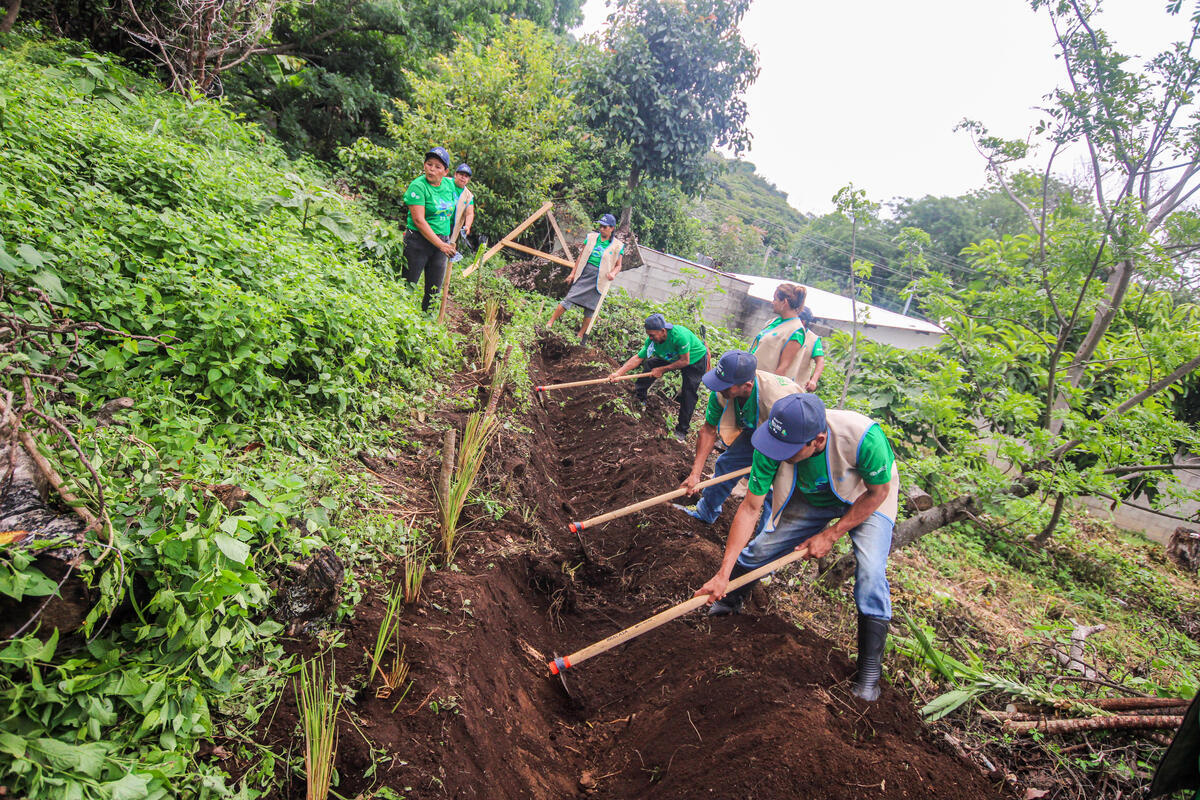
For María Cristina Corvera de López, a second-generation farmer in rural Nahualapa, adapting means changing how every drop of rain is captured and used. She plants trees alongside her crops to provide shade and minimise evaporation and uses simple irrigation channels and a homemade drip system to conserve water. Instead of burning stalks, leaves and husks after harvest, as generations before her did, she turns them into mulch to hold moisture in the soil.
“The effects of climate change are a constant challenge,” she says. But the new techniques have made her farm more resilient to El Niño as well. Where she once harvested about 50 bags of maize per acre, she now gets around 80, even during droughts. It’s enough to feed her family and sell the surplus.
Managing risk now cuts future costs
Together, these adaptations can mean the difference between losing a crop and getting through a dry season with enough food, seed and income to plant again. They are also the result of climate finance invested before disaster strikes.
RECLIMA shows what that kind of adaptation investment can buy. Adaptation accounted for 45 percent of climate-related development finance to agrifood systems in 2024, and multilateral development banks are directing more agricultural finance towards resilience. That shift reflects a growing recognition that adaptation is a form of risk management, not just a development cost.
We need much more of it. The same investments that help farmers withstand El Niño also enable them to adapt to a hotter, more unpredictable future. Cutting investment in the people who produce our food just as climate risks intensify does not save money. It simply pushes a much larger bill into the next harvest, the next food crisis, and the next El Niño.
The post As El Niño intensifies, we should be investing more in the world’s farmers appeared first on Climate Home News.
As El Niño intensifies, we should be investing more in the world’s farmers



-
Climate Change1 year ago
Guest post: Why China is still building new coal – and when it might stop
-

 Greenhouse Gases2 years ago
嘉宾来稿:满足中国增长的用电需求 光伏加储能“比新建煤电更实惠”
-
Greenhouse Gases1 year ago
Guest post: Why China is still building new coal – and when it might stop
-

 Climate Change2 years ago
嘉宾来稿:满足中国增长的用电需求 光伏加储能“比新建煤电更实惠”
-

 Renewable Energy11 months ago
Sending Progressive Philanthropist George Soros to Prison?
-
Climate Change2 years ago
Bill Discounting Climate Change in Florida’s Energy Policy Awaits DeSantis’ Approval
-
Greenhouse Gases1 year ago
嘉宾来稿:探究火山喷发如何影响气候预测
-

 Climate Change2 years ago
Analysis: China’s CO2 falls 1% in Q2 2024 in first quarterly drop since Covid-19