
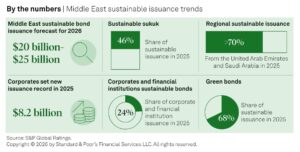
Sustainable bond issuance in the Middle East is expected to remain strong in 2026. S&P Global Ratings projects regional issuance will reach between $20 billion and $25 billion next year. This outlook comes after a year marked by trade volatility and global uncertainty. Despite those pressures, investor appetite in the region remained resilient.
In 2025, conventional bond issuance by corporates and financial institutions in the Middle East grew by 10%–15%, reaching $81.2 billion. At the same time, sustainable bond issuance in the region increased by about 3%.
This contrasts sharply with global trends. Worldwide sustainable bond issuance declined by 21% in 2025. The Middle East, therefore, outperformed the broader global market.
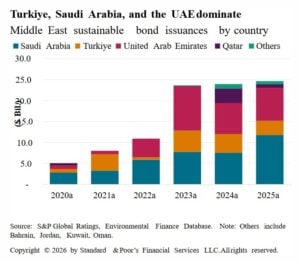
Growth in 2025 was largely supported by the Gulf Cooperation Council (GCC) countries. Saudi Arabia and the United Arab Emirates (UAE) were especially important. Their strong activity offset a slowdown in Turkiye.
Issuance Concentrated in Three Countries
Sustainable bond activity in the Middle East remains highly concentrated. Turkiye, Saudi Arabia, and the UAE captured more than 90% of the sustainable bond market in the region.
The bond market itself is mainly driven by Saudi Arabia and the UAE. Together, they accounted for a combined 80% of sustainable bond issuance by value in 2025.
Turkiye plays a different role. Sustainable loans dominate the market in that country rather than bonds. In fact, sustainable loan issuance in Turkiye represented about 60%–65% of the regional market by value, and 70%–75% by volume.
In 2025, labeled bond issuance slowed sharply in Turkiye. Banks reduced their activity in the bond market. However, renewable energy projects increased in both bond and loan markets. Wind and solar capacity growth could support issuance again in 2026.
In Saudi Arabia and the UAE, issuance remained resilient across markets. Volume stayed strong even during periods of volatility.
Sustainable Sukuk Breaks Records
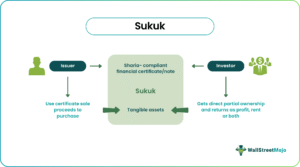
One of the most notable trends is the rapid growth of sustainable sukuk. Sustainable sukuk are designed to fund projects that have environmental or social benefits, while complying with Shariah principles.
Total sustainable sukuk issuance in the Middle East reached a new record of $11.4 billion in 2025, compared with $7.9 billion in 2024. This type of financing now accounts for more than 45% of regional sustainable bond issuance by value and more than 40% by number of issuances in 2025.
This represents a major increase from the end of 2024, when sustainable sukuk made up 33% of value and 24% by number. Saudi Arabia and the UAE continue to lead sukuk issuance.
Guidance published by the International Capital Market Association (ICMA) in April 2024 on green, social, and sustainability sukuk has helped improve transparency. Regulatory and government initiatives may further support growth in 2026.
Sukuk structures are particularly important in the GCC, where Islamic finance plays a central role in capital markets.
Renewable Energy Drives Issuance
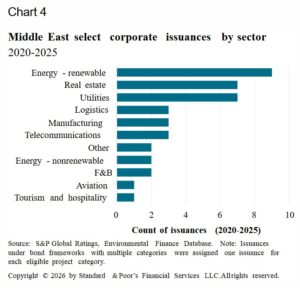
Renewable energy remains the main use of proceeds in the region’s sustainable bond market. Solar energy is especially popular in GCC countries because of high solar irradiance. Large-scale renewable projects require significant capital. And green bonds and sukuk help finance these investments.
Energy companies such as Masdar in the UAE are expected to continue issuing green bonds to expand renewable portfolios.
Saudi Arabia is preparing to commission the world’s largest utility-scale green hydrogen project in Neom in 2026. The project will use solar, wind, and energy storage systems. It forms part of Saudi Vision initiatives aimed at diversifying the economy and reducing reliance on hydrocarbons.
Other common project categories include:
- Energy efficiency
- Green buildings
- Sustainable water management
- Clean transportation
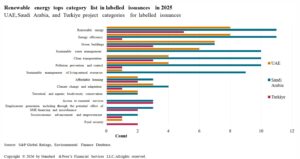
Climate adaptation projects are still limited but growing. In Saudi Arabia, the sovereign has included climate adaptation in its green bond framework. Banks in the UAE and Saudi Arabia have also started financing adaptation projects.
New Bond Types Emerging
The Middle East sustainable finance market is evolving beyond traditional green bonds.
Transition finance is expected to grow in 2026. This is particularly relevant for hydrocarbon-linked economies. Issuers with credible transition strategies may use transition bonds or transition loans. These can finance emissions reductions and methane abatement projects.
Guidelines for sustainability-linked loan financing bonds (SLLBs) were introduced in June 2024. These instruments allow issuers to finance portfolios of sustainability-linked loans aligned with international principles.
In 2025, Emirates Islamic issued the first SLLB sukuk in the region. This may encourage more banks to follow.
Blue bonds are also gaining attention. The UAE has positioned itself as a leader in this segment, in line with its UAE Water Agenda 2036.
In August 2025, First Abu Dhabi Bank issued the region’s first blue bond by a financial institution. In January 2026, Emirates NBD raised $1 billion through a dual-tranche issuance, including $300 million in blue bonds and $700 million in green bonds.
Eligible blue projects include:
- Offshore wind
- Wetland and coral reef conservation
- Flood and drought-resilient infrastructure
- Sustainable water and wastewater management
Digital bonds may also emerge. In January 2026, Emirates NBD issued the largest UAE dirham-denominated digital bond listed on Nasdaq Dubai. Although not labeled sustainable, digital issuance could improve liquidity and attract foreign investors.
Stronger Rules Lay the Foundation for Growth
Finally, regulation is gradually strengthening across the region. In April 2025, Saudi Arabia’s Capital Markets Authority published guidelines for issuing labeled debt instruments. These align closely with ICMA standards.
In the UAE, Federal Decree Law No. 11 (2024) requires all entities to measure, report, and reduce greenhouse gas emissions by May 2026. The law supports the country’s Net Zero 2050 strategy. Also, Turkiye is developing its own Green Taxonomy, largely based on the European Union framework.
Although there are currently no fully implemented local taxonomies in the region, policymakers are considering classification systems similar to Singapore’s “traffic light” approach. This system classifies activities as Green, Amber (transition), or Red (ineligible).
Such frameworks may help clarify which activities qualify for sustainable financing and could boost investor confidence.
What Will Power the $25B Forecast?
S&P Global expects issuance between $20 billion and $25 billion in 2026. The key drivers include:
- Continued renewable energy expansion
- Growing sustainable sukuk issuance
- Increased transition finance activity
- Regulatory developments and disclosure requirements
- Rising attention to climate adaptation and water resilience
However, sustainable finance volumes remain below what is needed to meet the region’s environmental challenges. Climate adaptation and water scarcity are still underfinanced. Private and blended finance may play a larger role in closing this funding gap.
Despite global volatility, the Middle East sustainable bond market has shown resilience. Strong issuance from Saudi Arabia and the UAE, combined with innovation in sukuk and new bond types, positions the region for continued growth in 2026.
If projections hold, the region could surpass $25 billion in sustainable bond issuance next year, reinforcing its expanding role in global sustainable finance.
The post Middle East Sustainable Bonds Set to Hit $25B in 2026 as Sukuk Surge appeared first on Carbon Credits.
For most businesses, the emissions that matter most sit outside their own walls. Scope 3 emissions, everything generated across your value chain, from the suppliers who make your inputs to the customers who use your products, typically make up the majority of a company’s total carbon footprint. Under the Corporate Sustainability Reporting Directive (CSRD), those value-chain emissions now have to be measured and disclosed with a rigour that spend-based estimates alone struggle to satisfy. This guide sets out how to improve Scope 3 data accuracy for CSRD: the calculation methods open to you, how to move from estimates to verified supplier data, and how to govern that data so it holds up to audit.
![]()
A carbon credit is a commitment that extends well into the future. The tonne of CO₂ compensated for today from a nature-based carbon project must remain out of the atmosphere for good, which means the forest behind the credit has to remain standing long after the transaction is complete. For any buyer, this raises a defining question: What ensures that the forest endures?
![]()
What replaced the cheap REDD credit on the boardroom slide deck, and why procurement is leading the rewrite.
Three years ago, a corporate slide showing a portfolio of cheap REDD+ credits could carry a board meeting. The number was big, the price was low, and the press release wrote itself. Today, that same slide gets sent back with questions. The questions are uncomfortable, the answers are unclear, and your general counsel is suddenly in the room.
Conventional carbon offsets are not dead. The voluntary carbon market retired 202 million tonnes in 2025, and the Morgan Stanley Institute for Sustainable Investing survey published in January 2026 confirmed that interest from corporate buyers remains substantial. What changed is the credibility threshold. The integrity floor has risen, the disclosure scrutiny has tightened, and the buyer profile has shifted. This article tracks what changed, what sophisticated buyers now ask before signing, and what serious corporates are putting on the board slide instead.
What boards used to buy, and why it stopped working
The 2020 to 2022 model was simple: buy a large tranche of avoidance credits at low single-digit prices, retire them against the company footprint, announce the carbon-neutral claim, and move on. Most of those credits came from REDD+ projects, renewable energy installations in countries where the renewable energy was already economic, or methane projects with thin documentation.
Several things broke that model. Academic research published in 2023, including a widely cited Science paper, found that the majority of REDD+ credits issued under the most common methodologies did not represent additional reductions when tested against rigorous counterfactuals. The Voluntary Carbon Markets Integrity Initiative published its Claims Code of Practice, which sets requirements for what companies can credibly claim from credit use. The European Union finalised its Green Claims Directive, restricting how companies can describe products as climate-neutral. France’s Décret 2022-539 already restricts carbon neutrality advertising. California’s AB 1305 imposes disclosure requirements on any company making net-zero or carbon-neutral claims while doing business in the state.
The collective effect: the cheap credit no longer buys the announcement, and the announcement now carries litigation risk.
The integrity reset: ICVCM, VCMI, and what changed
The Integrity Council for the Voluntary Carbon Market published the Core Carbon Principles in 2023 and began assessing methodologies against them in 2024. The first methodologies received the CCP label later that year. The point of the label is to give corporate buyers a defensible quality screen they can cite in disclosure.
The Voluntary Carbon Markets Integrity Initiative complements this on the demand side. Its Claims Code of Practice defines what a buyer can say (Silver, Gold, or Platinum claims, with associated requirements) based on the quality of credits used and the underlying decarbonisation strategy. Together, CCP and VCMI build a quality stack: CCP on the supply, VCMI on the claim, with the science-based target sitting underneath both.
The reset is not a ban on offsets. It is a ratchet. Credits that meet the new bar continue to clear; credits that do not, do not. The Morgan Stanley survey found that 61% of current buyers like the CCP label concept but that supply of labelled credits remains limited. That supply constraint is now visible in pricing.
What sophisticated buyers ask before they sign
The questions on the procurement scorecard have changed. A 2022 buyer might have asked about price, vintage, and project type. A 2026 buyer asks five different questions before any of those.
- What does the counterfactual look like, and who validated it.
- What is the permanence regime, and what is the buffer pool exposure.
- What is the leakage risk, and how is it mitigated.
- What rating has the project received from the independent ratings agencies (Sylvera, BeZero, Calyx Global), and what was the rationale.
- What is the documentation discipline that survives an audit four years from now when the procurement team that signed the contract has moved on.
If the vendor cannot answer those five questions on a first call, the conversation ends. Conversely, if the vendor can answer them with documented specificity, the conversation often expands beyond a single transaction toward a multi-year engagement.
Where this leaves your near-term commitments
You probably have near-term commitments that pre-date the integrity reset. Public targets to be carbon neutral by 2025 or 2030. Product-level claims that ran in last year’s marketing. Disclosed reduction trajectories that assumed continued access to cheap credits.
You have three workable paths. The first is to re-baseline your strategy, replacing the most exposed credits with higher-quality alternatives and adjusting the public language to match what you can defend. The second is to shift the underlying spend from offsetting outside your value chain to investing inside your value chain, where reductions count against Scope 3 directly and the audit trail is cleaner. The third is to keep the strategy and absorb the risk, which is increasingly the most expensive option once you price in litigation, restatement, and reputational exposure.
Most serious buyers are choosing the second path. It moves the carbon spend from a compliance cost to a procurement and resilience investment, and it removes the central failure point of the legacy model: the disconnect between where the emissions occurred and where the reductions sat. Nature-based supply chain investments, structured under the GHG Protocol Land Sector and Removals Standard and aligned to the SBTi FLAG Guidance, are the asset class that fits this brief. They generate inventory-grade reductions, they produce audit-grade documentation, and they survive the new claim restrictions because the carbon math sits inside the value chain that the disclosure already covers.
If you are reassessing a carbon strategy under the new integrity bar, or rebuilding a board narrative that has to survive a more skeptical audience, the carbon and sustainability experts at Carbon Credit Capital can help. The Dual-Value Model gives you a defensible alternative to legacy offset purchases, with the documentation and operational integration that survives the procurement scorecard and the audit. Schedule a consultation.


-
Climate Change11 months ago
Guest post: Why China is still building new coal – and when it might stop
-
Greenhouse Gases11 months ago
Guest post: Why China is still building new coal – and when it might stop
-

 Greenhouse Gases2 years ago
嘉宾来稿:满足中国增长的用电需求 光伏加储能“比新建煤电更实惠”
-

 Climate Change2 years ago
嘉宾来稿:满足中国增长的用电需求 光伏加储能“比新建煤电更实惠”
-
Climate Change2 years ago
Bill Discounting Climate Change in Florida’s Energy Policy Awaits DeSantis’ Approval
-

 Renewable Energy9 months ago
Sending Progressive Philanthropist George Soros to Prison?
-

 Carbon Footprint2 years ago
US SEC’s Climate Disclosure Rules Spur Renewed Interest in Carbon Credits
-
Greenhouse Gases1 year ago
嘉宾来稿:探究火山喷发如何影响气候预测