
Bright sunshine, intense thunderstorms, storms up to wind force 9 – the weather during the CYRTACI journey M195 is diverse and varied. Observant eyes even witnessed mirages and waterspouts, not to mention colorful rainbows, sunrises, and sunsets, especially captivating due to the mostly unobstructed sea horizon.
Seafaring and weather are traditionally closely intertwined. The success of our research expedition is naturally dependent on the weather. For example, sediment cores cannot be taken in too rough seas. To make the most of the expedition days, there is a Meteorological Office on board from the German Weather Service, providing the ship’s crew and scientists with daily weather observations and forecasts. There, Andreas and Felix work. Andreas has been sailing on various research vessels for 14 years. Felix usually works on land in aviation weather forecasting at Hamburg Airport, and M195 is his first voyage with the METEOR.
Their workday starts every morning at 06:00. First, the overnight data is evaluated to track the weather progress. Onboard, various data such as temperature, humidity, wind, and cloud height are recorded. These automatically collected data are supplemented by observations, such as waves, and regularly sent as weather reports worldwide. After a tour around the ship to get a detailed picture of cloud cover, visibility, weather conditions, and sea state, the observations are complemented with additional data. This includes images from weather satellites and calculations from various weather forecast models, sent multiple times a day from the Marine Meteorological Centre in Hamburg to the ship. A weather forecast for the voyage area is then developed, tailored precisely to the route and research plans. Our “weather frogs” observe the weather all day, and in the evening, there is an updated weather forecast. If we were able to observe unusual weather phenomena, they willingly and vividly explain them to us. So, in addition to our main research, we also learn a bit about meteorology.
When bad weather looms, Felix and Andreas, in cahoots with the captain, tweak our route to navigate safely. We have adjusted the sequence of research stations several times to avoid storms and high waves. The entrance and exit at the Ambrakian Gulf were particularly sensitive. The passage is relatively narrow and shallow, so the 98-meter-long METEOR can only safely navigate it in calm winds and calm seas. In the Gulf, we were able to work well despite an approaching storm and avoid five-meter-high waves that had built up in the Ionian Sea.
While much of Germany has seen the first snowfall, we have weathered our last storm yesterday. With temperatures around 20 degrees Celsius and the sun reclaiming the skies, we enjoy a few more days of escaping winter’s grip in Germany before most of us from the science crew head home on Sunday.
Lasst uns über’s Wetter sprechen
Strahlender Sonnenschein, kräftige Gewitter, Sturm bis Windstärke 9 – das Wetter während der CYRTACI-Expedition ist vielfältig und abwechslungsreich. Aufmerksame Augen konnten sogar Luftspiegelungen und Wasserhosen beobachten. Und natürlich farbenfrohe Regenbögen sowie Sonnenauf- und -untergänge, die durch den freien Horizont auf See besonders gut zu verfolgen sind.
Seefahrt und Wetter sind traditionell eng miteinander verbunden. Selbstverständlich ist auch das Gelingen der CYRTACI-Expedition vom Wetter abhängig. So können z.B. bei zu hohem Seegang keine Sedimentkerne entnommen werden. Um die Expeditionstage bestmöglich ausnutzen zu können, gibt es an Bord eine Wetterwarte des Deutschen Wetterdienstes, von der aus Schiffsführung und Wissenschaft täglich mit Wetterbeobachtungen und -vorhersagen versorgt werden. Dort arbeiten Andreas und Felix. Andreas fährt bereits seit 14 Jahren auf verschiedenen Forschungsschiffen zur See. Felix arbeitet normalerweise an Land in der Flugwettervorhersage am Hamburger Flughafen, für ihn ist M195 die erste Fahrt mit der METEOR.
Ihr Arbeitstag beginnt jeden Morgen um 06:00 Uhr. Zuerst werden die Messdaten der Nacht ausgewertet, um den Wetterablauf zu verfolgen. An Bord werden u.a. Temperatur, Luftfeuchtigkeit, Wind und Wolkenhöhe erfasst. Diese und weitere automatisch erfasste Daten werden durch Beobachtungen z.B. der Wellen ergänzt und regelmäßig als Wettermeldung in die ganze Welt verschickt. Nach einem Rundgang um das Schiff, um sich ein detailliertes Bild von Bewölkung, Sicht, Wetterzustand und See zu verschaffen, werden die Beobachtungen mit zusätzlichen Daten ergänzt. Dies sind u.a. Bilder von Wettersatelliten und Berechnungen verschiedener Wettervorhersagemodelle, die täglich mehrfach vom Seewetteramt in Hamburg zum Schiff geschickt werden. Daraus wird eine Wettervorhersage für das Fahrtgebiet erarbeitet, passgenau zugeschnitten auf die Fahrtroute und die Forschungsvorhaben. Unsere „Wetterfrösche“ beobachten das Wetter den ganzen Tag, am Abend gibt es noch einmal eine aktualisierte Wettervorhersage. Wenn wir außergewöhnliche Wettererscheinungen beobachten konnten, erklären sie uns diese bereitwillig und anschaulich. So lernen wir nebenbei noch ein wenig über die Meteorologie.
Wenn sich schlechtes Wetter abzeichnet, beraten sich Felix und Andreas mit dem Kapitän und der Fahrtleitung und besprechen, wie die Route am besten geplant werden kann. So haben wir mehrfach die Reihenfolge der Forschungsstationen angepasst, um Sturm und hohen Wellen auszuweichen. Besonders empfindlich waren die Ein- und Ausfahrt beim Ambrakischen Golf: Die Fahrrinne, die den Golf mit der offenen See verbindet, ist vergleichsweise eng und flach, so dass die 98 m lange METEOR sie nur bei schwachem Wind und ruhiger See sicher passieren kann. Im Golf konnten wir dann trotz aufziehenden Sturms gut arbeiten und fünf Meter hohen Wellen ausweichen, die sich im Ionischen Meer aufgebaut hatten.
Während in weiten Teilen Deutschlands der erste Schnee gefallen ist, haben wir gestern unseren letzten Sturm überstanden. Bei Temperaturen um 20 Grad Celsius und zunehmendem Sonnenschein genießen wir noch ein paar Tage lang die Flucht vor dem Winter in Deutschland, bevor die meisten von uns aus dem wissenschaftlichen Team am Sonntag nach Hause fahren.
-


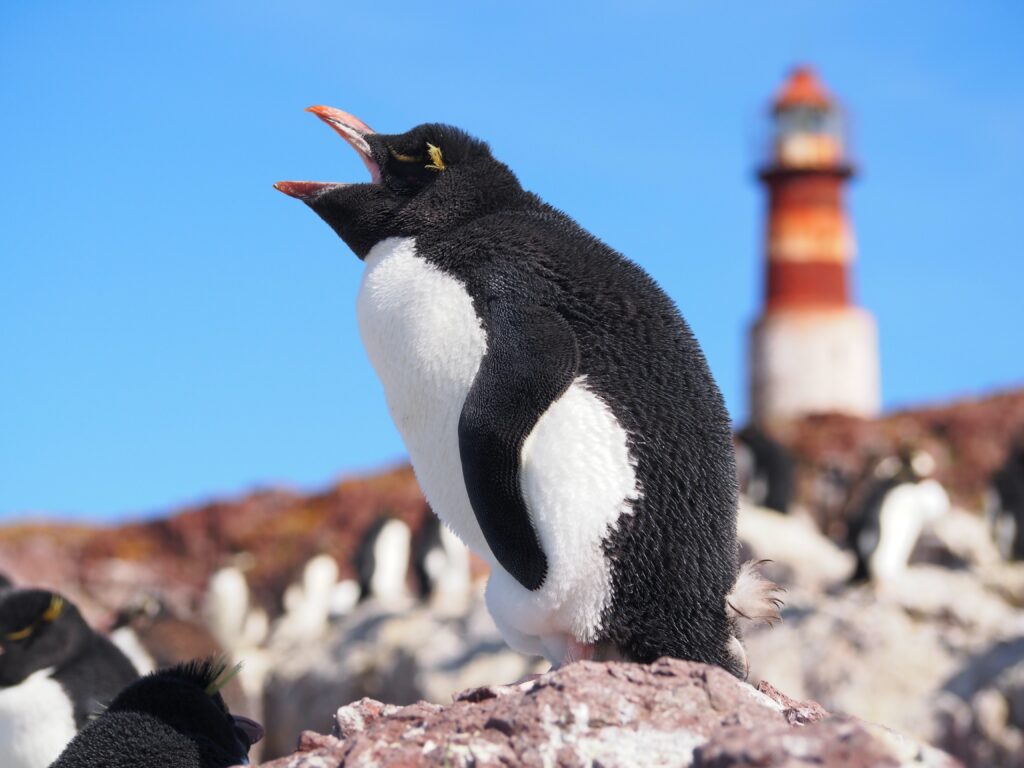
Sunrise in the Aegean Sea. Sonnenaufgang in der Ägäis. Credit: Felix Herz / OceanBlogs -

-

-


Our annual Photo Contest is officially wrapped—and wow, you delivered! More than 1,000 ocean lovers shared their incredible ocean and wildlife photos. Thank you for keeping our ocean in focus during National Ocean Month and inspiring us with your creativity.
Now it’s time to meet the favorites. See the stunning photos that captured the hearts of our judges, staff and fellow ocean lovers.
Judges Choice Winner:
“Walrus Nursing” by Richard Rothstein
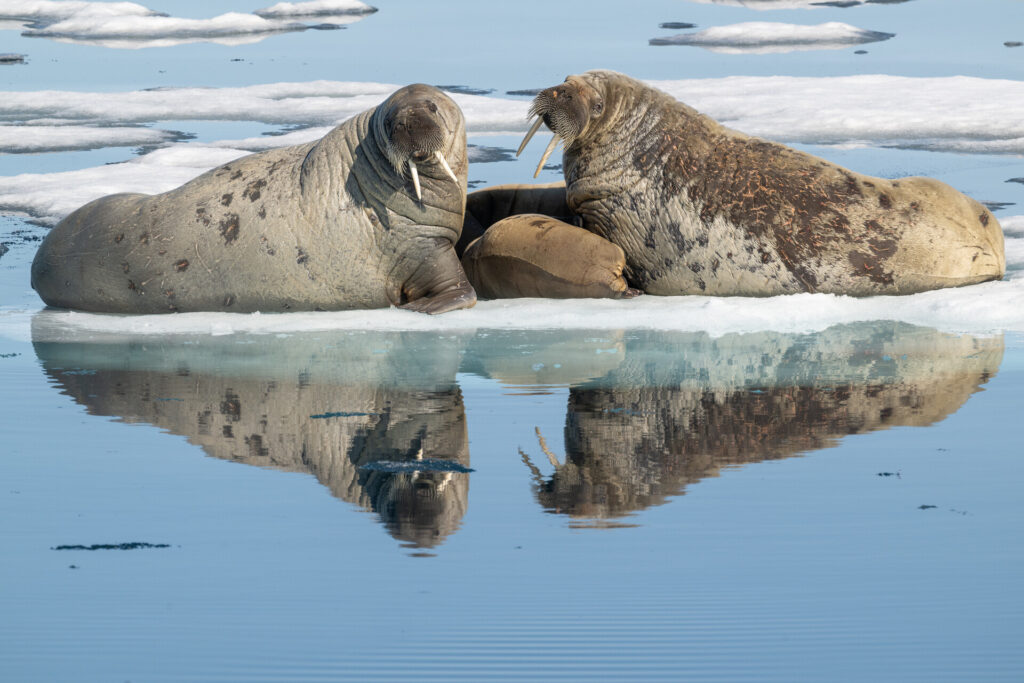
Our group was in a small skiff slowly moving among the icebergs when we came upon the scene in the image. Two female walruses were in what appeared to be a protective posture as one of the females was nursing a small calf. We remained a very respectable distance and did not approach. The walruses seemed to completely tolerate our presence as there appeared to be no alteration of their natural behavior. This was my first encounter with walruses, and it was truly an experience of a lifetime!!
A word from the judges:
“There’s such tenderness in this Arctic moment—two adult walruses framing the calf nursing between them, all mirrored in the glassy meltwater below. That reflection doubles the impact and gives the composition a beautiful symmetry, and the soft, even light shows off every wrinkle and whisker. A quiet, intimate family portrait set against the fragile backdrop of the sea ice these animals depend on.” – Angela J. Farmer
“I love this photograph! The composition is excellent with the reflections and the ice bergs in the background balancing the photograph. I also appreciate that the photographer captured this photo and it does not appear like the animals were stressed out in any way. They are acting and behaving natural in their natural habitat. Very important to me as a photographer to not disturb the animals by my presence. Good job!” – Harvey Hergett
“…Really beautiful and powerful. I loved the calm moment, the reflection and the connection between the walruses. It feels very natural, honest and emotional.” – Andrés Ballesteros
Staff Choice Winner:
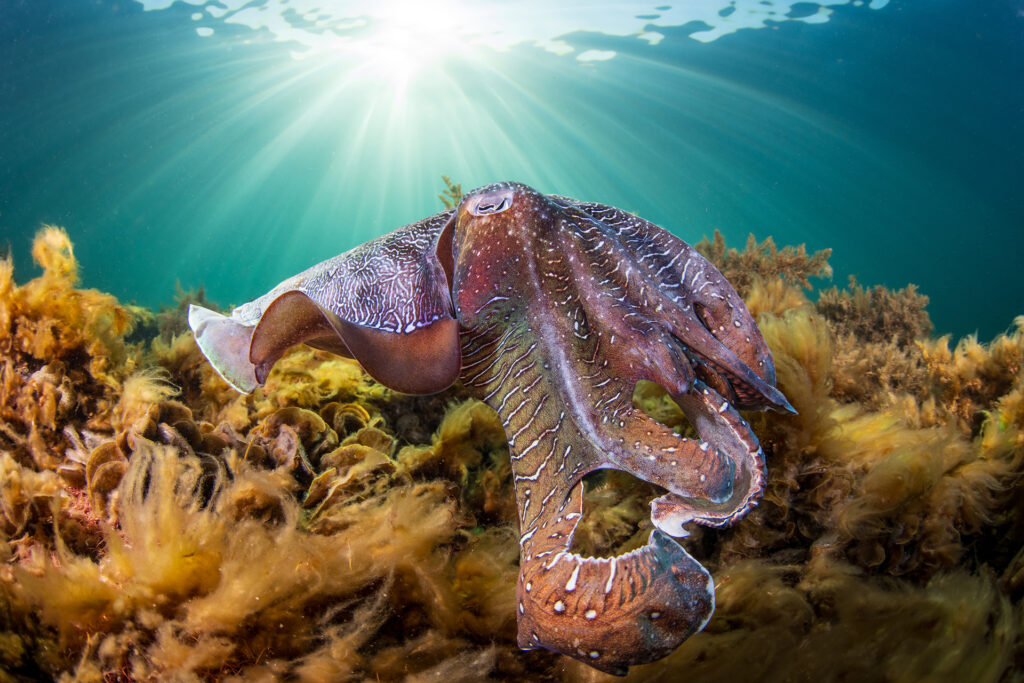
“The Lone Ranger” by Rowan Dear
(Rowan’s Instagram; Rowan’s Website)
A large male Giant Cuttlefish cruises around the shoreline of Whyalla, looking for a mate this season. Most of the Cuttlefish here are smaller and similar size to the females, however you will see some very large males who are 3-4 times the size of some males who will swim around and bully and dominate the other males and sometimes guard up to 3 females. The larger males are probably 2 years old and have been eating their way through summer waiting for the mating season in winter.
A word from the judges:
“This is an absolute showstopper—the sunburst breaking through the surface turns an ordinary dive into something almost cinematic. The cuttlefish’s intricate textures and shifting purple-to-copper tones are stunning, and the way the light rays guide your eye right down to it shows real mastery of natural underwater lighting. A rich, immersive image that makes you feel like you’re in the water with him.” – Angela J. Farmer
“I liked the angle of the shot as shooting upward on the subject gives it a more majestic feel.” – Harvey Hergett
People’s Choice Winner:
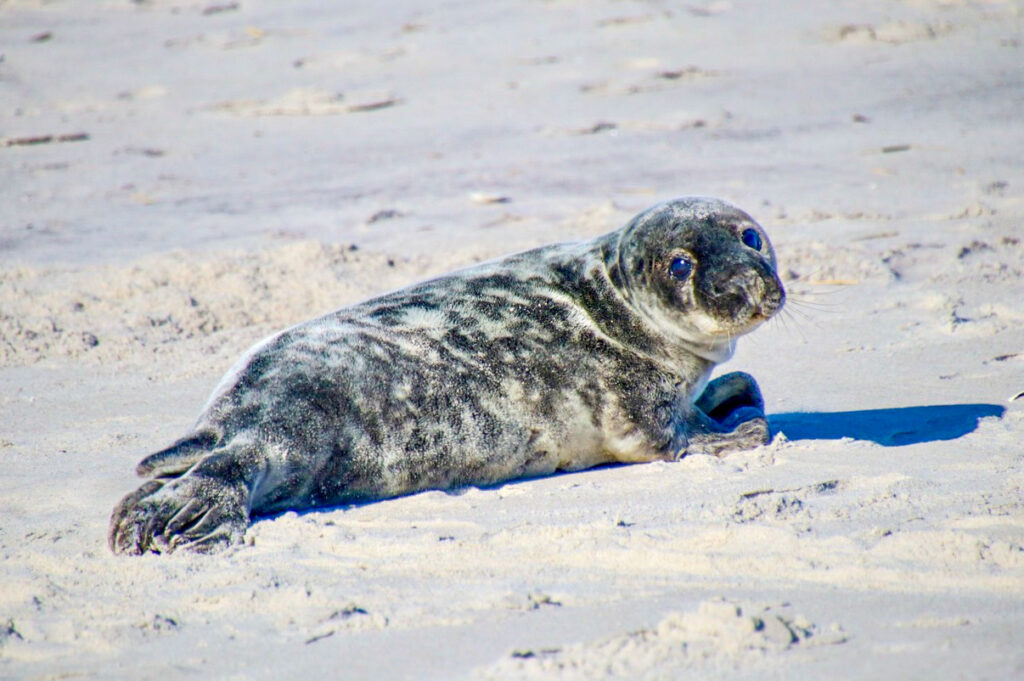
“Sweet Seal” by Nicole Pellegrino
(Nicole’s Instagram; Nicole’s Website)
This sweet seal was resting on the shore of Long Beach, NY on a bright sunny day in April 2024.
A huge thank you to everyone who entered, voted, shared and cheered on this year’s contest. And a mighty thanks to our expert judges: Angela J. Farmer, Harvey Hergett and Andrés Ballesteros. Congratulations to all our talented photographers—we can’t wait to see what you capture in 2027!
Enjoy the contest’s honorable mentions below and we’ll SEA you next year.
The post 2026 Ocean Conservancy Photo Contest Winners appeared first on Ocean Conservancy.
https://oceanconservancy.org/blog/2026/06/30/2026-photo-contest-winners/
Color Theory
Look at this core below (figure 1) and describe the colors and values you see.
Fig. 1) A small section of core: 401-U1611B-41R-2W from expedition 401
Some dark gray stripes, some light gray stripes, maybe some yellowish tones in the lightest stripes. Congratulations! You are applying color theory. Color theory is about describing the behavior of colors, such as mixing, color contrast, and color harmony. How colors look together and how they’re made is the basics of color theory application. It is often used by painters, but color theory is not just applicable for artists. It is necessary for the scientific world, including analysis of the ocean floor. Color theory is used as an aid for the functional applications of color as a science. To practice color science we need to first understand the international standards and practices for imaging.
In color science, we use CIELAB which stands for Commission International de l’Eclairage, or the International Commission on Illumination. They provide the recommendations for lighting, vision, color, and imaging. L*a*b* (pronounced “L star”, “a star”, and “b star”) stands for the coordinates that define a color numerically. The a* and b* signals relate to color, or chromaticity. A is related to redness or greenness. This means that a positive “a*” value (+a*) is more red, and a negative “a*” value (-a*) is more green. B is related to yellowness or blueness, so +b* is more yellow, and -b* is more blue. The values of a* and b* range from -128 to 128. The L* is the lightness channel and represents a value (black to white). L* is on a scale from 0-100, 0 being the whitest white we perceive, and 100 being the blackest black. The color of something can be found in this represented 3-axis model (figure 2).
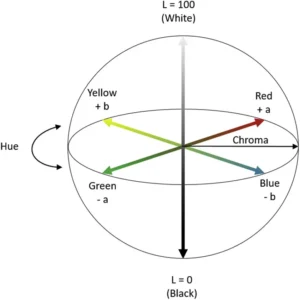
Fig. 2) model of the CIELAB color space using 3-axis
CIELAB is designed to approximate human vision and is great for perceiving small differences in color. Unlike RGB or CMYK, the colors CIELAB defines are not defined by a monitor or printer, but instead relate to the CIE standard observer. The standard observer is an averaging of the results of color matching experiments under that particular laboratory’s conditions to create a set base value for future reflectance recordings. For ocean coring, machines like the Section Half Multisensor Logger (SHMSL) use the CIELAB system for imaging cores.
The SHMSL

Fig 3.) photo of the Section Half Multisensor Logger on the JOIDES Resolution scanning an ocean core.
The SHMSL measures two things, spectral reflectance and magnetic susceptibility. These are used to create core descriptions. Since the SHMSL uses CIELAB, it requires a standard observer to set the “base” values. To set the standard observer, the SHMSL has a color reflectance control set (figure 4). The reflectance control set is similar to the ColorChecker used in professional photography (figure 5). These color patches have a known spectral reflectance value and are designed to mimic the values of natural objects, or in this case potential sediment and hard rock colors. The SHMSL is calibrated using this control set and a white standard. It then uses this recorded reflectance value to adjust future values.
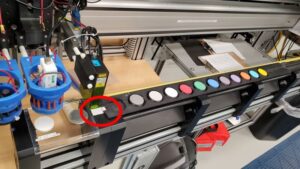
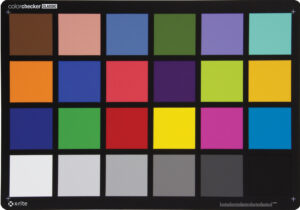
Fig. 4) A photo of the SHMSL color reflectance control set (left). Fig. 5) A photo of the Macbeth ColorChecker commonly used in photography (right).
Once calibrated and properly set up, the SHMSL is ready to read a core! Below is a finished reading of a core (figure 6). The three graphs at the bottom show the L*, a*, and b* values along the length of the core.
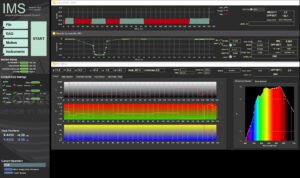
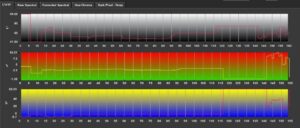
Fig. 6.1) Main IMS- SHMSL Data Acquisition Display (top). Fig 6.2) A zoomed in photo of the Main IMS- SHMSL Data Acquisition Display focusing only on the L*a*b* graph (bottom).
The numbers at the bottom of each L*, a*, and b* graphs match with the length of the core in cm. For example, at 20cm this reading shows that the core had a L* value above 80, an a* value around -30, and a b* value of around 47. This means the color was lighter in value, more green than red and more yellow than blue. A color with these values looks roughly like this (figure 7):
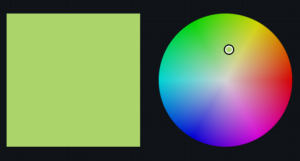
Fig. 7) A photo of a pale, yellow-greenish color.
Machines like the SHMSL are important for identifying colors on ocean cores. As we humans age, the differences in color vision grow wider due to the yellowing of our lens over time. A person in their 50s will see colors in a more yellow tint than someone in their teens due to aging. The SHMSL sets a standard for the lighting and imaging in the laboratory, narrowing the divide to provide the most accurate reading of color on the core possible.
Applying to the core
So now we know how to read the machine, but what does the color of an ocean core actually tell us? Color differences are used to quantify how an object’s color can change over time from light exposure, heat, and humidity. In the case of ocean cores, “spectral data can be used to estimate the abundances of certain compounds,” (TAMU). This means, the light values of a core may tell us about potential organic content. For example, green cores may be an indication of glauconite (depending on location and geological time) which could indicate an ancient shallow marine environment. Look back at figure one. Based on what we know of this area of the ocean floor, this type of color contrast and coloration is a clear example of a dolomotisation sequence (the formation of dolomite). Colors are powerful tools used for studying our oceans, and our oceans are full of colorful knowledge waiting for those with eyes to see it.
Sources:
- Berns, R. S. (2016). Color science and the visual arts a guide for conservators, curators, and the curious. Los Angeles Getty Conservation Institute.
- TAMU. (2026). GCR Section Half Multisensor Core Logger (SHMSL) User Guide. Atlassian.net; Texas A&M University. https://tamu-eas.atlassian.net/wiki/spaces/LMUG/pages/7341017839/SHMSL+User+Guide. Updated 06 March 2026
- Erick Bravo, Imaging Specialist for X401 aboard the JOIDES Resolution. Accessed 28 June 2026.
- Ly, Bao & Dyer, Ethan & Feig, Jessica & Chien, Anna & Bino, Sandra. (2020). Research Techniques Made Simple: Cutaneous Colorimetry: A Reliable Technique for Objective Skin Color Measurement. The Journal of investigative dermatology. 140. 3-12.e1. 10.1016/j.jid.2019.11.003.
- Macbeth ColorChecker. (2026). Imatest.com. https://www.imatest.com/wp-content/uploads/2022/01/msccc_colorchecker_classic_front.jpg
- Banaś, W. (2024). Convert LAB to RGB – colordesigner.io. Colordesigner.io. https://colordesigner.io/convert/labtorgb
Image sources:
Figure 1: Source 3
Figure 2: Source 4
Figure 3-4,6: Source 2
Figure 5: Source 5
Figure 7: Source 6
Written by OCA 2026 Mentor, Kellan Moss
By Naomi Krauzig (GEOMAR)
As the research vessel METEOR heads north toward Germany, the CTD Lab has become quiet.
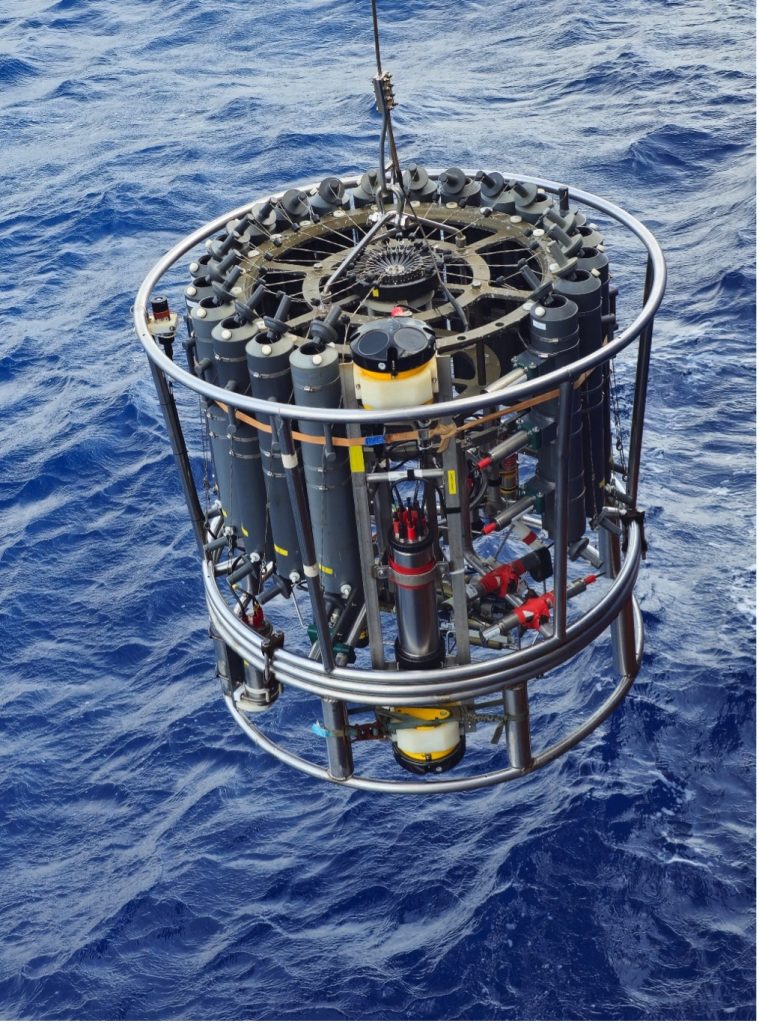
For the past four weeks, the CTD rosette (named after the three core variables it measures: conductivity, temperature, and depth) has been one of the busiest instruments on board. Day and night, it disappeared beneath the waves and returned with information about the entire water column.
Now the final station has been completed and the CTD rosette has been stored away for the last time. It feels like the right moment to reflect on a tool that has accompanied generations of oceanographers -and on a ship that has done the same.
Introduced in the 1970s, Conductivity-Temperature-Depth (CTD) systems revolutionized ocean observation by providing continuous measurements throughout the water column. When METEOR III entered service in 1986, the CTD was already the workhorse of physical oceanography. In the 1990s, it gained a trusted companion: the Lowered Acoustic Doppler Current Profiler (LADCP), capable of measuring ocean currents from the surface to the seafloor.
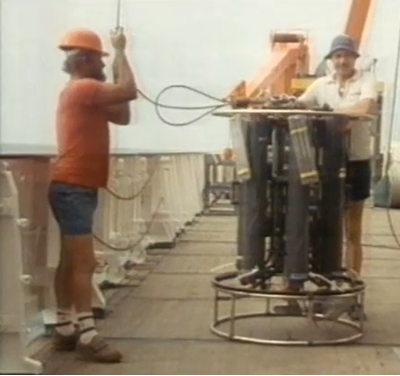
Aboard METEOR, the CTD rosette now also carries a suite of additional sensors measuring oxygen, chlorophyll, turbidity, photosynthetically active radiation, nitrate, and even particles and plankton through an Underwater Vision Profiler. At the same time, its Niskin bottles collect seawater samples for analyses of oxygen, nutrients, salinity, and other properties, providing a detailed picture of the water column.
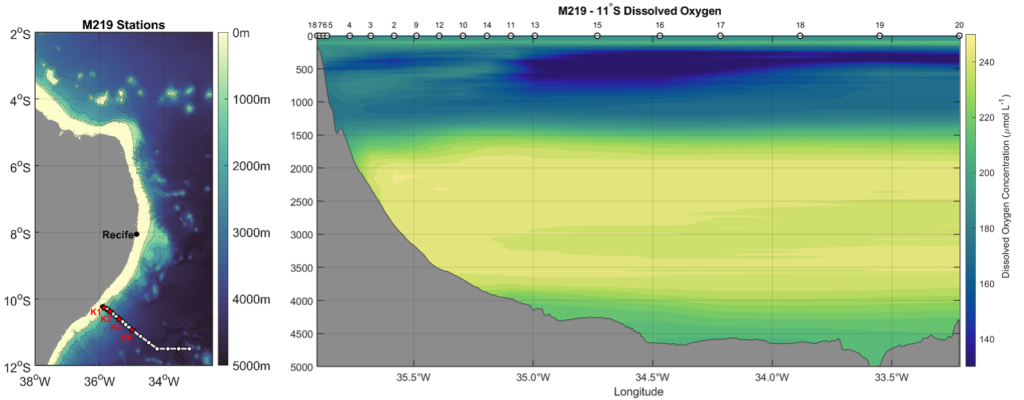
During M219, this classic CTD/LADCP system helped us reveal some of the hidden “highways” of the tropical Atlantic. Along the 11°S section off Brazil, a key location for monitoring the Atlantic Meridional Overturning Circulation, CTD measurements identified distinct water masses through their temperature, salinity, and oxygen signatures. At the same time, the LADCPs captured the currents carrying them: the warm, northward-flowing North Brazil Undercurrent in the upper ocean and the colder, southward-flowing Deep Western Boundary Current nearly two kilometers below.
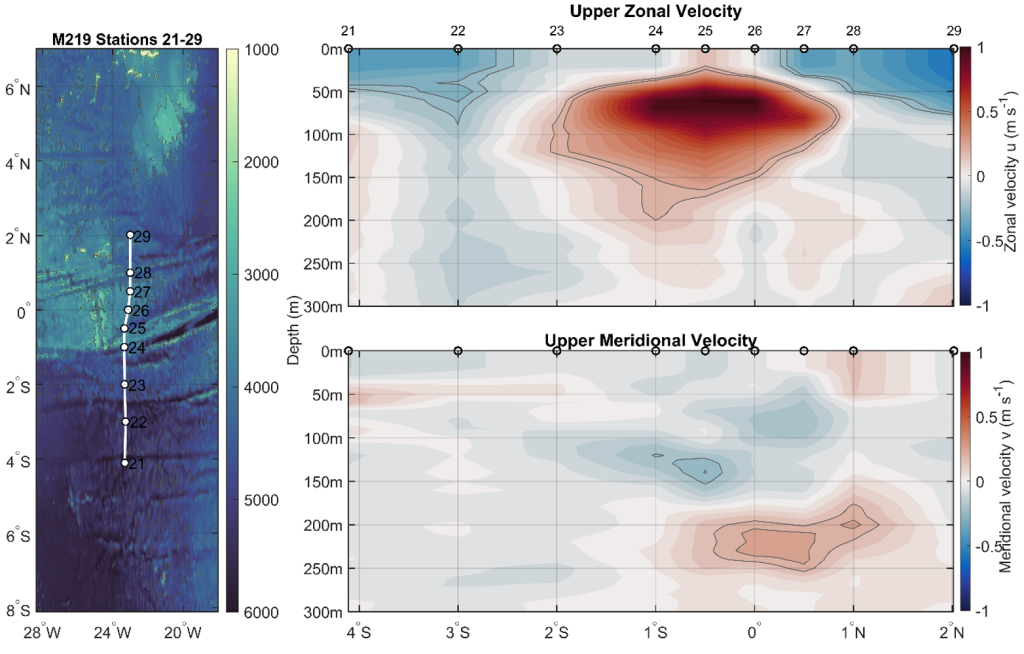
Further north, along 23°W, we crossed the equator and encountered one of the strongest subsurface currents in the world ocean: the Equatorial Undercurrent. Hidden just beneath the surface, this powerful eastward-flowing jet transports enormous amounts of water, heat, oxygen, nutrients, and carbon across the Atlantic: roughly one hundred times the discharge of the Amazon River!
While these observations allow us to investigate water masses, currents, and the circulation of the tropical Atlantic, they also carried an additional meaning for many on board.
For four decades, CTD rosettes have been lowered from the deck of METEOR III in every ocean of the world, helping scientists understand complex ocean processes, monitor changes, and train generations of oceanographers. During more than 11,940 days at sea, thousands of stations have been completed from her deck. Countless students, technicians, crew members, and scientists have contributed to these observations, and many have built their careers around the data collected aboard this vessel.
To take part in the final cruise -and the final CTD cast- of METEOR III was a privilege. Over the course of this voyage, it became impossible not to notice the connection many people have with this vessel. For some, METEOR has been a second home for years. Colleagues became lifelong friends, sometimes even family, and countless memories were made during deployments, watches, and transits at sea. The research vessel, the discoveries, and even the familiar CTD rosette hold a special place in many hearts.
As we pack the last equipment and the laboratories become emptier, it is difficult not to wonder what comes next. METEOR IV will soon continue the tradition, equipped with new capabilities and ready to tackle the scientific questions of the coming decades. New technologies will undoubtedly expand how we observe the ocean, yet some traditions are likely to endure.
https://www.oceanblogs.org/m219/2026/06/27/no-cruise-without-a-ctd/


-
Greenhouse Gases11 months ago
Guest post: Why China is still building new coal – and when it might stop
-
Climate Change11 months ago
Guest post: Why China is still building new coal – and when it might stop
-

 Greenhouse Gases2 years ago
嘉宾来稿:满足中国增长的用电需求 光伏加储能“比新建煤电更实惠”
-

 Climate Change2 years ago
嘉宾来稿:满足中国增长的用电需求 光伏加储能“比新建煤电更实惠”
-

 Renewable Energy8 months ago
Sending Progressive Philanthropist George Soros to Prison?
-
Climate Change2 years ago
Bill Discounting Climate Change in Florida’s Energy Policy Awaits DeSantis’ Approval
-

 Carbon Footprint2 years ago
US SEC’s Climate Disclosure Rules Spur Renewed Interest in Carbon Credits
-
Greenhouse Gases12 months ago
嘉宾来稿:探究火山喷发如何影响气候预测