

Color Theory
Look at this core below (figure 1) and describe the colors and values you see.
Fig. 1) A small section of core: 401-U1611B-41R-2W from expedition 401
Some dark gray stripes, some light gray stripes, maybe some yellowish tones in the lightest stripes. Congratulations! You are applying color theory. Color theory is about describing the behavior of colors, such as mixing, color contrast, and color harmony. How colors look together and how they’re made is the basics of color theory application. It is often used by painters, but color theory is not just applicable for artists. It is necessary for the scientific world, including analysis of the ocean floor. Color theory is used as an aid for the functional applications of color as a science. To practice color science we need to first understand the international standards and practices for imaging.
In color science, we use CIELAB which stands for Commission International de l’Eclairage, or the International Commission on Illumination. They provide the recommendations for lighting, vision, color, and imaging. L*a*b* (pronounced “L star”, “a star”, and “b star”) stands for the coordinates that define a color numerically. The a* and b* signals relate to color, or chromaticity. A is related to redness or greenness. This means that a positive “a*” value (+a*) is more red, and a negative “a*” value (-a*) is more green. B is related to yellowness or blueness, so +b* is more yellow, and -b* is more blue. The values of a* and b* range from -128 to 128. The L* is the lightness channel and represents a value (black to white). L* is on a scale from 0-100, 0 being the whitest white we perceive, and 100 being the blackest black. The color of something can be found in this represented 3-axis model (figure 2).
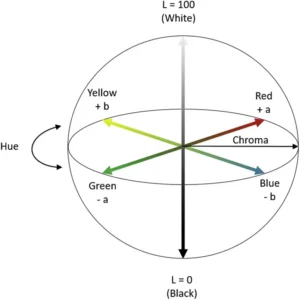
Fig. 2) model of the CIELAB color space using 3-axis
CIELAB is designed to approximate human vision and is great for perceiving small differences in color. Unlike RGB or CMYK, the colors CIELAB defines are not defined by a monitor or printer, but instead relate to the CIE standard observer. The standard observer is an averaging of the results of color matching experiments under that particular laboratory’s conditions to create a set base value for future reflectance recordings. For ocean coring, machines like the Section Half Multisensor Logger (SHMSL) use the CIELAB system for imaging cores.
The SHMSL

Fig 3.) photo of the Section Half Multisensor Logger on the JOIDES Resolution scanning an ocean core.
The SHMSL measures two things, spectral reflectance and magnetic susceptibility. These are used to create core descriptions. Since the SHMSL uses CIELAB, it requires a standard observer to set the “base” values. To set the standard observer, the SHMSL has a color reflectance control set (figure 4). The reflectance control set is similar to the ColorChecker used in professional photography (figure 5). These color patches have a known spectral reflectance value and are designed to mimic the values of natural objects, or in this case potential sediment and hard rock colors. The SHMSL is calibrated using this control set and a white standard. It then uses this recorded reflectance value to adjust future values.

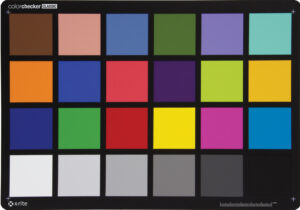
Fig. 4) A photo of the SHMSL color reflectance control set (left). Fig. 5) A photo of the Macbeth ColorChecker commonly used in photography (right).
Once calibrated and properly set up, the SHMSL is ready to read a core! Below is a finished reading of a core (figure 6). The three graphs at the bottom show the L*, a*, and b* values along the length of the core.
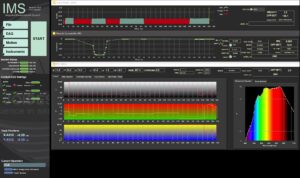
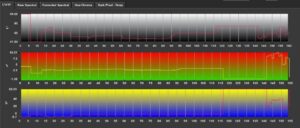
Fig. 6.1) Main IMS- SHMSL Data Acquisition Display (top). Fig 6.2) A zoomed in photo of the Main IMS- SHMSL Data Acquisition Display focusing only on the L*a*b* graph (bottom).
The numbers at the bottom of each L*, a*, and b* graphs match with the length of the core in cm. For example, at 20cm this reading shows that the core had a L* value above 80, an a* value around -30, and a b* value of around 47. This means the color was lighter in value, more green than red and more yellow than blue. A color with these values looks roughly like this (figure 7):
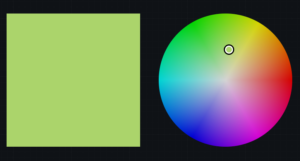
Fig. 7) A photo of a pale, yellow-greenish color.
Machines like the SHMSL are important for identifying colors on ocean cores. As we humans age, the differences in color vision grow wider due to the yellowing of our lens over time. A person in their 50s will see colors in a more yellow tint than someone in their teens due to aging. The SHMSL sets a standard for the lighting and imaging in the laboratory, narrowing the divide to provide the most accurate reading of color on the core possible.
Applying to the core
So now we know how to read the machine, but what does the color of an ocean core actually tell us? Color differences are used to quantify how an object’s color can change over time from light exposure, heat, and humidity. In the case of ocean cores, “spectral data can be used to estimate the abundances of certain compounds,” (TAMU). This means, the light values of a core may tell us about potential organic content. For example, green cores may be an indication of glauconite (depending on location and geological time) which could indicate an ancient shallow marine environment. Look back at figure one. Based on what we know of this area of the ocean floor, this type of color contrast and coloration is a clear example of a dolomotisation sequence (the formation of dolomite). Colors are powerful tools used for studying our oceans, and our oceans are full of colorful knowledge waiting for those with eyes to see it.
Sources:
- Berns, R. S. (2016). Color science and the visual arts a guide for conservators, curators, and the curious. Los Angeles Getty Conservation Institute.
- TAMU. (2026). GCR Section Half Multisensor Core Logger (SHMSL) User Guide. Atlassian.net; Texas A&M University. https://tamu-eas.atlassian.net/wiki/spaces/LMUG/pages/7341017839/SHMSL+User+Guide. Updated 06 March 2026
- Erick Bravo, Imaging Specialist for X401 aboard the JOIDES Resolution. Accessed 28 June 2026.
- Ly, Bao & Dyer, Ethan & Feig, Jessica & Chien, Anna & Bino, Sandra. (2020). Research Techniques Made Simple: Cutaneous Colorimetry: A Reliable Technique for Objective Skin Color Measurement. The Journal of investigative dermatology. 140. 3-12.e1. 10.1016/j.jid.2019.11.003.
- Macbeth ColorChecker. (2026). Imatest.com. https://www.imatest.com/wp-content/uploads/2022/01/msccc_colorchecker_classic_front.jpg
- Banaś, W. (2024). Convert LAB to RGB – colordesigner.io. Colordesigner.io. https://colordesigner.io/convert/labtorgb
Image sources:
Figure 1: Source 3
Figure 2: Source 4
Figure 3-4,6: Source 2
Figure 5: Source 5
Figure 7: Source 6
Written by OCA 2026 Mentor, Kellan Moss

This fall, Ocean Conservancy is celebrating its 41st annual International Coastal Cleanup® (ICC), once again bringing together volunteers to protect the beaches and waterways we all love. Ocean Conservancy recently hosted flagship events in Long Beach and Washington, D.C. that celebrated this global movement close to home.
Over the past four decades, nearly 20 million volunteers have rolled up their sleeves to remove more than 405 million pounds of trash from beaches and waterways around the world. And their impact extends far beyond what they collect. ICC volunteers have documented nearly 440 million individual items, creating the world’s largest marine debris database and providing invaluable information that helps Ocean Conservancy and others better understand—and tackle—ocean plastic pollution.
This year’s celebration continued that incredible legacy. At Alamitos Beach in Southern California, more than 150 volunteers gathered on September 19 and removed 1,109 pounds of trash, alongside members of Team USA Artistic Swimming and Olympic and Paralympic athletes. In Washington, D.C., 439 volunteers gathered on September 26 to remove 2,182 pounds of trash from Anacostia Park along the Anacostia River.


“I am so grateful to all of the volunteers who came out today for our ocean—and every volunteer who has made the last 41 years of impact possible,” said Ocean Conservancy’s Senior Director of Conservation Cleanups, Allison Schutes. “Every piece of plastic collected helps protect marine animals and habitats and contributes to research and advocacy.”
And the impact doesn’t stop when the cleanup ends. During International Coastal Cleanup events, volunteers do more than remove trash: They document what they find, helping build a clearer picture of the plastic pollution threatening our waterways and wildlife. Through the Clean Swell® app or paper data sheets, ICC volunteers contribute to Ocean Conservancy’s online, open-access database, the world’s largest repository of marine debris data. These records help scientists, conservation groups and governments understand pollution trends and identify solutions.
That data can also drive meaningful policy change. ICC data were recently used in a peer-reviewed study showing that plastic bag bans lead to reduced plastic bag pollution. The data have also helped advance policies ranging from California’s SB 54 to Florida’s balloon release ban and the federal Farewell to Foam Act. From a neighborhood cleanup to statewide action, every piece of documented trash helps build the evidence needed to tackle plastic pollution at its source.
Get Ocean Updates in Your Inbox
Sign up with your email and never miss an update.
Want to get involved?
Whether you join a local cleanup, record the trash you find using the Clean Swell app, or take action to reduce plastic pollution, you can be part of this incredible collective effort to protect our ocean. Here are a few ways to make an impact:
- Find a cleanup near you.
- Download our Clean Swell app to easily record the trash you collect.
- Take action to reduce plastic pollution.
- Explore our Wildlife Impact Calculator to estimate the potential benefits of your cleanup for marine wildlife.
- Donate today to Ocean Conservancy to help us fight plastic pollution for years to come!
The post Celebrating 41 Years of the International Coastal Cleanup® appeared first on Ocean Conservancy.
For generations, stories of people being swallowed by enormous sea creatures have painted awe-inspiring tales of human survival and perseverance. From the biblical account of Jonah to the legendary battle of Hercules and Cetus to the timeless story of Pinocchio, these legendary tales have captivated people since time immemorial.
But all these stories raise the question: Could someone really be swallowed by a whale? With the premiere of the film Whalefall on October 16, 2026, you may find yourself in conversations about this very situation. Based on the bestselling 2023 thriller authored by Daniel Kraus, the film tells the story of a scuba diver who is accidentally gobbled up by a sperm whale while searching for the remains of his late father. With only an hour of oxygen left in his tank, the diver must fight to escape the whale’s gut before time runs out.
The answer to whether it’s anatomically possible for a whale to swallow a person is actually a bit more complicated than you might think.