
Mukhtar Babayev is COP29 President and Special Representative of the President of Azerbaijan for Climate Issues.
COP has entered “late-stage multilateralism”. We have already agreed the processes, targets and mechanisms to guide action. The system is now fully operational, resilient and delivering results. Success today depends less on what new things all countries agree and more on what individual actors achieve.
And we are in a race against the clock, so there is a desperate need for speed. This will require new modes of working, rather than repeating the lumbering mechanisms of generations past. Our conversations at COP30 confirmed to us that the will and energy is there in bundles. It now needs to be directed.
On finance, there is much to do. At COP29 we set the Baku Finance Goal to scale up support for the developing world to $1.3 trillion per year by 2035. This was no small ask.
-
As Paris Agreement enters tougher era, new alliances urged to step up
With global consensus over climate action faltering on the accord’s 10th anniversary, experts say “coalitions of the willing” should move faster and with more ambition -
As the Paris Agreement turns 10, what has it achieved?
A decade since the deal was adopted, climate experts say it is working to cut emissions, spur action and reduce the projected temperature rise – but not as fast as we need it to -
Funding for protected areas fell in 2024, threatening global nature target
While developed countries are expected to deliver $6bn by 2030 to protect a third of the planet’s land and sea ecosystems, a new report shows they are far off track


We are trying to intervene in the normal functioning of the world economy and channel the forces of global finance. Success will require great political will, sustained focus, and relentless action from all of us – the private sector, central banks, financial institutions, and everyone in between.
But while the problems are easy to identify, the solutions are often missing. Efforts to reform the global financial system have been disjointed and the COP process needed a new framework to engage with actors outside our normal systems.
More room for creativity outside negotiations
In recognition of the need to try something new, countries mandated the Azerbaijani and Brazilian COP Presidencies to produce the Baku-to-Belém Roadmap to $1.3 trillion to set out the next steps. This was an innovative format, outside the negotiations and therefore given a free hand to be more creative.
We opened the process to everyone. And while we promised that we would not be prescriptive, we were clear that we would be fearless at providing an honest look at a wide range of options.
Countries have warmly welcomed the approach, and we were pleased to see the Roadmap recognised in COP30’s Global Mutirão decision. In Belém, they told us that while they don’t necessarily agree with every line, they still see the value of the exercise and want to build on it. This is a radical change from the normal process where we argue over every word and comma of each formal text.
Practical next steps
The Roadmap can act as a focal point and a coherent reference framework that incorporates existing initiatives. It identifies key action fronts and thematic priorities. And it concludes with practical short-term steps to guide early implementation.
Many of these were designed to address the problems that COP presidencies have seen firsthand – lack of consistent data and reporting, uncertainty about forward projections, silos and a lack of continuity and interoperability between different processes.
But we must acknowledge that this exercise has made some feel uneasy. They have feared that by broadening our focus, we are providing cover for governments not to fulfill their traditional responsibilities. And it is unacceptable that we have indeed seen cases of donors cutting funds and expecting the private sector to fill the gap.
Donors must deliver in full
So as we set out the Roadmap for all to follow, we have a duty to be unequivocal with governments. The COP29 negotiations to agree on the historic target for $300 billion per year in public funds by 2035 were hard. Now, there can be no excuses. We asked vulnerable communities to accept the limits of how much support they could expect. In equal measure, we insist that donors deliver in full, with developed countries taking the lead.
COP30 fails to land deal on fossil fuel transition but triples finance for climate adaptation
Too often, when we set a target for everyone, no one steps up, as collective responsibility undermines individual accountability. That must change. And in the Roadmap we have asked developed countries to work together on a delivery plan that explains how they will meet the $300 billion per year climate finance goal.
Innovative approaches needed
Late-stage multilateralism demands that we are ready to innovate with our processes. They did well to get us this far and they need to be preserved. But we also need to think outside the box on how we deliver the aims and objectives that we have set ourselves.
COP30 showed that there is an appetite for new approaches and new ideas. The Baku-to-Belém Roadmap could be a template for one such evolution of the COP process.
Now we need other ideas, more creativity and real-world action to show that this template can work. The COP29 Presidency will continue to work with everyone to find new solutions, scale promising initiatives and deliver on the promises we have all made.
The post From Baku to Belém and beyond: How we turn a climate finance roadmap into reality appeared first on Climate Home News.
From Baku to Belém and beyond: How we turn a climate finance roadmap into reality
Climate Change
DeBriefed 2 April 2026: Countries ‘revive’ energy-crisis measures | Record UK renewables | Plug-in solar savings
Welcome to Carbon Brief’s DeBriefed.
An essential guide to the week’s key developments relating to climate change.
This week
Crisis responses
OIL SUPPLIES: The International Energy Agency (IEA) warned that oil supply disruptions will worsen in April due to the Iran war, reported CNBC. The outlet added that the IEA was considering another release of strategic oil reserves. Meanwhile, US exports of liquefied natural gas (LNG) reached an “all-time high” in March, with shipments to Asia more than doubling from the previous month, said Reuters.
‘SLOWER GROWTH’: The International Monetary Foundation (IMF) warned that “all roads lead to higher prices and slower growth worldwide” if the war continues to choke oil, gas and fertiliser supplies, reported the Guardian. The IMF said the UK and Italy were “especially exposed by their reliance on gas-fired power”, the newspaper added.
EU PREPARES: The EU is considering “reviving energy-crisis measures” it used at the start of the Ukraine war, including “grid tariffs and taxes on electricity”, according to Reuters. France is considering new actions to electrify its economy and cut dependence on fossil imports, said Le Monde. Elsewhere, BBC News rounded up crisis responses from around the world – including fuel rationing, fuel tax cuts, home working and free public transport.
COAL ‘SHORT-LIVED’: Some countries announced plans to delay coal-plant shutdowns. Italy plans to push back its coal-power phaseout to 2038, according to Reuters. Germany will review whether to reactivate reserve plants, reported Bloomberg. South Korea also extended three plants set to close this year, said the Korea Times. However, a separate Bloomberg comment piece stated that “any shift to burn more coal in 2026 will be short-lived”
Around the world
- GAS SCRAPPED?: New Zealand’s government cast doubt over plans to build an LNG import terminal as rising gas prices have worsened the economics, said the New Zealand Herald. Separately, plans for Vietnam’s largest LNG power plant may be scrapped in favour of a new renewable energy project, according to Reuters.
- PHASEOUT SUMMIT: Climate Home News reported that 46 countries – including major oil producers – have confirmed they will attend the fossil-fuel phaseout summit being held in Colombia later this month.
- INDIAN SUMMER: India is “forecast to experience higher than normal heatwave days through June, raising the risk of power shortages” as the Middle East conflict worsens energy strains, reported Bloomberg.
- AFGHANISTAN FLOODS: Heavy rainfall and floods across Afghanistan have killed at least 48 people and damaged communities, following years of drought, said Kabul Now.
- WIND BUYOUTS: In an effort to halt remaining US offshore wind projects, the Trump administration is offering buyouts to developers in exchange for fossil-fuel investments, according to the Financial Times.
66%
The annual increase in forest loss in Indonesia in 2025, according to Indonesian biodiversity thinktank Auriga Nusantara, reported by Reuters.
Latest climate research
- New research explores “patterns of distributional justice” in the mitigation scenarios used in the IPCC’s sixth assessment | npj Climate Action
- Antarctic surface melt will expand by more than 10% by 2100, if future greenhouse gas emissions continue to be high | Nature Communications
- The evolution of the urban heat island effect in Chinese cities is “not unidirectional, but depends on localised urbanisation and greening dynamics” | PNAS Nexus
(For more, see Carbon Brief’s in-depth daily summaries of the top climate news stories on Monday, Tuesday, Wednesday and Thursday.)
Captured
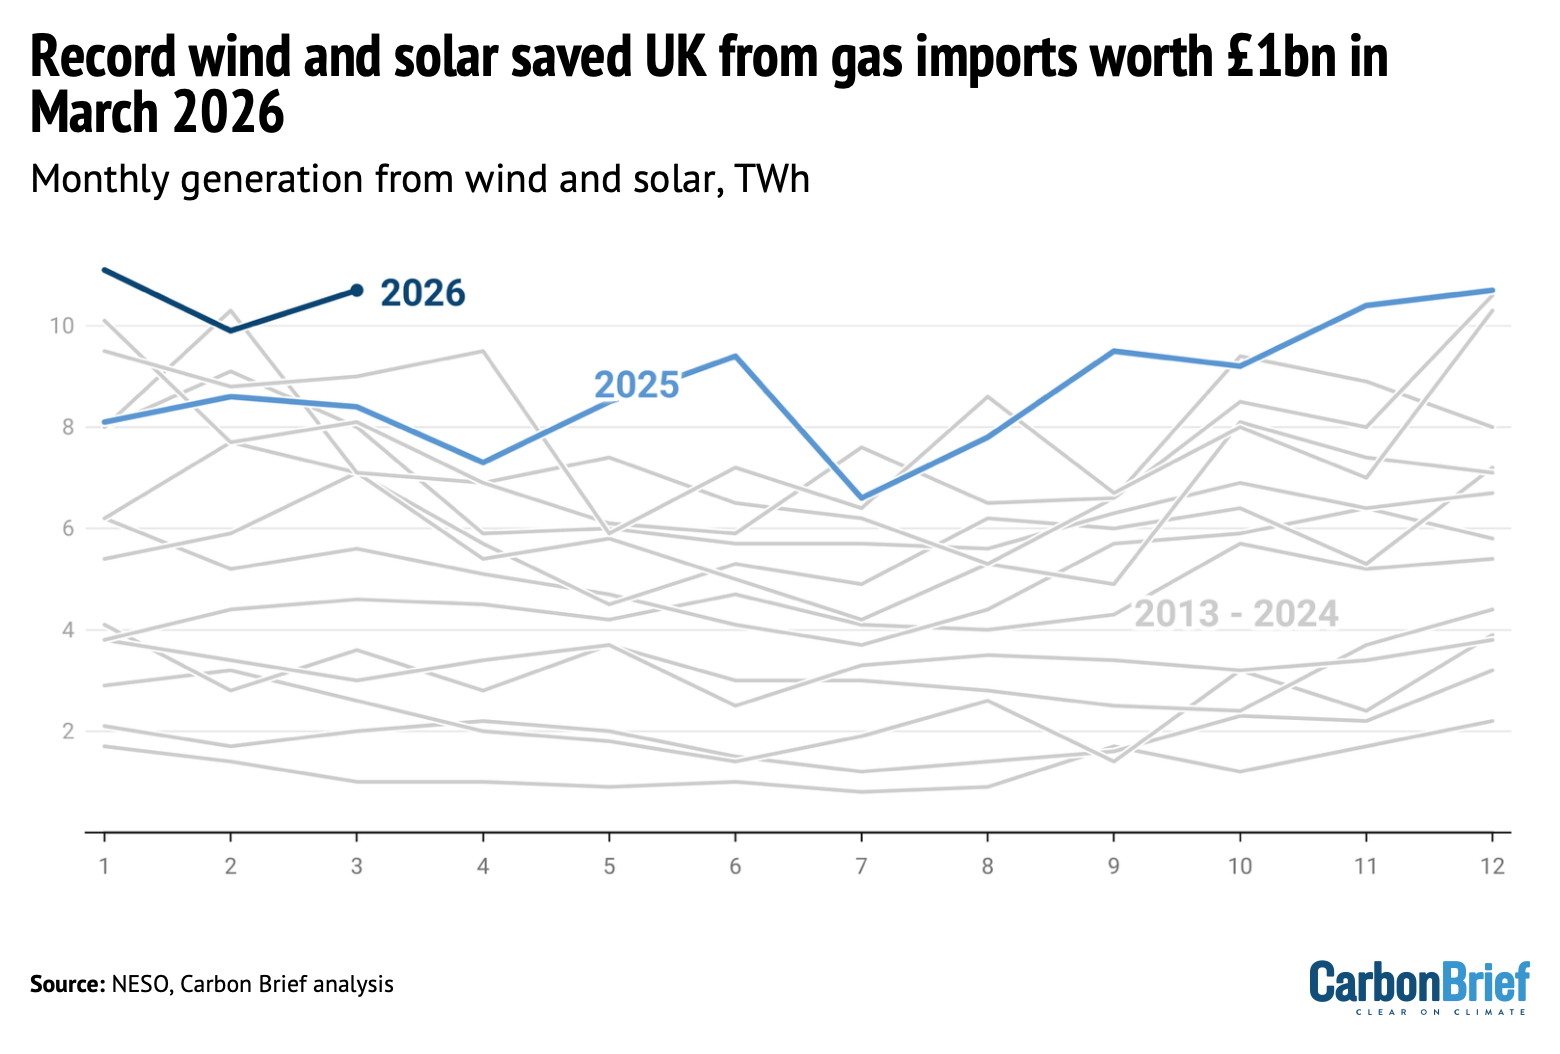
Carbon Brief analysis found that Great Britain has generated record levels of combined wind and solar output so far this year. The chart above shows monthly wind and solar output, which reached 11 terawatt hours (TWh) in March 2026. At current high gas prices, this saved the UK nearly £1bn worth of gas imports for the month, according to the analysis.
Spotlight
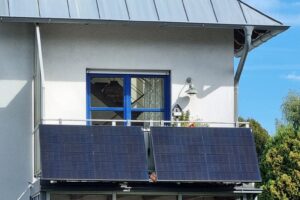
How ‘plug-in’ solar could reduce bills
This week, Carbon Brief analysis finds that plug-in solar panels could save a typical household £1,100 over a 15-year lifetime.
In response to the ongoing energy crisis, the UK government announced on 15 March a package of clean-energy measures to “boost” energy security. Among these was the introduction of “plug-in” solar panels to the UK.
Plug-in panels
Compared to rooftop solar, smaller plug-in solar systems consisting of one to two panels can be easily installed on balconies, in gardens and other outdoor spaces. They can be plugged directly into home sockets without the need for additional wiring, reducing electricity taken from the grid and thereby cutting bills.
Plug-in solar has already taken off in Germany, with official registrations already exceeding 1m installations (the actual number could be up to 4m). Other growing markets include France, Spain, the Netherlands and the US.
Panels could be available in the UK “within months” at retailers, such as Lidl and Sainsbury’s, according to the government. (Many of the products from EcoFlow, one of the main providers of plug-in solar in the UK, are already sold out online.)
The government said it will work with relevant bodies to update electrical regulations to allow the use of plug-in solar. The Institution of Engineering and Technology (IET) has advised homes to get their wiring checked before installing.
Costs and benefits
To assess the potential impact of plug-in solar, Carbon Brief conducted a cost-benefit analysis for an 800-watt (W) installation in a typical two-to-three bedroom home in London. The assumptions are approximate and will vary for different locations and set-ups.
Optimally placed panels – south-facing and tilted at around 40 degrees – would generate around 820 kilowatt hours (kWh) each year in London – at a “load factor” of 12% – according to the EU’s PVGIS database.
Actual output is likely to be lower, due to sub-optimal placement – such as vertically on balconies – as well as orientation and shading.
A report by trade body Solar Power Europe noted these factors could cut 30-60% from optimal output. This analysis assumes a 45% reduction from optimal output.
If a household is able to use 90% of the output – typical for such installations – then the panels would provide 400kWh of electricity each year, enough to meet 15% of typical demand.
This will vary on the household usage patterns, but running appliances such as washing machines during peak daylight hours could improve capture rates.
This could save £110 on electricity bills each year, meaning the upfront cost of around £500 could be paid back within 5 years, according to Carbon Brief’s analysis.
Assuming the panels last 15 years, total net savings over their lifetime could reach £1,100.
These savings assume a fixed unit cost of 27p/kWh, based on predictions for July 2026.
If electricity prices surged to 34p/kWh for a prolonged period – as they did during the 2022 gas price crisis – then annual savings could increase to around £140, further reducing the payback time.
If module costs fall over time as more suppliers enter the market, this could reduce the upfront cost and payback time.
If 3m households take up plug-in solar – comparable to Germany’s current deployment – this would generate 1.2 terawatt hours (TWh), less than 1% of UK demand.
While this would not significantly cut UK emissions overall, it could still save the households more than £330m in total and avoid around two tankers’ worth of imported liquified natural gas (LNG) each year, according to Carbon Brief’s analysis.
Unlocking participation
Aside from its economic benefits, plug-in solar could unlock participation in the clean-energy transition for a wider percentage of the population.
For example, renters make up around one-third of UK households and lack control over the installation of rooftop solar and heat pumps. Plug-in solar would enable them to engage in and benefit from clean energy in their homes.
This spotlight was also published on Carbon Brief’s website.
Watch, read, listen
HEAT HEADS: The BBC’s Climate Question podcast spoke to two women from Sierra Leone and Mexico about their role as “chief heat officers” for their cities.
OYSTER DIE-OFF: A feature in the Guardian explored how warming seas are causing mass die-offs of Japan’s oysters, threatening the shellfish trade.
SOLAR SWITCH: Climate Home News examined how Nigerian homes and businesses are increasingly switching from backup generators to solar power.
Coming up
- 8 April: International Energy Agency rare earth special report launch, Paris
- 10 April: Djibouti presidential election
Pick of the jobs
- Grantham Institute for Climate Change, research fellow | Salary: £49,017-£57,472. Location: London (hybrid)
- Stop Climate Chaos Scotland, advocacy lead | Salary: £35,000. Location: Scotland (remote)
- The 19th News,contract climate reporter | Salary: $50 per hour. Location: US (remote)
DeBriefed is edited by Daisy Dunne. Please send any tips or feedback to debriefed@carbonbrief.org.
This is an online version of Carbon Brief’s weekly DeBriefed email newsletter. Subscribe for free here.
The post DeBriefed 2 April 2026: Countries ‘revive’ energy-crisis measures | Record UK renewables | Plug-in solar savings appeared first on Carbon Brief.
The Intergovernmental Panel on Climate Change’s (IPCC) latest assessment cycle has been beset by disagreements between nations over the timeline for publishing its next landmark report.
During the UN climate science body’s last five “sessions” – biannual meetings where governments discuss matters related to the IPCC’s work – governments have been unable to sign off on the delivery date of the “working group” reports.
The deadlock over the delivery plan for the seventh assessment cycle (AR7) has been described as “unprecedented”.
Some countries have pushed for reports to be approved in 2028, in time to inform the “second global stocktake”, which is due to conclude at COP33 that year and is designed to inform the next round of national climate goals under the Paris Agreement.
Other nations have argued that developing countries need more time to review and approve the reports – meaning that one, or more, would not be published until after the stocktake.
The next IPCC meeting – due to take place in Addis Ababa in October – is likely the last moment where a timeline could be agreed that would see the reports synchronised with the stocktake.
One expert tells Carbon Brief that the failure to align the IPCC’s reports with the stocktake would be a “major historical break [that] would be used to weaken the international climate process and Paris Agreement”.
In this Q&A, Carbon Brief explores the ongoing disagreements over the AR7 timeline.
- How does the IPCC assessment report cycle work?
- How have timeline negotiations been different for AR7?
- Why have negotiations over the timeline of AR7 faltered?
- Why are some countries calling for a slower timeline for AR7 reports?
- How is the IPCC managing the impasse?
- Is delivering the reports in time for the global stocktake still possible?
- What could be the implications of an extended timeline for AR7?
How does the IPCC assessment report cycle work?
For almost 40 years, the IPCC has been one of the most visible examples of a “science-policy interface” – an institution that helps science to inform policy.
The UN General Assembly resolution that established the IPCC in December 1988 states that the panel will “provide internationally coordinated scientific assessments of the magnitude, timing and potential environmental and socioeconomic impact of climate change and realistic response strategies”.
Four years later, the UN Framework Convention on Climate Change (UNFCCC) was created, with an objective of “stabilising greenhouse gas concentrations at a level that would prevent dangerous anthropogenic [human-caused] interference with the climate system”.
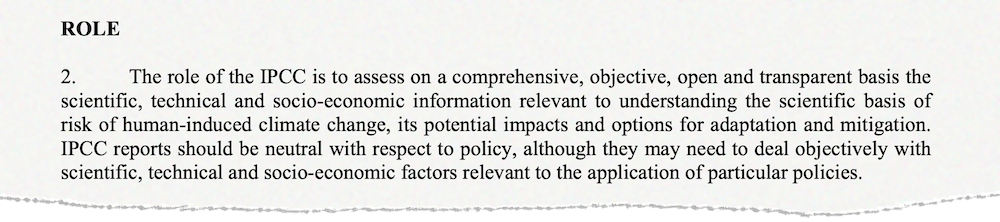
The IPCC’s official rulebook, last updated in 2013, highlights the IPCC’s role in producing comprehensive assessments of the state of human-caused climate change. It stipulates that its assessments must provide “relevant” information – and that reports should be “neutral with respect to policy”.
The IPCC’s work has long helped inform the work of the UNFCCC, which meets annually for its “conference of the parties” (COP).
For example, the reports of the fifth assessment cycle (AR5), published over 2013-14, have been credited for informing the Paris Agreement’s headline goal to hold global temperature rise at “well below 2C” and “pursue efforts” to limit increases to 1.5C.
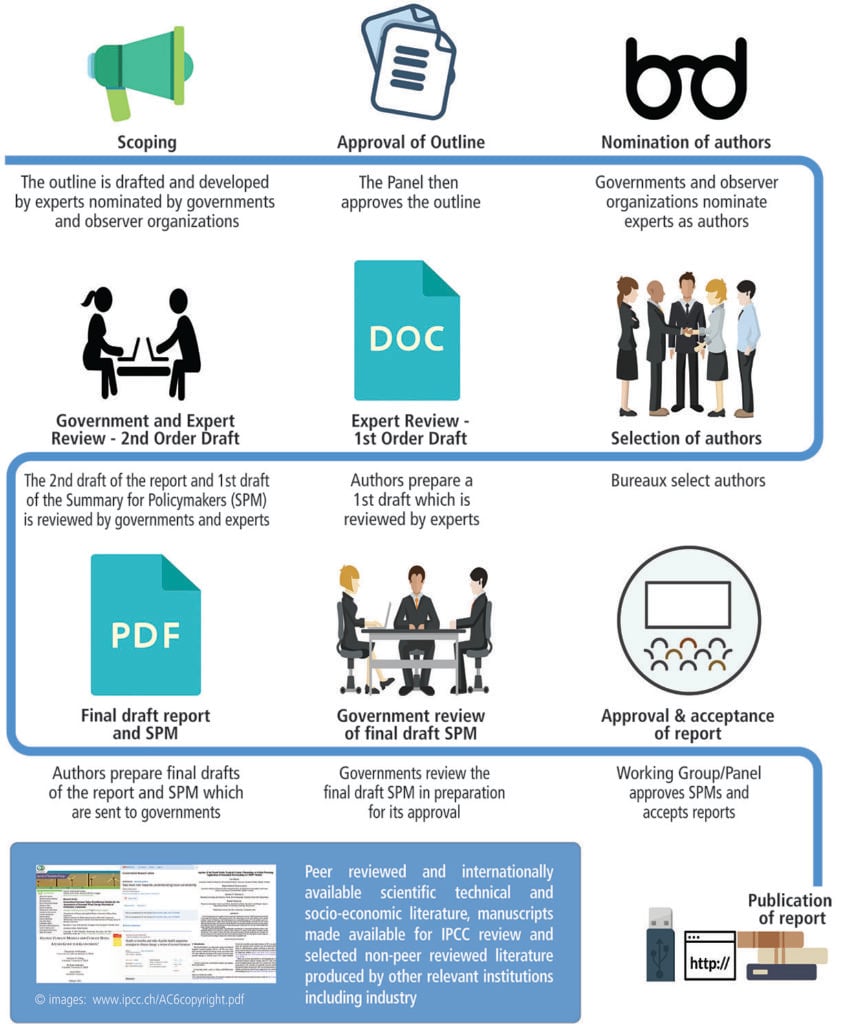
During each assessment cycle, the IPCC produces three “working group” (WG) reports on physical science (WG1), impacts and adaptation (WG2) and mitigation (WG3). These are summarised in a “synthesis” report (SYR). It also produces special reports and methodology reports.
There are a number of stages to the creation of an IPCC working group report, as shown in the graphic below.
How have timeline negotiations been different for AR7?
The current assessment cycle – AR7 – formally began in July 2023, at the IPCC’s 59th session (IPCC-59) in Nairobi.
In January 2024, governments agreed to publish the AR7 synthesis report in 2029.
However, governments are yet to ratify a timeline for publication of the working group reports that will precede it, after negotiations on the issue ended in deadlock in Istanbul, Sofia, Hangzhou, Lima and Bangkok.
This puts AR7 at odds with the previous assessment cycles, where timelines were agreed more quickly. This is shown in the table below.
| Assessment cycle | Start date | Report timeline agreed* | Time until decision | WG1 | WG2 |
WG3 | SYR |
|---|---|---|---|---|---|---|---|
| First | IPCC-1, Nov 1988 | IPCC-2, Jun 1989 | 7 months | Aug 1990 | Jun 1990 | Jun 1990 | Aug 1990 |
| Second | IPCC-7, Feb 1992 | IPCC-9, Jun 1993 | 1 year, 4 months | Dec 1995 | Oct 1995 | Oct 1995 | Dec 1995 |
| Third | IPCC-13, Sep 1997 |
IPCC-14, Oct 1998 | 1 year, 1 months | Jan 2001 | Feb 2001 | Mar 2001 | Sep 2001 |
| Fourth | IPCC-19, Apr 2002 | IPCC-21, Nov 2003 | 1 year, 8 months | Feb 2007 | Apr 2007 | May 2007 | Nov 2007 |
| Fifth | IPCC-28, Apr 2008 |
IPCC-31, Oct 2009 | 1 year, 5 months | Sep 2013 | Mar 2014 | Apr 2014 | Nov 2014 |
| Sixth | IPCC-42, Oct 2015 |
IPCC-46, Sep 2017 | 1 year, 11 months | Aug 2021 | Feb 2022 | Apr 2022 | Mar 2023 |
| Seventh | IPCC-59, Jul 2023 |
– | 2 years, 9 months and counting | – | – | – | 2029 |
“Report timeline agreed” refers to when delivery timeline of working group reports was agreed. WG = working group and SYR = synthesis report. Analysis by Carbon Brief.
Why have negotiations over the timeline of AR7 faltered?
Part of the disagreement over the AR7 timeline centres on the question of whether the IPCC’s seventh assessment cycle should align with the second global stocktake, a process that is due to culminate in the autumn of 2028 at COP33.
While a number of different timelines have been proposed, there are, broadly speaking, two camps in the AR7 timeline debate.
The first group has argued that all three working group reports should be published in 2028, so that they can inform the second global stocktake.
The other faction has advocated for a longer timeline, which would mean WG2 and WG3 would be finished after the stocktake is completed.
Established in 2015 under the Paris Agreement, the global stocktake is a five-yearly assessment of the world’s collective progress on tackling climate change. Under the terms of the treaty, countries pledged to consider the “best available science” during the process.
The first global stocktake concluded at COP29 in Dubai in 2023. Its outcomes informed national 2035 climate goals, which were due to the UN in 2025.
In the outcome decision of the first global stocktake, the UNFCCC officially invited the IPCC to consider how to “best align” with the “second and subsequent global stocktakes”.
The document also invited the IPCC to “provide relevant and timely information for the next global stocktake”.
Dr Bill Hare, CEO and senior scientist of Climate Analytics, tells Carbon Brief the stocktake is “at the guts, or heart, or the Paris Agreement’s ambition mechanism”.
He explains that the IPCC’s sixth assessment reports (AR6) – published over 2021-23 – were a “critical element” in the first global stocktake process:
“You had the IPCC reports there. You’ve had the IPCC co-chairs, or authors, in the discussions [and] workshops, pushing back on arguments from [countries]…They were able to anchor the fact that the world hasn’t done enough, that the NDCs [“nationally determined contributions”, or climate pledges] haven’t met the 1.5C goal by a wide margin – and that the cost of doing stuff is relatively cheap, which was a critical output of the WG3 report last time.”
Dozens of counties have advocated for a global stocktake-aligned timeline for AR7 reports, arguing that it is critical that findings from all working groups inform the exercise.
For example, the small-island state of Vanuatu said at IPCC-63 in Lima that delaying the reports would deprive countries of important scientific information ahead of key international meetings, according to the Earth Negotiations Bulletin (ENB), reporting from inside the meeting.
Meanwhile, the Netherlands said at IPCC-64 in Bangkok that the delivery of reports after the stocktake would “significantly lower the policy relevance of AR7”, according to ENB.
A timeline where the reports are published ahead of the stocktake has been backed by co-chairs of IPCC reports. (See: How is the IPCC managing the impasse?)
Hare says that, in his analysis, a timeline where the AR7 reports align with the stocktake is supported by the “majority of countries, across geographies and levels of development, including least developed countries and small-island developing states”.
However, a number of emerging-economy nations have argued that a timeline where all reports are delivered by 2028 is too tight.
Why are some countries calling for a slower timeline for AR7 reports?
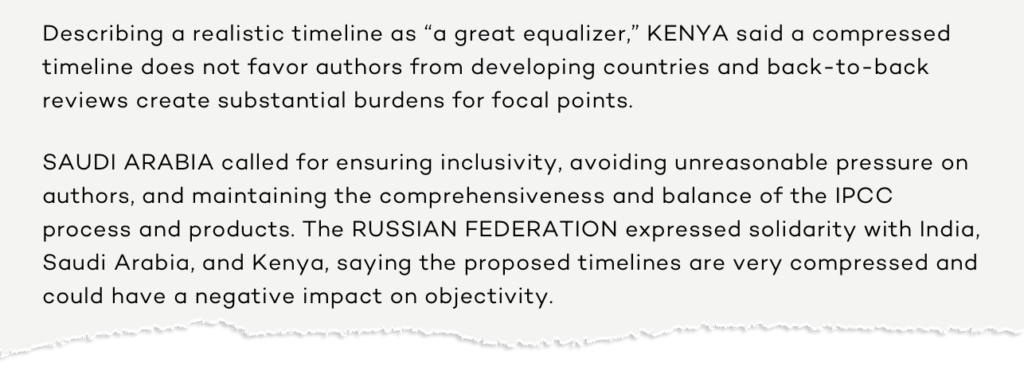
Among the most vocal proponents for the WG2 and WG3 reports being delivered after the stocktake, according to the ENB’s write-ups of negotiations in Bangkok and Lima, are India, Kenya, Russia and Saudi Arabia.
These countries have argued that authors, experts and governments from developing nations with fewer resources need more time to prepare, review and approve working group reports.
Some of the arguments in favour for a slower timeline are captured below in an excerpt from the ENB’s write-up of last October’s IPCC-63 in Lima.
An article published in 2025 in Africa Climate Insights summarised some of the arguments in favour of a slower timeline. It says a stocktake-aligned timeline would have overlapping review periods for different working group reports that would place more pressure on governments and experts.
It also notes that researchers from the global south – who face greater institutional barriers to publishing research in academic journals – would benefit from a later cut-off date for scientific literature for the AR7 reports. It quotes Dr Patricia Nying’uro – Kenya’s IPCC “focal point” – saying:
“The current timeline does not provide adequate time for developing countries to conduct research, publish their findings and have meaningful input.”
On top of citing inclusivity concerns, countries have also argued that aligning reports with the global stocktake is not an IPCC priority.
For instance, ENB reported at IPCC-64 that Saudi Arabia said “compressing” the cycle to meet “external timelines” would be “improper” because the IPCC “serves a broader mandate than just providing inputs to the global stocktake”.
Meanwhile, Russia said inputs to the global stocktake were “not the key to IPCC success”.
These arguments have faced significant pushback.
At IPCC-63 in Lima, IPCC co-chairs pointed out that overlapping reviews of assessment reports were “intentional” and would allow experts to see both drafts at once, according to ENB.
At the meeting, IPCC chair Prof Jim Skea also pointed to the IPCC rulebook, which states that panel and working group sessions should be scheduled to coordinate “to the extent possible, with other related international meetings”.
Some have contested the framing of a stocktake-aligned timeline as “compressed”.
At IPCC-61 in Sofia, the delegation from Saint Kitts and Nevis argued that the proposed schedule for AR7 was “neither compressed nor rushed”, because, while it was shorter than the schedule for AR6, it would contain fewer special reports.
Meanwhile, at IPCC-62 in Hangzhou, representatives from Luxembourg reminded the conference that AR6 was produced under “global pandemic conditions and was, therefore, delayed”, reported ENB. As such, they said the “proper comparison of the timeline would be to AR5, relative to which the proposed timetable was not rushed”.
(AR6’s seven-year run has been attributed in IPCC documents to the Covid-19 pandemic interrupting workflows and an unprecedented number of reports.)
There have been accusations in some quarters that delegations advocating in favour of a slower timeline are deliberately stalling the process.
For example, in a statement released after the meeting, the French government expressed its “deep concern over attempts to arbitrarily slow down and postpone the publication schedule”.
It said that “any delay in taking into account the relevant scientific data to respond to the climate emergency would seriously compromise climate action on a global scale”.
Some observers have argued that dynamics playing out at the IPCC replicate those in UN climate negotiations. Yao Zhe from Greenpeace East Asia tells Carbon Brief:
“The group of countries that opposed the proposed AR7 timelines is similar to the group that tactically slowed down or blocked negotiations regarding mitigation ambition under the UNFCCC. And they are gaining more influence as global climate governance faces a leadership vacuum.”
Dr Kari de Pryck, a lecturer at the Institute for Environmental Sciences at the University of Geneva, tells Carbon Brief that, “clearly, there is obstruction”. She continues:
“It is in the interest of some countries to ensure that the IPCC reports are not published on time. But there are also interesting and legitimate comments on inclusivity and diversity.”
How is the IPCC managing the impasse?
Despite no formal timeline for report delivery being agreed, report production has continued undeterred, IPCC chair Prof Jim Skea tells Carbon Brief.
He says that, so far, the science “has not been held up” by the report timeline issue, with lead author meetings and drafting of the various working group, special and methodological reports underway.
However, he warns that a final decision will need to be made by the end of 2026 on a timeline. He explains:
“There are multiple proposals that have been made [on timelines] and they start to diverge during 2027 due to the scheduling of specific events, like lead author meetings and review periods. Because we need to establish a budget for 2027, we need to make a decision before the end of 2626 to have some certainty about the entire cycle.
“So far, we’ve operated by taking year by year decisions – you just take the decision for the next year and carry on. That’s been okay so far, because there has not been a divergence [between timeline proposals] at the earlier stages of the cycle. But we will see divergences coming up.”
At IPCC-63 last October, WG1 co-chair Dr Robert Vautard noted that reports production was currently aligned with a schedule that had been “considered” in the previous meeting in Hangzhou. He said this timeline would allow final approval sessions for WG1, WG2 and WG3 to take place in May 2028, June 2028 and July 2028, respectively.
After this timeline failed to garner consensus, WG1 co-chair Dr Xiaoye Zhang and WG2 co-chair Dr Bart Van den Hurk then presented a new “compromise” timeline to delegates.
This extended the expert and government review periods for draft reports and pushed final approval sessions for WG2 and WG3 to July 2028 and September 2028. Discussions about this updated timeline ended in deadlock.
At IPCC-64 in Bangkok in March 2026, the timeline for reports was initially not slated for discussion.
However, an item on “progress on AR7 reports” was added to the agenda on the first day of the conference, after some countries said the issue required structured discussion. In the end, no agreement was reached on how resolution could be reached.
Negotiations have been pushed – alongside a number of other unresolved decisions – to IPCC-65, scheduled to take place in Addis Ababa, Ethiopia, in October 2026.
Skea says the lack of agreement on a way forward in Bangkok leaves the secretariat with the “responsibility to try and figure out the process that will move us in the right direction”. He adds:
“Is there a bridging proposal, some kind of scheme that would help to bring the sides together? That’s what we need to work on over the next few months.”
A key issue the secretariat will need to consider is how to address a “loss of trust between different groups of countries”, as well as the “technicalities of how the timeline is constructed”, he says.
Is delivering the reports in time for the global stocktake still possible?
The IPCC maintains that delivering reports in time for the next global stocktake remains possible, if a decision is made by the end of this year.
Speaking to Carbon Brief, Skea says all timeline options in contention are still feasible “in principle”, if countries show flexibility. He counts four different proposals – two of which would see all reports produced before the stocktake in 2028 and two where WG2 and WG3 would be published in 2029.
He says, though, that he is optimistic a “constructive” result can be delivered in Addis Ababa – but stresses it will only be possible with “a lot of hard work”.
Experts have noted that, even if reports are published in 2028, they will come later in the stocktake process.
Dr Matti Goldberg, director of international climate policy at the Woodwell Climate Research Center and former staffer at the UNFCCC secretariat, explains:
“It is already kind of late. If you want to have a meaningful consideration of the IPCC reports in the global stocktake, they need to be there now or at the beginning of the information collection stage. Otherwise, you’ll have a bunch of parties saying: ‘No, can’t do it. It is too short a timeframe, too big a report.’”
The global stocktake is a process that is split into three phases: an information collection phase to gather inputs; a technical assessment of inputs and other evidence; and a “consideration of outputs” phase where countries decide what to collectively take away from the process.
The information phase of the second global stocktake is due to kick off at COP31 in Antalya, Turkey in November 2026. The technical assessment phase will take place from June 2027 to June 2028, giving way to the final political phase that culminates at COP33 in November 2028.
Under the revised AR7 timeline proposed by IPCC co-chairs in Lima, WG1 would be ready during the technical phase of the second global stocktake and WG2 and WG3 would be able to inform its final, political phase.
Goldberg emphasises that the publication of the reports – and their respective summaries for policymakers – in 2028 would mean countries would face “much higher pressure to deliver stronger messages of ambition” in the second global stocktake.
However, he adds that a faster timeline for the reports will not change the “fundamental calculations of interest” that shape international climate politics:
“There are a series of negotiations: first, over the summary of policymakers and then throughout the whole global stocktake. In the end, that is the process that determines a lot of the result.”
De Pryck from the University of Geneva similarly notes that scientific input is not “the only input” to the stocktake:
“It is a political process. So, at the end of the day, science and expertise is very important – but it’s not going to translate directly into the global stocktake.”
What could be the implications of an extended timeline for AR7?
If AR7 reports are not published until after the global stocktake, governments would likely turn to other sources of science in their submissions, experts tell Carbon Brief.
De Pryck explains that a broad range of science was submitted by governments to the first global stocktake. She says this includes the UN Environment Programme’s annual adaptation and emissions gap reports; updates from the International Energy Agency and climate-finance analysis from Oxfam:
“There are quite a lot of other academic and epistemic reports that could be used by countries in the negotiations that, in a way, could support what the IPCC is doing.”
Greenpeace Asia’s Yao Zhe notes that AR7’s special report on climate change and cities, due to be published in 2027, could play a “good scientific basis” for policy discussions around climate mitigation in the absence of the WG3 report from the stocktake.
Climate Analytics’ Bill Hare warns that a failure to align the the IPCC cycle with the global stocktake could result in less robust science being considered:
“There’s a general consensus that the IPCC is the best available science. It is the formal science, if you like, delivered to the Paris Agreement and climate convention. So, if that doesn’t happen, then it opens the space for other sources of so-called science to come in.”
He adds that any disconnect between the global stocktake cycle and the IPCC assessment cycle would be a “major historical break and one which would be used to weaken the international climate process and Paris Agreement”.
The impacts would also be felt within the climate science community, Hare continues. The IPCC’s role in advising the UNFCCC has long provided a “really strong sense of relevance” to many climate scientists, he says:
“That relevance is a very strong motivator for what [scientists] do. I wonder whether the failure of the IPCC to agree timetable alignment would have a negative impact on that. And that wouldn’t be just for this global stocktake cycle, it would be for subsequent ones.”

The post Q&A: Why the standoff between nations over the next IPCC reports matters appeared first on Carbon Brief.
Q&A: Why the standoff between nations over the next IPCC reports matters
The UK avoided the need for gas imports worth £1bn in March 2026 thanks to record electricity generation from wind and solar, reveals Carbon Brief analysis.
Wind generation hit a new record for the month of March on the island of Great Britain, up 38% year-on-year, while solar nearly matched the output of last year’s exceptionally sunny spring.
Together, wind and solar generated 11 terawatt hours (TWh) of electricity in March 2026, up a combined 28% and setting a new record for the month, as shown in the figure below.
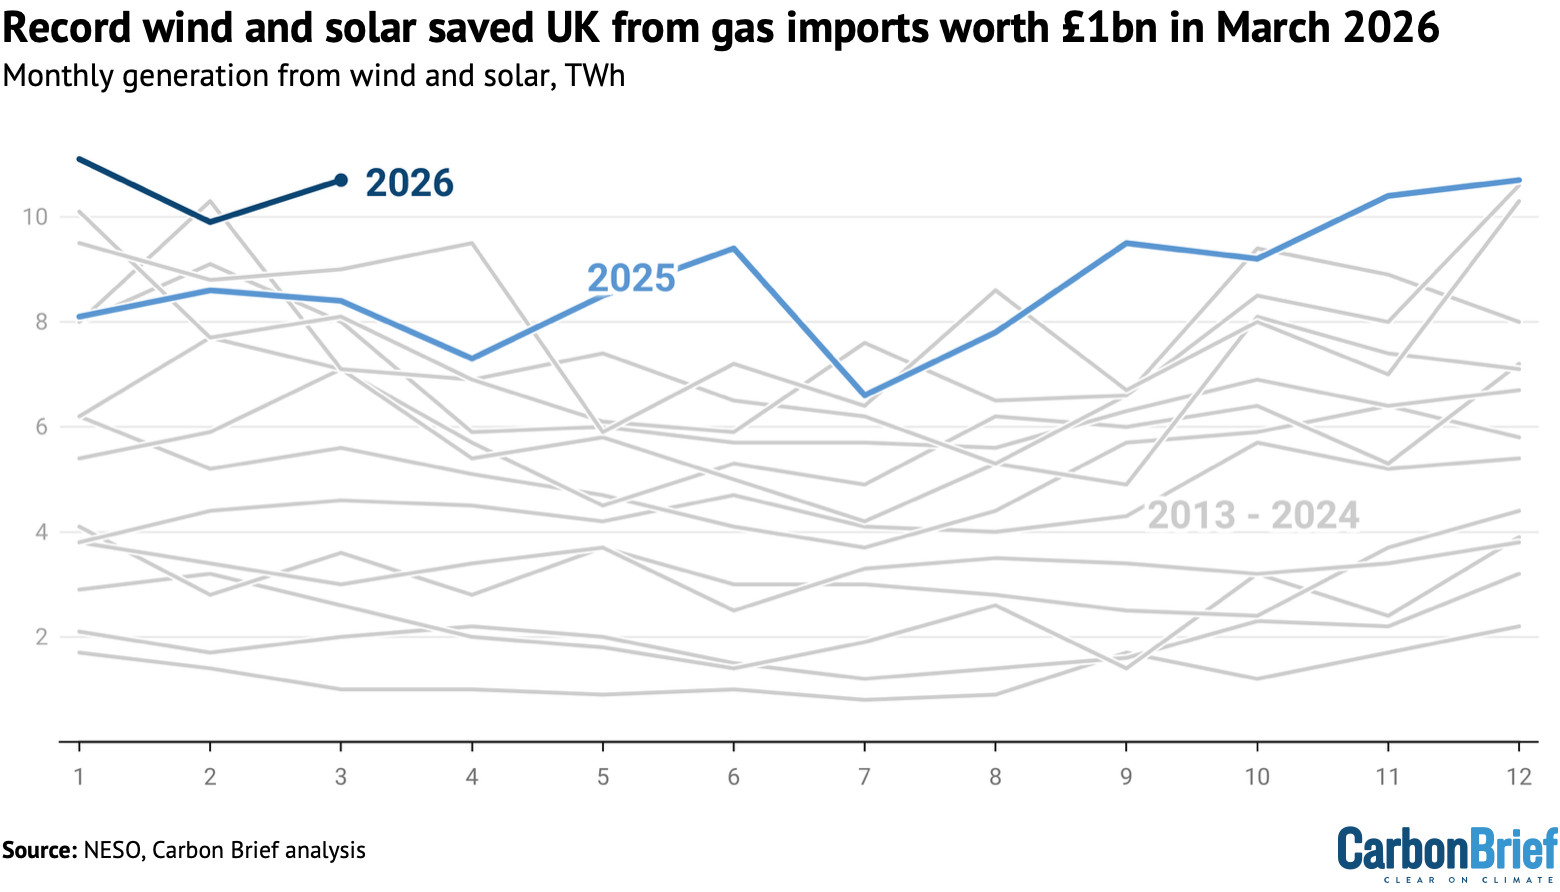
This record wind and solar output avoided the need to import 21TWh of gas – roughly 18 fully loaded tankers of liquified natural gas (LNG) – which would have cost around £1bn at current high prices due to the Iran war.
(This is based on gas costing 130p per therm, or £44 per megawatt hour, compared with the range of 120-170p per therm seen over the past month.)
At the same time, the record output from wind and solar saw electricity generation from gas falling 25% year-on-year in March 2026 to the lowest level ever recorded for the month.
This meant that gas was setting the price of electricity roughly 25% less often in March 2026 than in the same month in 2022, when fossil-fuel prices spiked after Russia’s invasion of Ukraine.

The post Analysis: Record wind and solar saved UK from gas imports worth £1bn in March 2026 appeared first on Carbon Brief.
Analysis: Record wind and solar saved UK from gas imports worth £1bn in March 2026


-
Climate Change8 months ago
Guest post: Why China is still building new coal – and when it might stop
-
Greenhouse Gases8 months ago
Guest post: Why China is still building new coal – and when it might stop
-

 Greenhouse Gases2 years ago
嘉宾来稿:满足中国增长的用电需求 光伏加储能“比新建煤电更实惠”
-
Climate Change2 years ago
Bill Discounting Climate Change in Florida’s Energy Policy Awaits DeSantis’ Approval
-

 Climate Change2 years ago
嘉宾来稿:满足中国增长的用电需求 光伏加储能“比新建煤电更实惠”
-
Climate Change Videos2 years ago
The toxic gas flares fuelling Nigeria’s climate change – BBC News
-

 Renewable Energy5 months ago
Sending Progressive Philanthropist George Soros to Prison?
-

 Carbon Footprint2 years ago
US SEC’s Climate Disclosure Rules Spur Renewed Interest in Carbon Credits