During the 2024 UK general election campaign, politicians and newspapers have used a series of “scary-sounding numbers” to mislead voters about net-zero.
While some of the numbers are accurate in isolation, they have been used in false or misleading ways, shaved of context and typically designed to exaggerate the cost of cutting emissions.
Current prime minister Rishi Sunak, his energy secretary Claire Coutinho and a string of right-leaning newspapers have all been guilty of this approach.
The most common tactics for misleading voters about net-zero include: focusing on the cost of action without mentioning the cost of business-as-usual; mentioning the costs of cutting emissions but not the benefits; and omitting the costs of failing to tackle dangerous climate change.
Below, Carbon Brief factchecks a series of claims made around the election campaign, each of which involves a big number about “costs”. The article explains who made each claim, where the relevant number came from – and the missing context that makes the claim false or misleading.
stat_minus_1
subdirectory_arrow_left
MISLEADING
Hundreds of billions
“We’ve just found a recording that they have put out there from the deputy chancellor from the Labour Party admitting that their [climate] plans will cost hundreds of billions of pounds.”
– Rishi Sunak during BBC leaders’ debate – 26 June 2024
Where it comes from
In what appears to have been a coordinated move, Sunak attacked Labour’s net-zero plans during the final leaders’ debate hosted by BBC News, by citing an article published online the same evening in the Daily Telegraph. The article, which appeared on the newspaper’s frontpage the following morning, is based on public comments by Labour’s Darren Jones in March 2024 about the cost of reaching net-zero emissions by 2050, which is also government policy. The target was legislated in 2019 under Conservative former prime minister Theresa May.
What it excludes
Sunak misleads voters by omitting the fact that his own government – as well as the Conservative manifesto – also support the net-zero by 2050 target. He also ignores the costs of inaction on climate change and the evidence that accelerated action would yield significant economic benefits.
In 2019, the Climate Change Committee estimated that the net cost to the whole economy of reaching net-zero by 2050 would amount to £1.4tn, offset by savings from lower fossil fuel bills of £1.1tn. As set out by the Office for Budget Responsibility (OBR) in 2021, this amounted to a net cost of £321bn over nearly 30 years – consistent with the “hundreds of billions” cited by Labour’s Darren Jones. Furthermore, the OBR estimated that only a quarter of the costs of reaching net-zero would come from public spending and that delaying action towards the target could double the overall cost to the UK. It added that failing to act on climate change would have far greater impacts on the economy and public finances, concluding: “Unmitigated climate change would ultimately have catastrophic economic and fiscal consequences.”
In a 2023 report, the OBR found that continued reliance on gas could be more than twice as costly for the exchequer as reaching net-zero. Separate analysis for trade group Energy UK concluded: “[A]n accelerated transition [to net-zero] could boost the UK’s economy by £240bn in 2050 more than current trajectories…Under the most ambitious scenario, the GDP of each area of the UK would be 5.4%-7.5% greater in 2050 than under the current trajectory.”
close
FALSE
£116bn
“Labour are still not being honest about the costs of their energy policy. Independent energy experts have warned that Labour’s 2030 target would need an extra £116bn of investment, which means one thing…higher taxes for millions of Brits.”
– Claire Coutinho tweet – 25 June 2024
Where it comes from
The figure is based on analysis by consultancy Aurora, which said a total of £116bn would need to be invested during 2025-2035 to reach Labour’s 2030 clean power target. This works at an average of £10.6bn per year, according to Aurora.
What it excludes
The current secretary of state’s phrasing is false. The same Aurora analysis said a total of £105bn would need to be invested during 2025-2035 to meet the government’s own target of clean power by 2035, averaging £9.5bn per year. As such, the “extra” investment is only £11bn over 11 years, or £1bn a year.
Coutinho’s claim that higher investment would mean higher taxes is also false, as electricity sector investment is predominantly from the private sector and paid for via bills. Moreover, Aurora has said, based on the same analysis, that consumer energy bills would be lower under Labour’s 2030 target than under a 2035 clean power goal – or under the current, less ambitious trajectory. Aurora said: “Either scenario will be highly challenging to implement, stretching the limits of deliverability. However, if delivered, increased investment could lead to lower total system costs once the long-term savings from lower gas consumption are included.”
close
FALSE
£30bn
“Ditching Net Zero could save the public sector over £30bn per year for the next 25 years.”
– Reform manifesto – 17 June 2024
Where it comes from
Reform, a climate-sceptic party led and majority owned by Nigel Farage, offers almost no information on how it arrived at this figure. According to the OBR, public-sector spending on net-zero is estimated at around £8bn per year. The only other number mentioned by Reform is for renewable energy subsidies, which it puts at £10bn per year. These are paid by consumers, not the government, such that scrapping them would not save the public sector any money. Instead, Reform proposes to tax renewables by an equivalent amount, which would likely end investor confidence in the UK across the board.
What it excludes
Reform is claiming, implausibly, that the government could save more than it currently spends. It also focuses on the costs of reaching net-zero while ignoring benefits, as well as the cost of business-as-usual. The CCC has estimated that reaching net-zero will entail net investment costs of £44bn per year out to 2050, offset by operational cost savings of £29bn per year, with the annual cost in total averaging £15bn. This excludes wider GDP impacts: the CCC said that the size of the economy, the number of jobs and real disposable incomes would all grow under a net-zero pathway. The CCC’s monetary estimates also exclude the cost of climate impacts, the sizeable health benefits of improved air quality and other externalities. The IEA recently concluded that accelerating climate action towards net-zero “could lead to major reductions in household energy bills”, again purely looking at economic costs and benefits. According to the OBR, the UK government spent £51bn on energy bill support during 2022-23, after gas prices rocketed.
close
FALSE
£2tn
“The UK cost of net-zero has been estimated by the National Grid and others at some £2tn or more. It is so big that no one really knows.”
– Draft Reform manifesto – 19 March 2024
Where it comes from
In 2020, National Grid Electricity System Operator (ESO) estimated the cost of building and operating a net-zero energy system at a cumulative total of £2.8-3tn by 2050. This is the total cost of building and operating the country’s energy system for 30 years.
What it excludes
The Reform statement is false. The same National Grid ESO report said: “Scenarios where we hit net-zero in 2050…incur broadly the same costs as the scenario where we miss our net-zero target.” As such, based on the National Grid ESO analysis, there would not be any additional cost to hitting net-zero relative to running an energy system that does not meet the target. Moreover, in 2021, the Treasury stated: “The costs of global [climate] inaction significantly outweigh the costs of action.”
close
FALSE
£2.8-3tn
“National Grid ESO, the company which manages our electricity supply, has estimated decarbonising Britain’s entire energy system will cost between £2.8tn and £3tn between now and 2050, working out at between £108bn and £115bn a year.”
– Sun comment by Ross Clark – 23 June 2024
Where it comes from
In 2020, National Grid Electricity System Operator (ESO) estimated the cost of the country’s energy system at a cumulative total of £2.8-3tn by 2050. This is the total cost of building and operating the energy system for 30 years.
What it excludes
The climate-sceptic columnist’s statement is false. The same National Grid report said: “Scenarios where we hit net-zero in 2050…incur broadly the same costs as the scenario where we miss our net-zero target.” As such, based on the National Grid ESO analysis, there would not be any additional cost to hitting net-zero, relative to running an energy system that does not meet the target. Furthermore, the £108-115bn annual cost cited by Clark can be compared with the £265bn spent by UK consumers on energy in 2022 – when fossil fuel costs spiked due to Russia’s invasion of Ukraine – including more than £100bn on imported oil and gas alone. These 2022 figures did not include investment in new infrastructure.
close
FALSE
£1,000
“[R]estoring the 2030 ban on the sale of new petrol and diesel cars will cost an estimated extra £1,000 per household per year from 2022 until 2050.”
– Sunday Telegraph article and editorial – 15 June 2024
Where it comes from
The Sunday Telegraph article and accompanying editorial are based on a dossier compiled by free-market thinktank the Institute of Economic Affairs, which, in turn, cites a 2022 report published by consultancy the Centre for Economic and Business Research (CEBR). The CEBR work was funded by Fair Fuel UK, the motoring lobby group run by climate-sceptic Reform candidate for London mayor Howard Cox. The newspaper omits this detail from its article.
What it excludes
The Sunday Telegraph claim is false, because the underlying report from CEBR makes the “simply perverse” assumption that the relative cost of petrol and electric vehicles (EVs) is unchanged for the next 30 years. The assumption that EVs will continue to face a purchase price premium over petrol cars is directly contradicted by the evidence of falling costs, including recent data showing that EVs are now close to up-front price parity in the UK. The Climate Change Committee (CCC) concluded that an earlier combustion-engine car ban would deliver £6bn in cost savings, because EVs have much lower running costs than petrol cars, again directly contradicting the CEBR and Sunday Telegraph claims. When Sunak delayed the combustion-car ban from 2030 to 2035, the CCC said this was “likely to increase…motoring costs for households”, adding that EVs were “significantly cheaper than petrol or diesel vehicles to own and operate”.
check
TRUE
£265bn
“The UK spent a staggering £265bn on energy in 2022 – the most recent data available – including more than £100bn on imported oil and gas alone”
– Tweet by Carbon Brief’s Simon Evans – 8 February 2024
Where it comes from
This is the cost of energy – the majority of it being fossil fuels – bought in the UK in 2022 at market prices, reflecting the cost to consumers of heat, power and transport fuel. The data was the most recently available at time of publication and covers the first year of Russia’s invasion of Ukraine, when Russia restricted gas supplies to Europe and sent fossil fuel prices rocketing. In the pre-crisis year of 2021, the UK spent £184bn on energy.
What it excludes
These figures do not include investment in energy-related infrastructure, such as power plants, pylons, boilers, cars or heat pumps. Many conversations about the cost of reaching net-zero ignore the substantial costs of the status quo, which is heavily reliant on volatile fossil fuels.
The post Factcheck: How ‘scary-sounding numbers’ are being used to mislead the UK about net-zero appeared first on Carbon Brief.
Factcheck: How ‘scary-sounding numbers’ are being used to mislead the UK about net-zero
Greenhouse Gases
DeBriefed 24 October 2025: EU 2040 climate goal progress; Shipping industry carbon price delayed; Europe’s indigenous people take Finland to court
Welcome to Carbon Brief’s DeBriefed.
An essential guide to the week’s key developments relating to climate change.
This week
EU leaders agreed climate goal ‘truce’
‘BREAKTHROUGH’: EU leaders have reached a “breakthrough” on climate issues that “increases the likelihood” that the bloc will be able to sign off on its 2040 climate goal before COP30 in November, reported Bloomberg. Leaders reached a “truce” after agreeing to a raft of “enabling conditions”, designed to support carmakers and other energy-intensive industries through a “green transition”, it added.
‘COMPETING GOALS’: Reuters reported that leaders agreed “to proceed with the 2040 target, but [to] leave details for ministers to approve at a 4 November meeting”. It added that the European Commission had “promised to amend some climate measures” to win support from member states, including “controlling” carbon prices in the upcoming market for heat and transport fuels. France24 noted that leaders discussed how to manage the bloc’s “competing goals” of supporting business while playing a “lead role in the climate fight”.
Shipping industry delayed carbon price
NEGOTIATIONS COLLAPSE: Just hours after the previous issue of DeBriefed was published, member states of the UN’s International Maritime Organization agreed to delay a vote on whether to formally adopt a global carbon price for shipping by a year, reported the National. It said the negotiations “collapsed under US pressure”, meaning they were unable to finalise a deal agreed in April that would have “made shipping the first global industry subject to a carbon pricing system”. [Carbon Brief covered the deal and what it would have meant for shipping emissions at the time.]
‘MAJOR VICTORY’: The Financial Times described the delay as a “major victory” for US president Donald Trump’s “campaign to block a climate agreement for the global shipping industry” and “part of the wider Trump administration drive to sell more of its oil, coal and gas”. According to Agence France-Presse, the UN called the delay a “missed opportunity” and the European Commission said it was “regrettable”
‘REGRETABLE DERAILMENT’: A Financial Times editorial said the outcome was a “regrettable derailment” and “one of Trump’s most successful attempts yet to force all countries, rich and poor, to back his push to prolong the era of fossil fuels”. Elsewhere, US secretary of state Marco Rubio wrote a letter to the Wall Street Journal, outlining how the administration had “thwarted the UN’s tax”, dubbing the delay a “diplomatic victory” for the US.
Around the world
- DISASTER ALERTS: A new report from the UN’s World Meteorological Organization has called for a worldwide disaster alerts system as extreme weather events are leaving millions of people vulnerable, reported Al Jazeera.
- FOREST FUND: The World Bank has agreed to host the Tropical Forest Forever Fund (TFFF), being pushed by the Brazilian COP30 presidency Brazil, according to Folha de São Paulo. Separately, the country’s state-owned oil company Petrobras has been granted permission to drill for oil near the mouth of the Amazon, reported the Guardian.
- ‘GREEN JOBS’: The UK government announced a national clean-energy jobs plan, designed to “create…an extra 400,000 green jobs” in the next five years, the Guardian said. Meanwhile, UK prime minister Keir Starmer made a “last-minute decision” to attend COP30 in Brazil in November, the Financial Times reported.
- ‘BEAUTIFUL CHINA’: After a meeting in Beijing, top Chinese policymakers have listed “building a Beautiful China” as a “primary objective” for the 15th five-year plan covering 2026-2030, said International Energy Net. The concept, described in Carbon Brief’s glossary, covers tackling pollution and meeting China’s carbon neutrality targets..
$101bn
The record-high cost of “climate disasters” in the US in the first half of 2025, according to new research from the Climate Central group reported by the Guardian.
Latest climate research
- Between 1997 and 2021, Antarctic ice shelves saw a decrease in “damaged area” | Nature Climate Change
- Reducing food waste and dietary shifts could help halve emissions related to meat consumption in US cities | Nature Climate Change
- In an “overshoot” scenario, where the world temporarily passes 1.5C of warming, permafrost area may “effectively recover” once temperatures fall, but carbon losses will be “largely irreversible” | Earth System Dynamics
(For more, see Carbon Brief’s in-depth daily summaries of the top climate news stories on Monday, Tuesday, Wednesday, Thursday and Friday.)
Captured
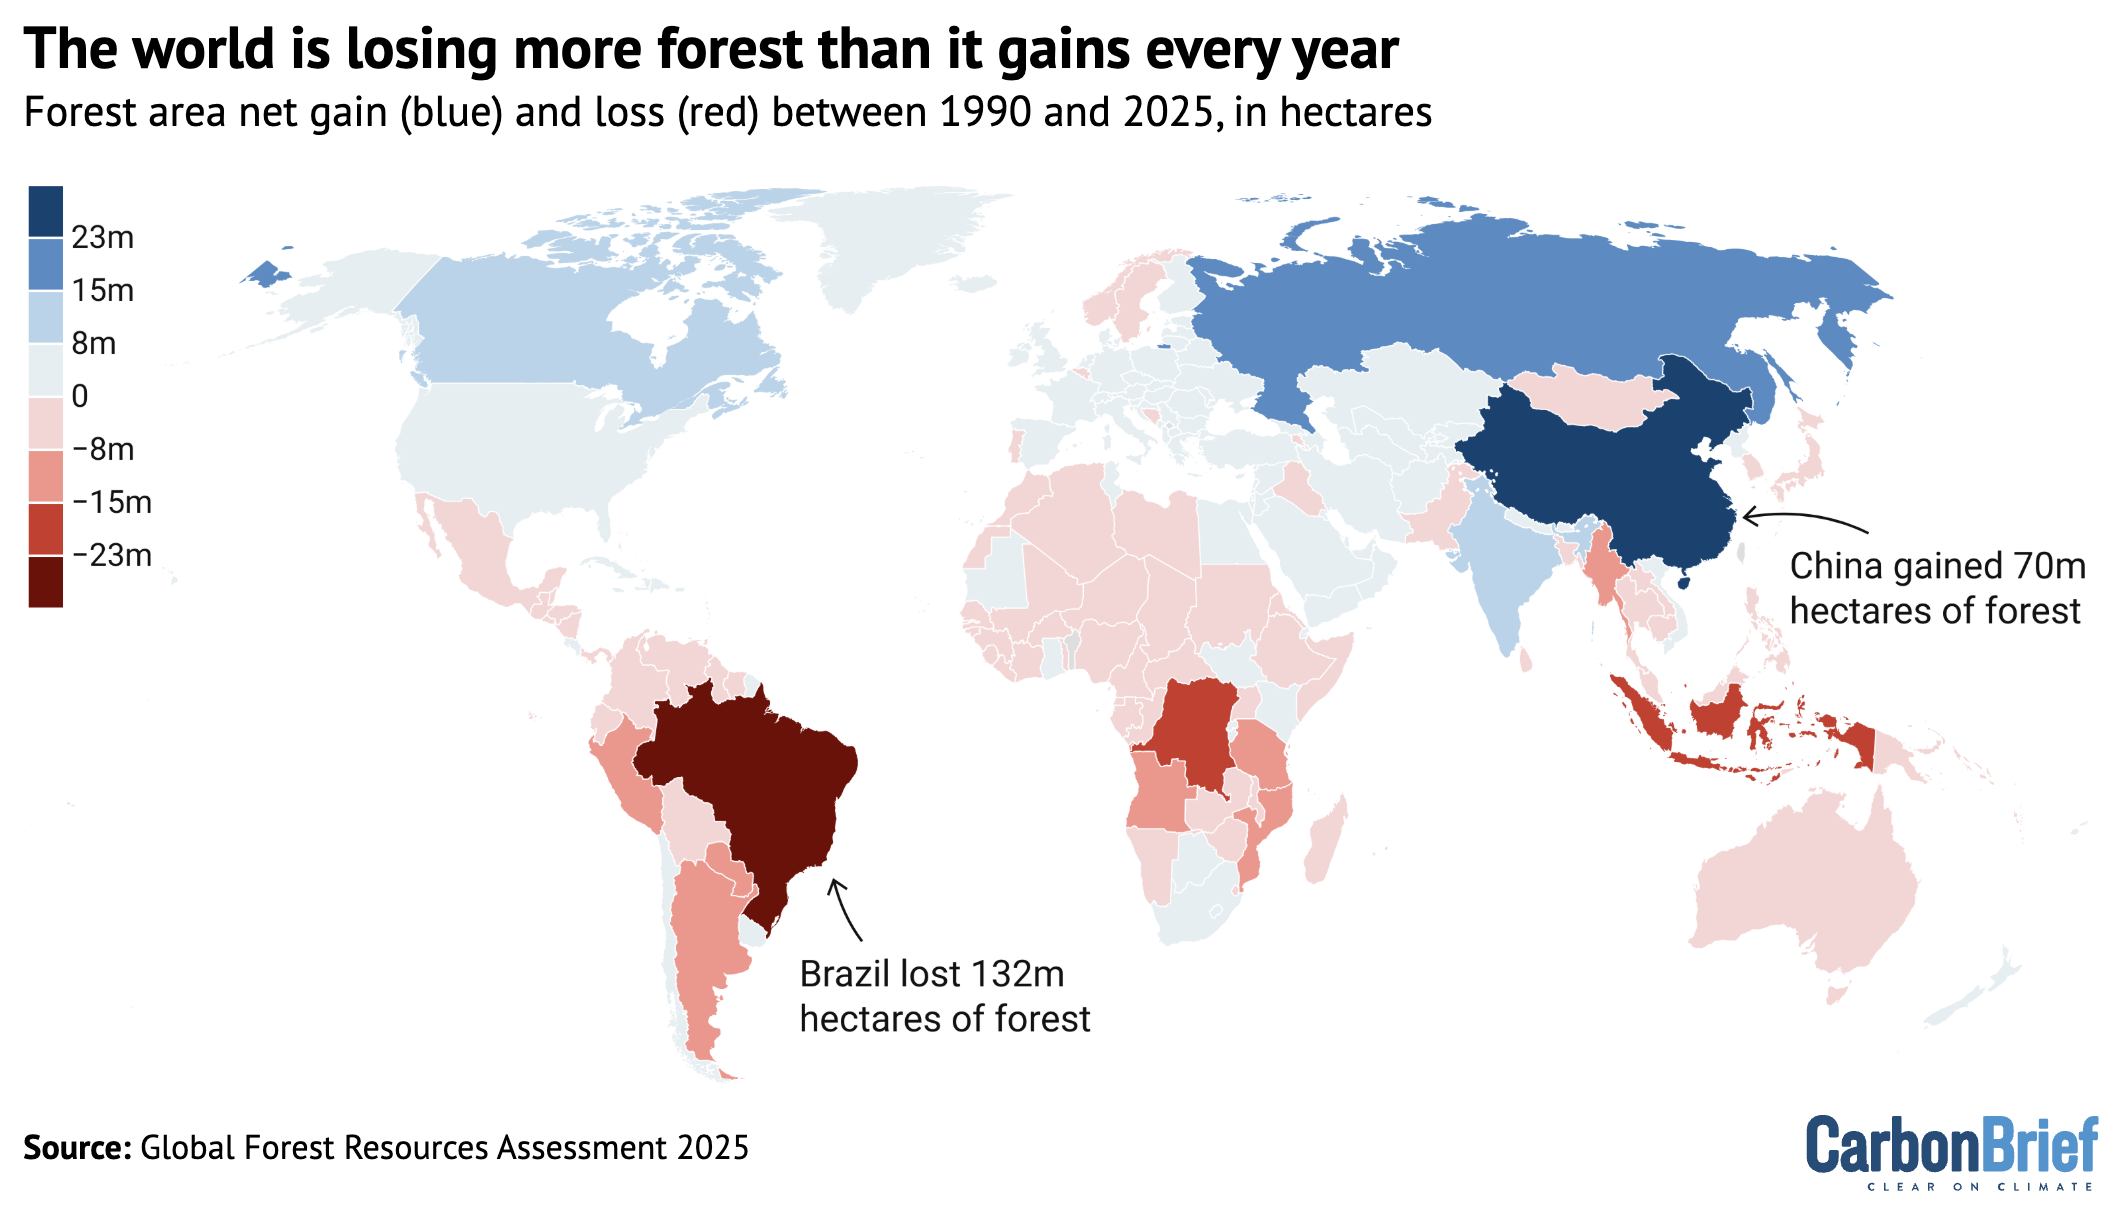
The amount of forest being lost around the world has reduced by millions of hectares each year in recent decades, Carbon Brief reported, based on the Global Forest Resources Assessment from the UN’s Food and Agriculture Organization. The report found that an estimated 10.9m hectares (Mha) of land was deforested each year between 2015 and 2025, nearly 7Mha less than the annual loss over 1990-2000. However, as the map above shows, more forest is still lost than gained each year. Between 2015 and 2025, there was an average 6.8Mha of forest growth each year, but 10.9Mha of loss.
Spotlight
The Sámi people take Finland to court
This week, Carbon Brief reports on the launch of a “landmark” legal claim by the Indigenous Sámi people against the government of Finland, focused on the interplay between climate change and cultural traditions.
In June, 33 members of the Muddusjärvi Reindeer Herders’ Cooperative (MPLK), a Sámi community in northern Finland, brought a legal complaint to the UN human rights committee in Geneva.
It alleged that the Finnish government had allowed multiple breaches of the International Covenant on Civil and Political Rights (ICCPR), which sets out the right to enjoy one’s culture, family life, non-discrimination and self-determination.
The MPLK has practised “nature-based Sámi reindeer herding” for centuries in Finland, as part of one of three remaining herding communities that use the endangered Inari Sámi language. The Sámi are the only Indigenous people recognised in Europe.

Changing conditions
Within its complaint, the MPLK said it is being dispossessed from land traditionally used for reindeer herding, as a result of climate change and decades of intensive logging by the Finnish state-owned forestry agency Metsähallitus. These have “severely damaged” the land they depend on, the group’s lawyers Hogan Lovells said.
In particular, the loss of lichen-rich, old-growth forests and changes to snow conditions have made it harder for reindeer to access natural food sources, creating an “existential threat” that “places in jeopardy the viability of the MPLK community’s way of life”, according to the complaint.
While there are additional funds provided by the Finnish government to compensate reindeer herders during harsh winters, this does not go far enough, the MPLK argued. For example, herders lost €32m between 2019 and 2020, but the MPLK only received €6m in compensation.
There have already been a number of lawsuits brought by the Sámi people across the Nordic countries, in an effort to protect their lands and traditions.
This includes the Norwegian government having to pay out millions to Sámi reindeer herders, an ongoing case in Sweden and two UN committees finding that Finland had violated Sámi rights to culture and land through mineral exploration permits on their territory.
A new precedent
For the MPLK case, Hogan Lovells are relying on a precedent set at the committee in 2022 in a case brought by an indigenous group in Australia, whereby the government was ordered to compensate Torres Straits islanders who argued that climate change had a direct harmful consequence on their livelihood, culture and traditional ways of life.
Finnish human rights law professor and human rights practitioner Martin Scheinin was involved in that case and is now co-counsel for the MPLK complaint. He told Carbon Brief that he had been “thrilled” by the 2022 outcome:
“The [UN committee] broke [a] new path by focusing on Australia’s adaptation obligations as positive human rights obligations. As the committee also established that the right of minorities and Indigenous peoples to enjoy their own culture includes the right to transmit a distinctive way of life to new and even future generations, it was natural that the Indigenous Sámi people in Finland…want to build upon all these elements in their own case before the same committee.”
A formal response from the Finnish government to the complaint is expected this month.
Watch, read, listen
INDONESIA’S ‘ENERGY PARADOX’: A new episode of the China-Global South Podcast discussed how China sits at the heart of Indonesia’s “energy paradox”.
‘RARE-EARTHS TRAP’: Simon Nixon, former chief leader writer for the Times, wrote on his Substack about how the “west lost” to China, after the country “spent decades laying its rare-earths trap”.
ANIMAL OBSTRUCTION: The latest episode of the Drilled podcast discussed how the animal agriculture industry has – and still does – “obstruct…climate policy”.
Coming up
- 28 October: NDC 3.0 synthesis report
- 28 October: Tanzania, presidential and parliament elections
- 29 October: UNEP Adaptation Gap Report 2025
- 29 October: Netherlands, parliamentary elections
- 29 October: UK’s “carbon budget delivery plan”
Pick of the jobs
- Imperial College London, project manager | Salary: £41,005-£45,616pa. Location: London, England.
- UN Food and Agriculture Organization, policy officer (environment and climate change) | Salary: Unknown. Location: Santiago, Chile
- Nature Energy, associate or senior editor | Salary: $80,000-$95,000. Location: New York, US.
- EBRD, analyst, climate risk | Salary: Unknown. Location: London, England.
- Local Storytelling Exchange, freelance associate storytellers | Salary: £12,000 for 60 days. Location: Wales.
DeBriefed is edited by Daisy Dunne. Please send any tips or feedback to debriefed@carbonbrief.org.
This is an online version of Carbon Brief’s weekly DeBriefed email newsletter. Subscribe for free here.
The post DeBriefed 24 October 2025: EU 2040 climate goal progress; Shipping industry carbon price delayed; Europe’s indigenous people take Finland to court appeared first on Carbon Brief.
Greenhouse Gases
UN report: Five charts showing how global deforestation is declining
The amount of forest lost around the world has reduced by millions of hectares each year in recent decades, but countries are still off track to meet “important” deforestation targets.
These are the findings of the Global Forest Resources Assessment – a major new report from the UN’s Food and Agriculture Organization – which says that an estimated 10.9m hectares (Mha) of land was deforested each year between 2015 and 2025.
This is almost 7Mha less than the amount of annual forest loss over 1990-2000.
Since 1990, the area of forest destroyed each year has halved in South America, although it still remains the region with the highest amount of deforestation.
Europe was the only region in the world where annual forest loss has increased since 1990.
Agriculture has historically been the leading cause of deforestation around the world, but the report notes that wildfires, climate change-fuelled extreme weather, insects and diseases increasingly pose a threat.
The Global Forest Resources Assessment is published every five years. The 2025 report compiles and analyses national forest data from almost every country in the world over 1990-2025.
Carbon Brief has picked out five key findings from the report around deforestation, carbon storage and the amount of forest held within protected areas around the world.
1. Rates of deforestation are declining around the world
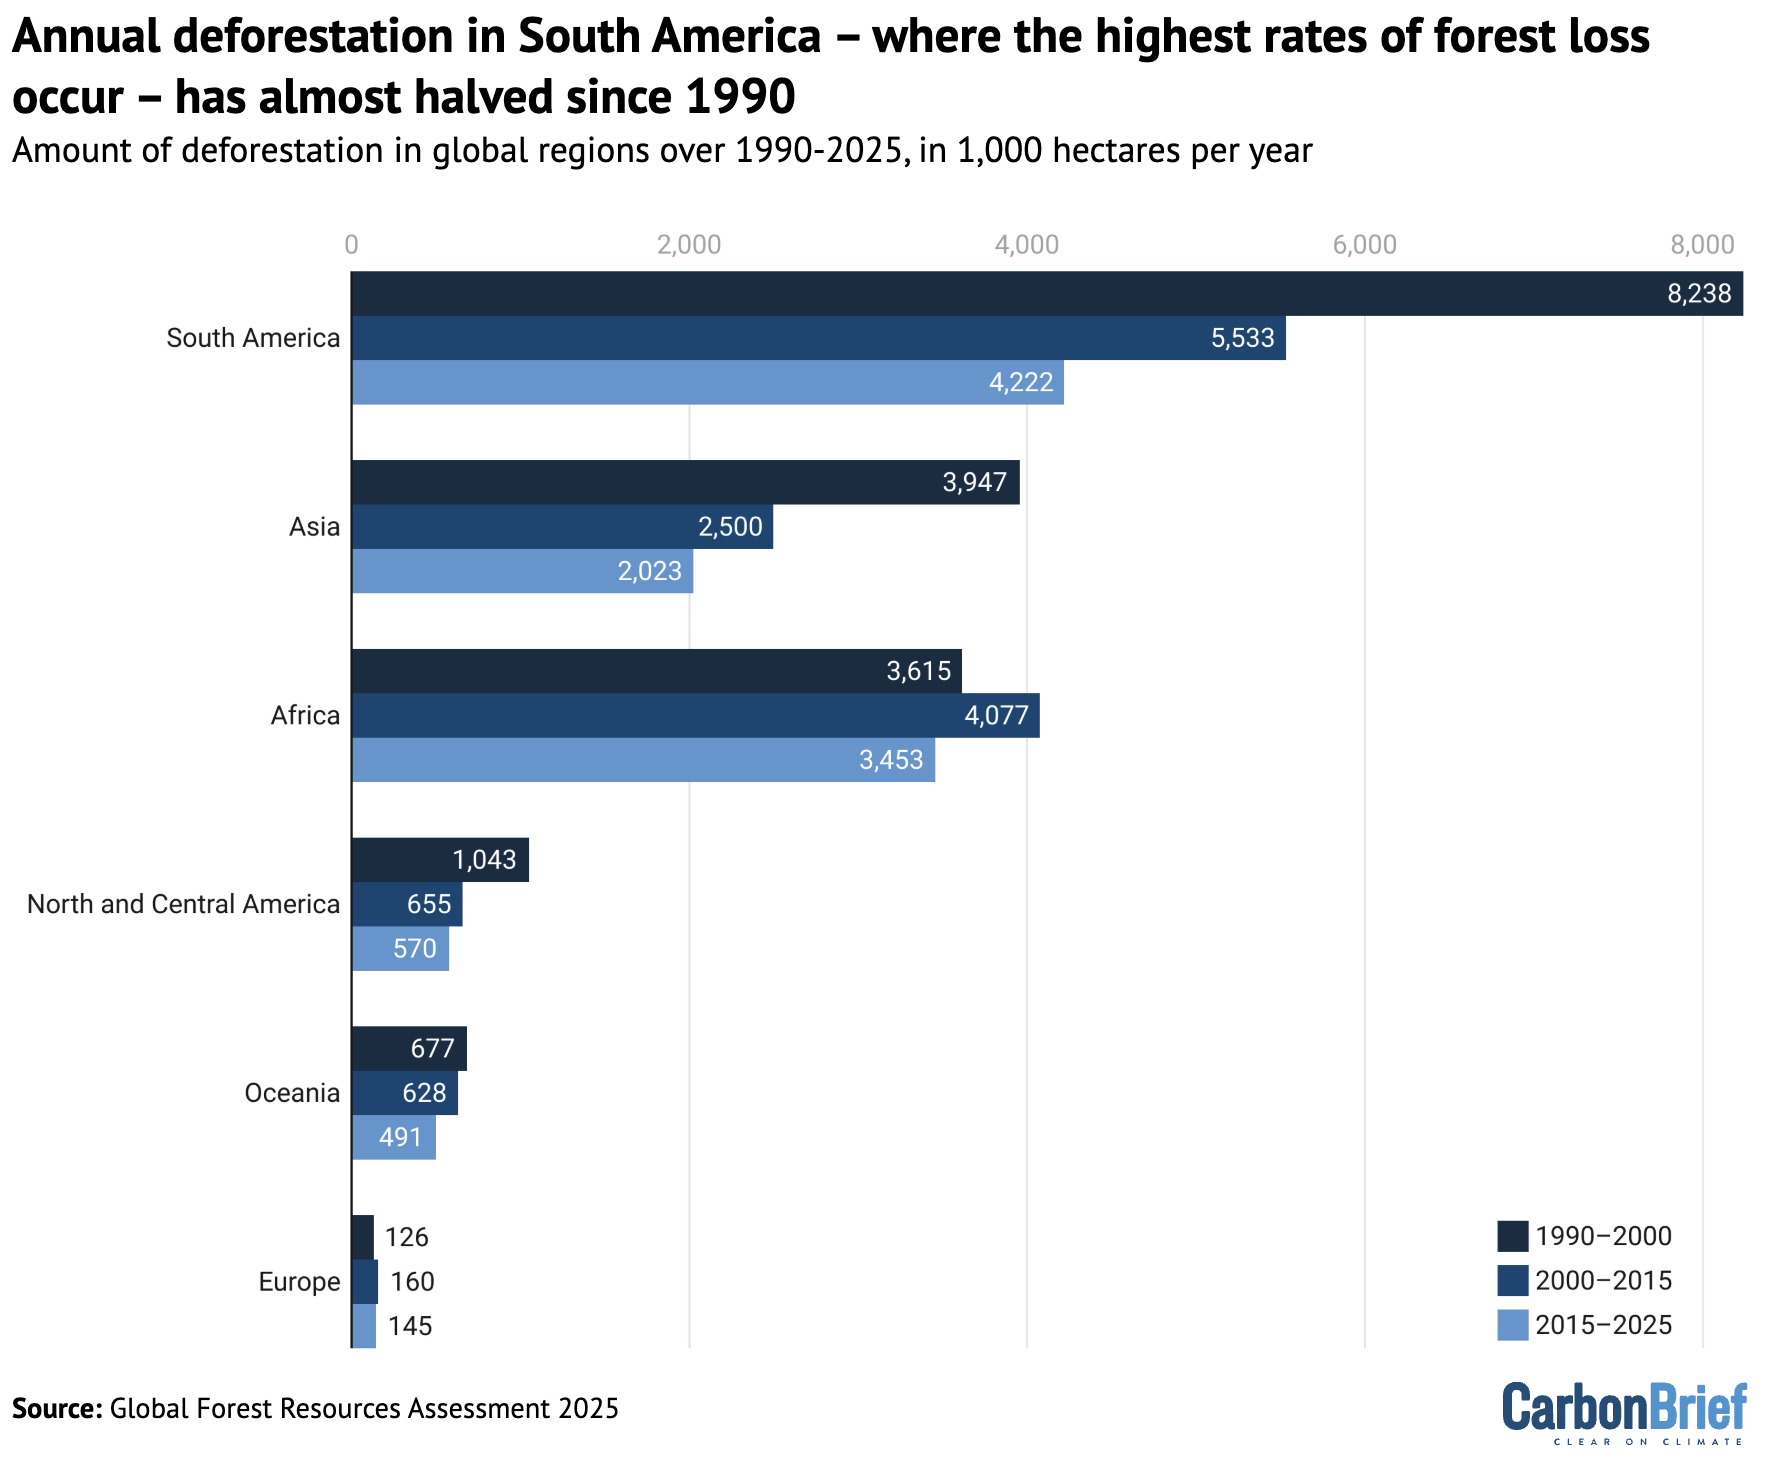
Rates of annual deforestation, in thousands of hectares, in South America, Asia, Africa, North and Central America, Oceania and Europe over 1990-2000 (dark blue), 2000-15 (medium blue) and 2015-25 (light blue). Source: Global Forest Resources Assessment 2025
In total, around 489Mha of forest have been lost due to deforestation since 1990, the new report finds. Most of this – 88% – occurred in the tropics.
This breaks down to around 10.9Mha of forest lost each year between 2015 and 2025, a reduction compared to 13.6Mha of loss over 2000-15 and 17.6Mha over 1990-2000.
Deforestation refers to the clearing of a forest, typically to repurpose the land for agriculture or use the trees for wood.
The chart above shows that South America experiences the most forest loss each year, although annual deforestation levels have halved from 8.2Mha over 1990-2000 to 4.2Mha over 2015-25.
Annual deforestation in Asia also saw a sizable reduction, from 3.9Mha over 1990-2000 to 2Mha over 2015-25, the report says.
Europe had the lowest overall deforestation rates, but was also the only region to record an increase over the last 35 years, with deforestation rates growing from 126,000 hectares over 1990-2000 to 145,000 hectares in the past 10 years.
Despite the downward global trend, FAO chief Dr Qu Dongyu notes in the report’s foreword that the “world is not on track to meet important global forest targets”.
In 2021, more than 100 countries pledged to halt and reverse global deforestation by 2030. But deforestation rates in 2024 were 63% higher than the trajectory needed to meet this 2030 target, according to a recent report from civil society groups.
The goals of this pledge were formally recognised in a key text at the COP28 climate summit in Dubai in 2023, which “emphasise[d]” that halting and reversing deforestation and forest degradation by 2030 would be key to meeting climate goals.
2. Global net forest loss has more than halved since 1990
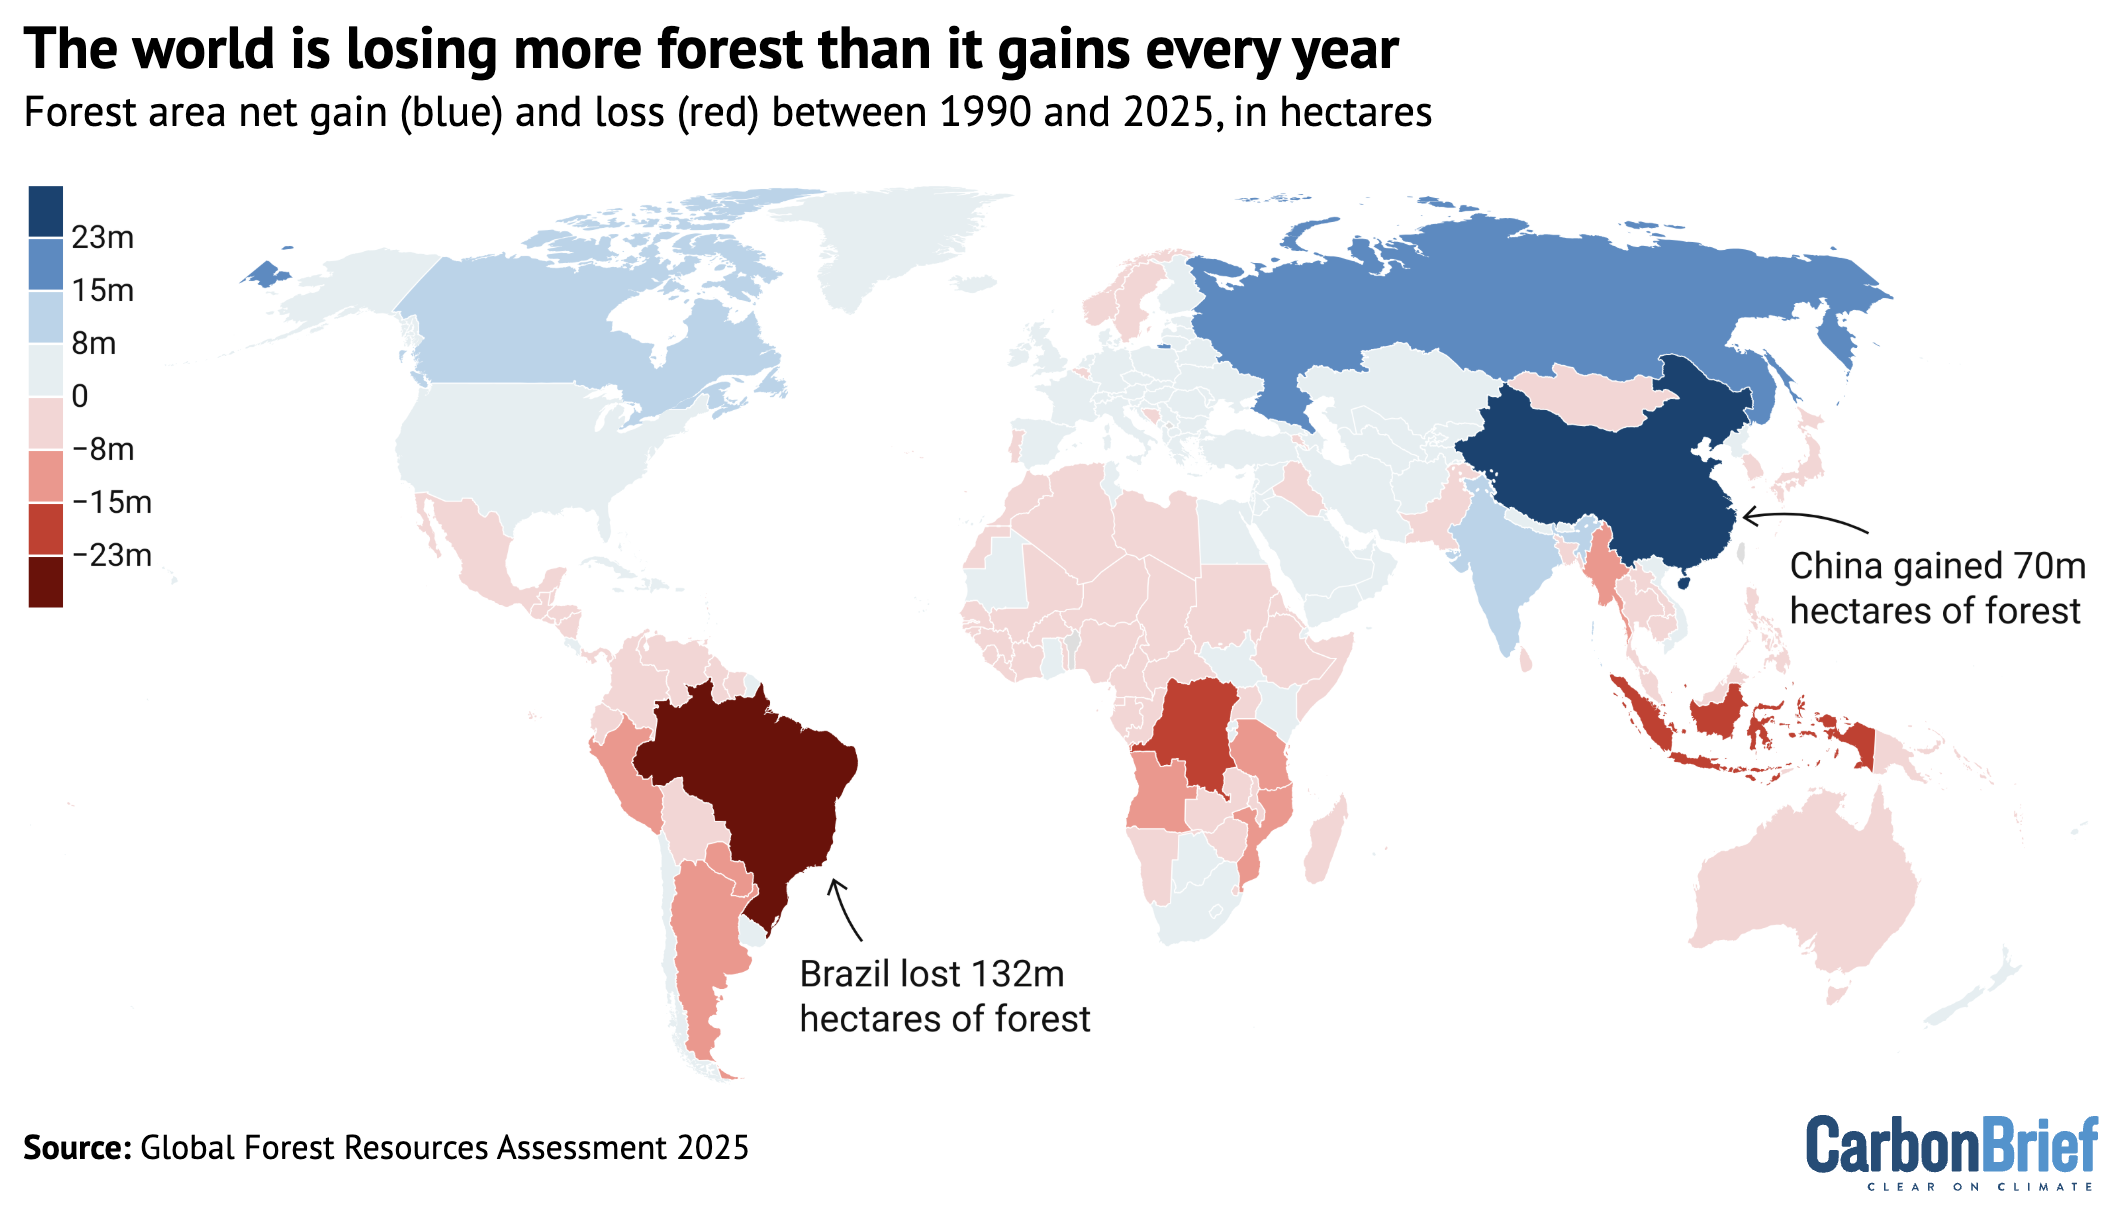
Forest area net change by country between 1990 and 2025, in hectares. Source: Global Forest Resources Assessment 2025
The new report finds that forests cover more than 4bn hectares of land, an area encompassing one-third of the planet’s land surface.
More than half of the world’s forested area is located in just five countries: Russia, Brazil, Canada, the US and China.
The map above shows that, overall, more forest is lost than gained each year around the world. There was 6.8Mha of forest growth over 2015-25, but 10.9Mha of forest lost.
The annual rate of this global net forest loss – the amount that deforestation has exceeded the amount regrown – has more than halved since 1990, dropping from 10.7Mha over 1990-2000 to 4.1Mha over 2015-25.
The report says this change was due to reduced deforestation in some countries and increased forest expansion in others. However, the rate of forest expansion has also slowed over time – from 9.9Mha per year in 2000-15 to 6.8Mha per year in 2015-25.
There are many driving factors behind continuing deforestation. Agriculture has historically been the leading cause of forest loss, but wildfire is increasingly posing a threat. Wildfires were the leading driver of tropical forest loss in 2024 for the first time on record, a Global Forest Watch report found earlier this year.
The new UN report says that an average of 261Mha of land was burned by fire each year over 2007-19. Around half of this area was forest. Around 80% of the forested land impacted by fires in 2019 was in the subtropics – areas located just outside tropical regions, such as parts of Argentina, the US and Australia.
The report notes that fire is widely used in land management practices, but uncontrolled fires can have “major negative impacts on people, ecosystems and climate”.
It adds that researchers gathered information on fires up as far as 2023, but chose to focus on 2007-19 due to a lack of more recent data for some countries.
A different report from an international team of scientists recently found that fires burned at least 370Mha of land – an area larger than India – between March 2024 and February 2025.
3. Many countries are hugely increasing their forest area

Top 10 countries for annual net gain (blue) and net loss (red) of forest area over 2015-25, in 1,000 hectares per year. Source: Global Forest Resources Assessment 2025
Globally, deforestation is declining, but the trend varies from country to country.
The chart above shows that some nations, such as China and Russia, added a lot more forest cover than they removed in the past decade through, for example, afforestation programmes.
But in other countries – particularly Brazil – the level of deforestation far surpasses the amount of forest re-grown.
Deforestation in Brazil dropped by almost one-third between 2023 and 2024, news outlet Brasil de Fato reported earlier this year, which was during the time Luiz Inácio Lula da Silva took over as president. The new UN report finds that, on average, Brazil lost 2.9Mha of forest area each year over 2015-25, compared to 5.8Mha over 1990-2000.
Russia’s net gain of forest cover increased significantly since 1990 – growing from 80,400ha per year in 1990-2000 to 942,000ha per year in 2015-25.
In China, although it is also planting significant levels of forest, the forest level gained has dropped over time, from 2.2Mha per year in 2000-15 to 1.7Mha per year in 2015-25.
Levels of net forest gain in Canada also fell from 513,000ha per year in 2000-15 to 82,500ha per year in 2015-25.
In the US, the net forest growth trend reversed over the past decade – from 437,000ha per year of gain in 2000-15 to a net forest loss of 120,000ha per year from 2015 to 2025.
Oceania reversed a previously negative trend to gain 140,000ha of forests per year in the past decade, the report says. This was mainly due to changes in Australia, where previous losses of tens of thousands of hectares each year turned into an annual net gain of 105,000ha each year by 2015-25.
4. The world’s forests hold more than 700bn tonnes of carbon
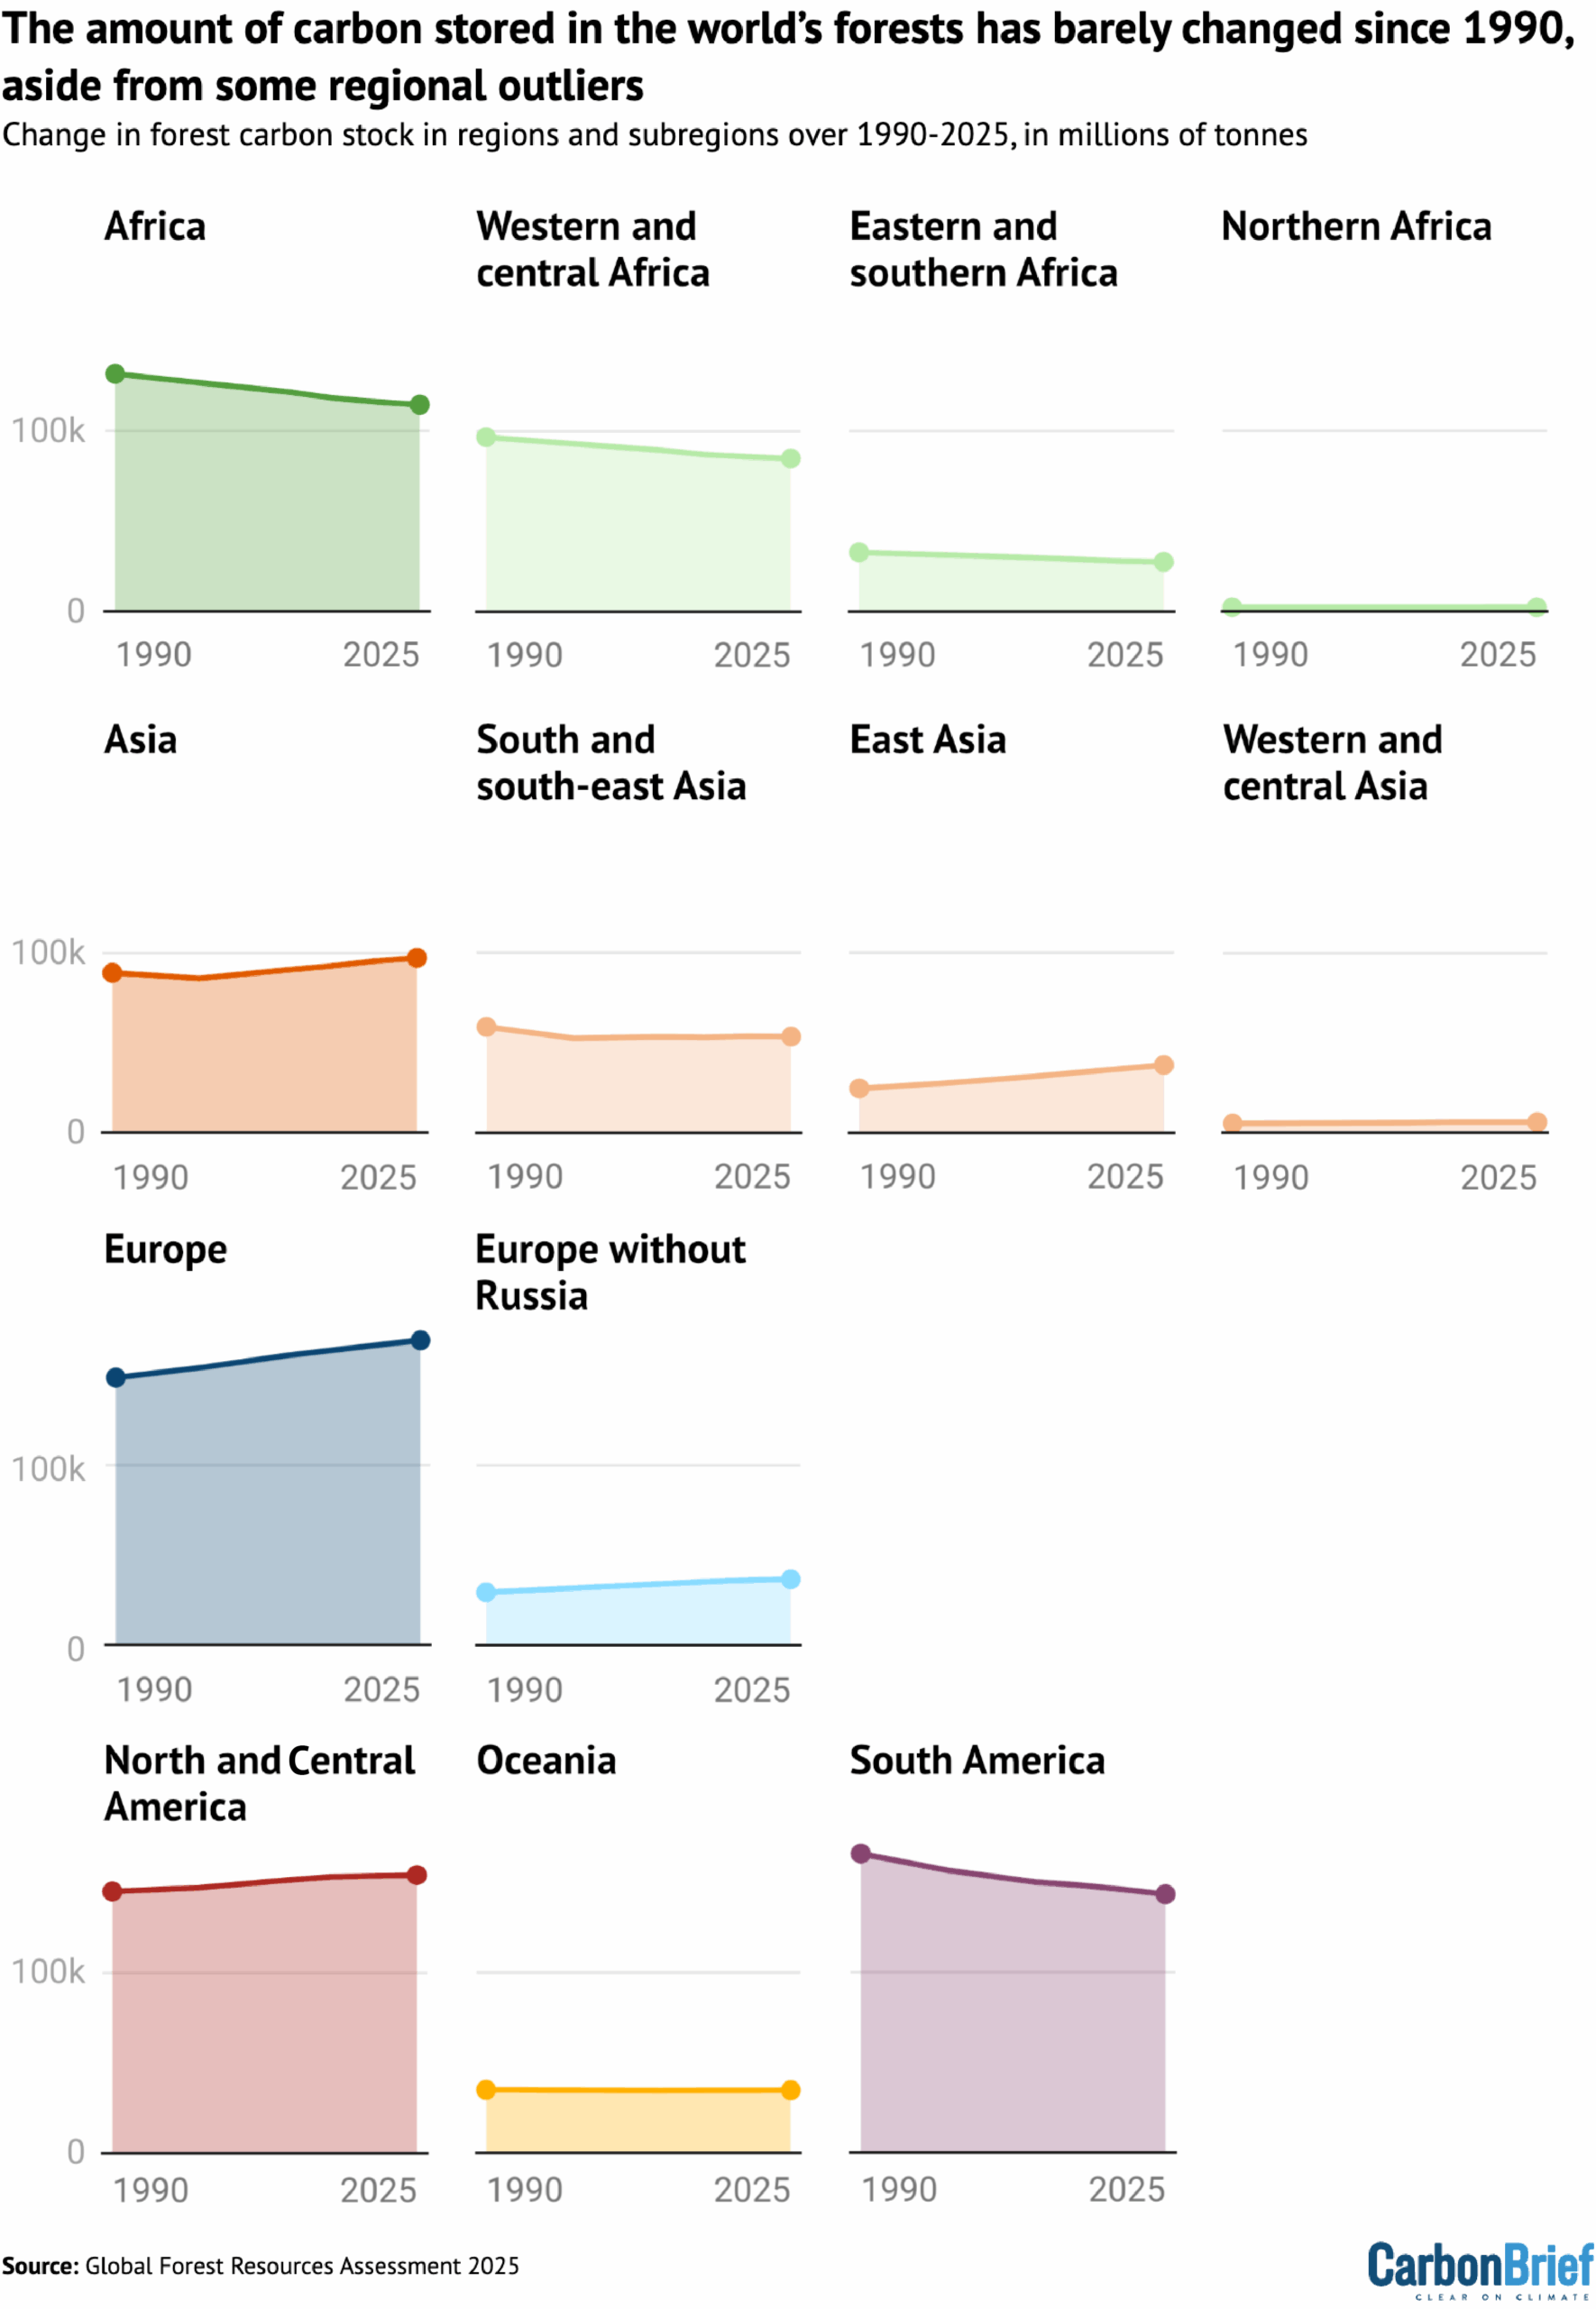
Changes in forest carbon stock by region and subregion of the world over 1990-2025. Source: Global Forest Resources Assessment 2025
The “carbon stock” of a forest refers to how much carbon is stored in its trees and soils. Forests are among the planet’s major carbon sinks.
The new report estimates that forests stored an estimated 714bn tonnes, or gigatonnes, of carbon (GtC) in 2025.
Europe (including Russia) and the Americas account for two-thirds of the world’s total forest carbon storage.
The global forest carbon stock decreased from 716GtC to 706GtC between 1990 and 2000, before growing slightly again by 2025. The report mainly attributes this recent increase to forest growth in Asia and Europe.
The report notes that the total amount of carbon stored in forests has remained largely static over the past 35 years, but with some regional differences, as highlighted in the chart above.
The amount of carbon stored in forests across east Asia, Europe and North America is “significantly higher” now due to expanded forest areas, but it is lower in South America, Africa and Central America.
Several studies have shown that there are limitations on the ability of forests to keep absorbing CO2, with difficulties posed by hotter, drier weather fuelled by climate change.
A 2024 study found that record heat in 2023 negatively impacted the ability of land and ocean sinks to absorb carbon – and that the global land sink was at its weakest since 2003.
Another study, published in 2022, said that drying and warming as a result of deforestation reduces the carbon storage ability of tropical forests, especially in the Congo basin and the Amazon rainforest.
5. Around one-fifth of the world’s forests are located in protected areas
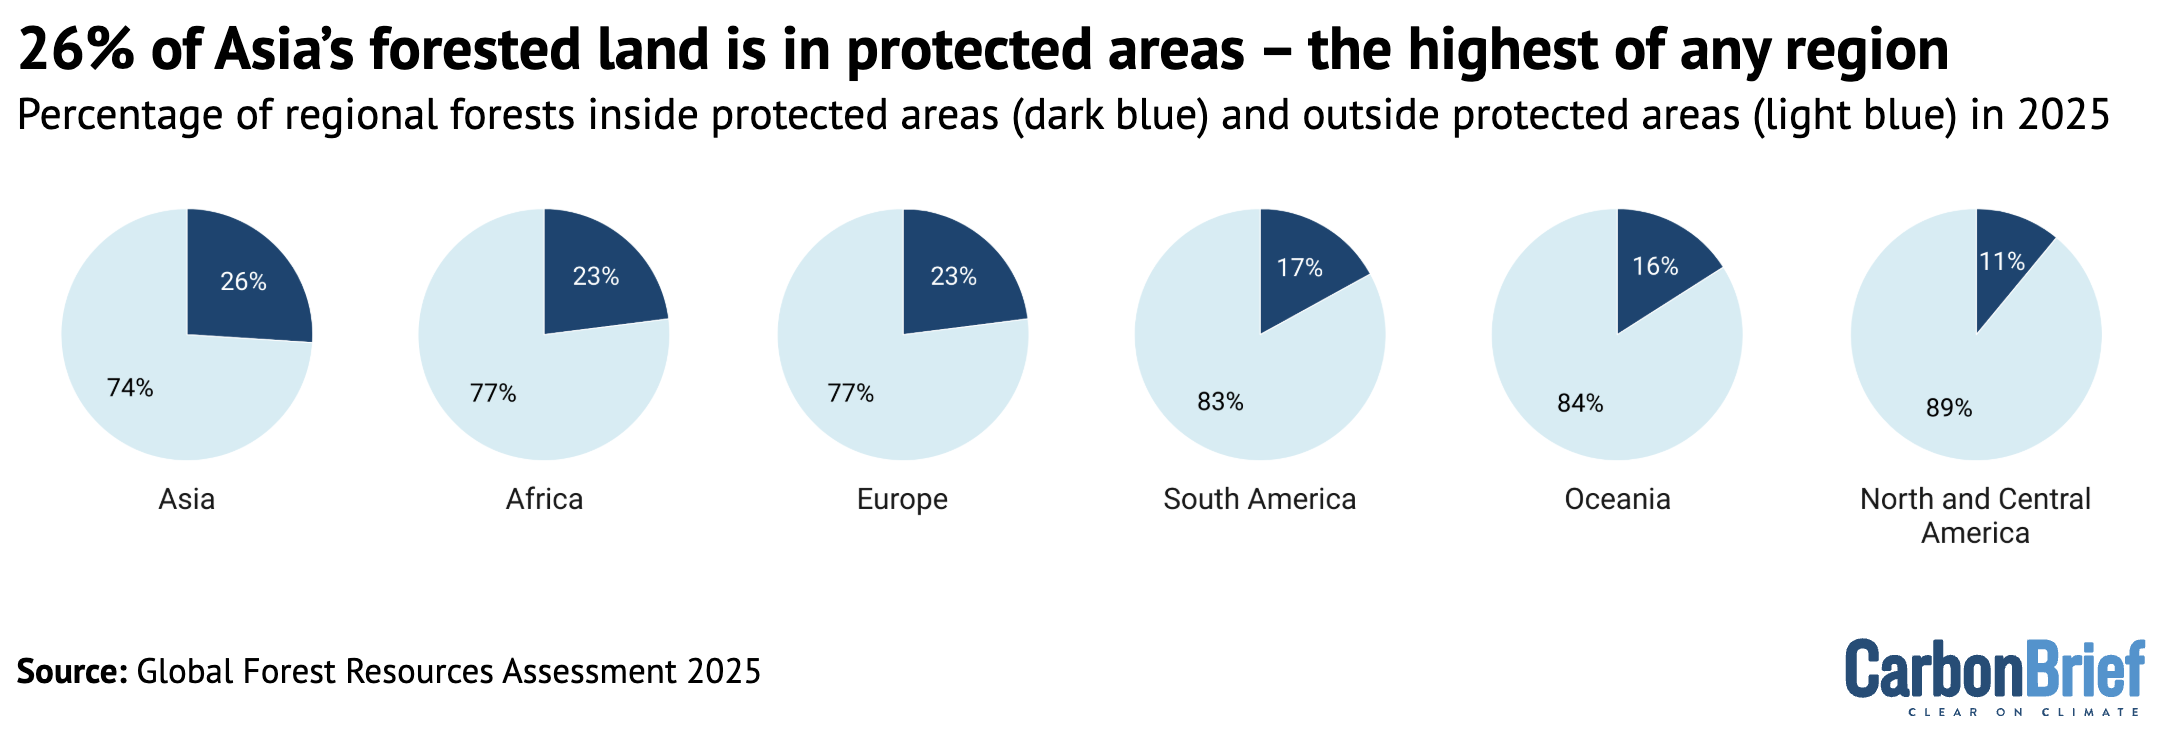
The percentage of forest land in Asia, Africa, Europe, South America, Oceania and North and Central America contained inside protected areas (dark blue) and outside protected areas (light blue) in 2025. Source: Global Forest Resources Assessment 2025
The amount of forested land located in protected areas increased across all regions between 1990 and 2025.
For an area to be considered “protected”, it must be managed in a way that conserves nature.
Around 20% of the world’s forests are located in these protected areas, the new report finds, which amounts to 813Mha of land – an area almost the size of Brazil.
Nearly every country in the world has pledged to protect 30% of the Earth’s land and sea by 2030. However, more than half of countries have not committed to this target on a national basis, Carbon Brief analysis showed earlier this year.
Almost 18% of land and around 8% of the ocean are currently in protected areas, a UN report found last year. The level is increasing, the report said, but considerable progress is still needed to reach the 2030 goal.
The new UN report notes that Europe, including Russia, holds 235Mha of protected forest area, which is the largest of any region and accounts for 23% of the continent’s total forested land.
As highlighted in the chart above, 26% of all forests in Asia are protected, which is the highest of any region. The report notes that this is largely due to a vast amount of protected forested land in Indonesia.
Three countries and one island territory reported that upwards of 90% of their forests are protected – Norfolk Island, Saudi Arabia, Cook Islands and Uzbekistan.
The post UN report: Five charts showing how global deforestation is declining appeared first on Carbon Brief.
UN report: Five charts showing how global deforestation is declining
Greenhouse Gases
Rapid emissions cuts would avoid 64cm of ‘locked in’ sea level rise by 2300
Cutting emissions in line with the 1.5C warming limit, rather than following current climate policies, could curb long-term sea level rise by 64cm, a new study says.
The research, published in Nature Climate Change, projects how much sea level rise will be unavoidable – or “locked in” – by the year 2300, due to emissions over the coming decades.
According to the authors, 29cm of global average sea level rise is already in the pipeline due to the emissions that were released up to the year 2020.
Following current climate policies until the year 2090 will “lock in” an additional 79cm of sea level rise for the year 2300, the study finds.
However, reducing emissions in line with 1.5C would cut this additional sea level rise to 15cm.
The analysis shows that “if we reduce emissions rapidly in the coming decades, there is a clear path to limiting the legacy of sea level rise”, the lead author of the study tells Carbon Brief.
The study also explores regional sea level rise, showing that Pacific small-island nations will face some of the highest rates of sea level rise.
A scientist not involved in the research tells Carbon Brief that the paper “exposes a deep inequity” between nations, arguing that this makes “ambitious” action to cut greenhouse gas emissions “not just a climate necessity, but a climate-justice imperative”.
‘Locked in’
Average global sea level has risen by more than 20cm since 1900, driven mainly by human-caused climate change through thermal expansion of the ocean and the melting of glaciers and ice sheets.
Rising seas are already threatening to wipe out small-island nations, jeopardising the security, livelihoods and cultures of people who live in these areas. Meanwhile, coastal regions around the world are facing more frequent flooding, erosion and saltwater intrusion.
The authors of the new study explain that emissions released over the coming decades will affect global sea levels for hundreds of years. This is because the oceans and ice sheets respond slowly to past and present warming, they note.
The authors call this “locked in” or “committed” sea level rise.
The study explains that sea level projections are generally based on 21st century emissions pathways, but notes that “late-century emissions then dominate the longer-term sea-level response and mask the impact of near-term emissions”.
In contrast, this study assesses the impact of emissions both early and late in the 21st century – including past emissions and those projected to occur under different emissions pathways. The research investigates how much sea level rise will be locked in by the year 2300 through these emissions.
According to the authors, 29cm of global average sea level rise, compared to 1995-2014, is already locked in due to the emissions that were released up to the year 2020.
Rising seas
The study uses emulators – simple climate models with lower time and computational costs than full-scale Earth system models – to model how much sea level rise will be locked in by 2300 due to 21st century emissions.
The authors chose five emissions pathways and ran multiple model runs where they simulated sudden stops in emissions at the end of each decade for each pathway. This allowed them to isolate the emissions just until these dates.
For example, modelling a sudden drop in emissions in the year 2050 allows the authors to calculate how much sea level rise over the next two centuries is driven solely by human-caused emissions released over the next two decades.
The authors use five emissions pathways:
- SSP1-1.9: A very-low emissions reductions pathway “consistent with” the Paris Agreement’s 1.5C limit
- SSP1-2.6: A “low” emissions pathway consistent with 2C of warming
- SSP2-4.5: A “current climate policy-like trajectory”
- SSP3-7.0: A “high” emissions pathway
- SSP5-8.5: A “very-high emissions” pathway
The left-most panel shows how much additional sea level rise is locked in for the year 2300 due to emissions produced between 2020 and 2030. The next three panels show the results for emissions produced between 2020 and 2050, 2070 and 2090, respectively.
The plot shows that higher levels of greenhouse gas emissions lock in more sea level rise for the year 2300.
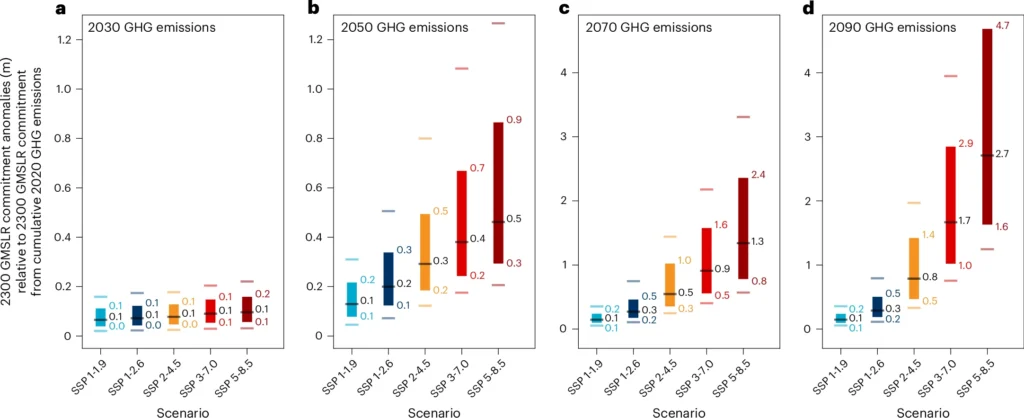
The authors find that, under the SSP2-4.5 “current climate policies” scenario, human-produced greenhouse gas emissions over 2020-50 will lock in an additional 29cm of sea level rise by the year 2300. This number grows to 79cm when including emissions out to 2090 under this scenario.
Meanwhile, under the scenario consistent with the 1.5C limit, only 15cm of additional sea level rise will be locked in by 2090.
This means that efforts to cut greenhouse gas emissions over the coming decades could curb long-term sea level rise by an extra 64cm.
The study authors say that their results “reinforce how every increment of additional peak warming from cumulative emissions irreversibly increases sea level rise”.
Dr Alexander Nauels is a science adviser at Climate Analytics and lead author on the study. He tells Carbon Brief that the world is “already committed to a really substantive amount of sea level rise” and stresses that this must be considered in terms of “adaptation, planning and risk management”.
However, he adds, “if we reduce emissions rapidly in the coming decades, there is a clear path to limiting the legacy of sea level rise that we would produce in the coming decades”.
Dr Catia Domingues, is a researcher at the UK’s National Oceanography Centre and was not involved in the study. She tells Carbon Brief that the study’s methodology is “clever and necessary”. She adds:
“[The study] clearly shows how the emissions from just the next 30 years, under current climate policies, will write an irreversible chapter for centuries to come, locking in significant sea level rise on their own.”
Warming levels
The authors also calculate the committed sea level rise at different warming levels.
The chart below plots sea level rise against warming level for every scenario and time period used in the study. It highlights how higher levels of warming commit the world to ever higher seas.
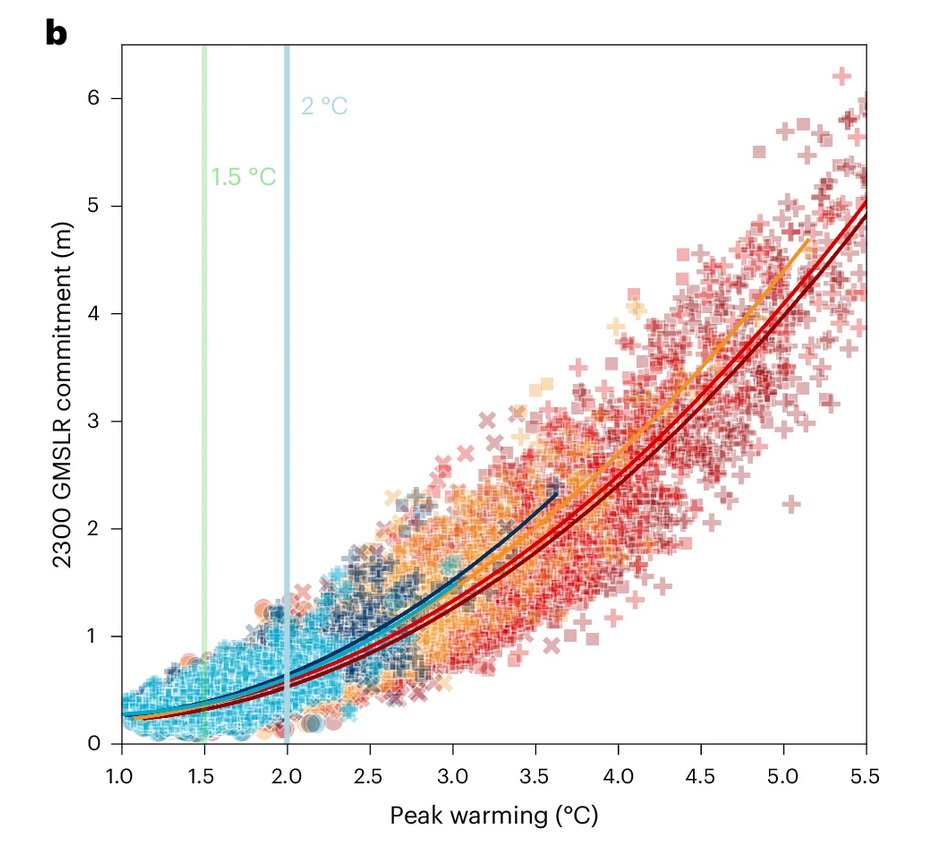
Committed sea level rise by 2300 at different warming levels, under SSP1-1.9 (light blue), SSP1-2.6 (dark blue), SSP2-4.5 (yellow), SSP3-7.0 (red) and SSP5-8.5 (dark red) pathways. Circles, X’s, squares and crosses indicate data points for 2030, 2050, 2070 and 2090 respectively. The green and blue lines show the 1.5C and 2C temperature thresholds. Source: Nauels et al (2025).
The authors note that the relationship between global temperature and committed sea level rise to 2300 is not “linear”, noting that the amount of sea level rise that is locked in by warming accelerates as global temperatures rise.
The authors explain that this is due to a “non-linear increase in ice mass loss in a warmer world” – in other words, physical feedbacks mean that higher levels of warming could see disproportionately large increases in ice losses.
Nauels tells Carbon Brief many sea level processes, such as ice-sheet responses, are still not “fully understood”. This means that when looking out to 2300, there can be “large uncertainties” in results, he adds.
Nevertheless, he argues that it is “still very important to explore the longer-term sea level response, because of the huge risk that is attached to it”.
Inequity
The main findings of the study focus on global average sea level rise. However, the authors note that sea level rise is not consistent across the world, with some regions facing faster rates of sea level rise than others.
This is largely due to ocean currents, driven by wind, warming, evaporation and rainfall, which push large masses of water around the planet. It is also caused by the bumpy, non-uniform surface of the earth.
To show these differences, the authors also selected a handful of coastal regions to study.
Nauels tells Carbon Brief that the study authors decided to focus on a handful of regions that “diverge” from the average global trend.
For example, they find that Pago Pago – the capital of American Samoa, which is made up of a string of coastal villages – will experience greater committed sea level rise than the global average.
On the other hand, Oslo is experiencing “land uplift” and actually shows a drop in sea level under the lowest warming scenario.
The NOC’s Domingues tells Carbon Brief that the study “exposes a deep inequity” between nations. She adds:
“This makes ambitious mitigation not just a climate necessity, but a climate-justice imperative.”
The post Rapid emissions cuts would avoid 64cm of ‘locked in’ sea level rise by 2300 appeared first on Carbon Brief.
Rapid emissions cuts would avoid 64cm of ‘locked in’ sea level rise by 2300
-
Climate Change2 years ago
Spanish-language misinformation on renewable energy spreads online, report shows
-
Climate Change2 months ago
Guest post: Why China is still building new coal – and when it might stop
-
Climate Change Videos2 years ago
The toxic gas flares fuelling Nigeria’s climate change – BBC News
-

 Greenhouse Gases1 year ago
嘉宾来稿:满足中国增长的用电需求 光伏加储能“比新建煤电更实惠”
-
Greenhouse Gases2 months ago
Guest post: Why China is still building new coal – and when it might stop
-

 Climate Change1 year ago
嘉宾来稿:满足中国增长的用电需求 光伏加储能“比新建煤电更实惠”
-

 Carbon Footprint2 years ago
US SEC’s Climate Disclosure Rules Spur Renewed Interest in Carbon Credits
-
Renewable Energy3 months ago
US Grid Strain, Possible Allete Sale


