
Spiking food prices have made headlines around the world this year, from eggs in the US to vegetables in India.
The UN Food and Agriculture Organization’s Food Price Index has been slowly increasing over the past six months following declines over much of 2023.
For example, the price of orange juice concentrate in the US was 42% higher in April than it was a year ago, while the price of fresh orange juice in the UK has risen 25% over the last year.
In Greece, the price of olive oil rose by nearly 30% over 2023 and by more than 63% in April of this year.
No single factor alone can explain the rising prices.
But geopolitical conflict, extreme weather events, high input costs and increased demand are all playing a role.
The FAO’s recent Food Outlook report finds that, despite positive forecasts, “global food production systems remain vulnerable to shocks stemming from extreme weather events, geopolitical tensions, policy changes and developments in other markets”.
Carbon Brief has asked a range of scientists and policy experts from around the world what they think are the biggest factors driving spiking global food prices.
These are their responses, first as sample quotes, then, below, in full:
- Prof Elizabeth Robinson: “Whilst one can argue that food crises are not primarily caused by climate or weather, often food price spikes are due to a combination of weather and non-weather related factors.”
- Levi Sucre: “The overexploitation of agricultural lands and the intensive use of agrochemicals have led to a growing need for fertilisers to maintain production, which further increases production costs.”
- Dr Álvaro Lario: “Most food commodity markets present a stable outlook for 2024-25, which should help contain prices for consumers. However…many factors can tip the delicate demand-supply balance.”
- Siraj Hussain: “For long-term and stable food security, the yield has to go up and food losses have to come down.”
- Prof Andrew Challinor: “Put plainly, climate change is beginning to outpace us because it is interacting with our complex interrelated economic and food systems.”
- Dr Rob Vos: “Food prices in global markets are most sensitive to weather conditions and supply disruptions in major producing countries.”
- Prof Alan Matthews: “The rapid recovery of consumer demand following the disruptions caused by the measures to contain the Covid-19 pandemic, extreme weather events, animal disease outbreaks and tight global markets all contributed.”
- Xiomara Paredes: “In short, every time a new regulation is created, it increases production costs, makes market access difficult and thus makes food products more expensive.”
- Dr Manuel Otero: “Food prices have experienced significant increases due to various interrelated economic, social, environmental and political causes.”
- Dr Shouro Dasgupta: “Conflicts are one of the main reasons behind price shocks…Many of these events have also disrupted supply chains and infrastructure.”
 Prof Elizabeth Robinson
Director, Grantham Research Institute on Climate Change and the Environment.
London School of Economics and Political Science
Back in 2008, broad underinvestment in the agriculture sector, increasing demand for biofuels, changing diets and speculation – encouraged by declining global food stocks – were already putting longer-term upward pressure on food prices.
The 2008 food crisis was triggered by sequential poor wheat harvests in Australia, a breadbasket country. However, the extreme spike in wheat and rice prices was driven by a combination of export restrictions, panic buying and increased speculation, which amplified the short-term harvest shocks and the longer-term pressures.
More recently, the changing climate, the Covid-19 pandemic and Russia’s invasion of Ukraine have disrupted food production and globally integrated food supply chains, putting rapid upwards pressure on food prices. Whilst one can argue that food crises are not primarily caused by climate or weather, often food price spikes are due to a combination of weather and non-weather related factors.
Earlier this year cocoa prices rapidly increased, a consequence of extreme weather conditions, linked in part to El Niño, resulting in multiple poor harvest seasons in west Africa, combined with longer-term pressures, including disease and ageing cocoa trees, and short-term pressures, particularly speculation, exacerbating the situation further.
Given the changing climate, and in particular increasing extremes of heat and precipitation, food price spikes are likely to be an increasingly common feature of our highly integrated global food systems, in which shocks in one part of the world can relatively easily be amplified and transmitted around the globe.
 Levi Sucre
Coordinator
Mesoamerican Alliance of Peoples and Forests
There are several factors causing the increase in food prices worldwide.
Firstly, the high dependency on oil, whose price keeps rising, drives up the costs of food production and transportation. Agricultural machinery, fertilisers and product transportation rely heavily on oil, so any increase in its price directly affects the final cost of food.
Additionally, the overexploitation of agricultural lands and the intensive use of agrochemicals have led to a growing need for fertilisers to maintain production, which further increases production costs.
Monocultures are also degrading the soil, reducing its capacity to produce food sustainably. The lack of crop rotation depletes soil nutrients, diminishing its fertility and forcing farmers to use more fertilisers and pesticides. This not only increases costs but also has negative effects on the environment and health.
The effects of climate change are impacting agricultural production; for example, rising temperatures are disrupting previously predictable agricultural seasons, making crop production more difficult. High temperatures in Mesoamerica continue to destroy crops and reduce food reserves, worsening shortages and driving up prices, affecting nearly 8 million people in El Salvador, Guatemala, Honduras and Nicaragua.
Furthermore, economic injustice, inequality and lack of equity exacerbate the situation. The people with the least resources are the most affected by rising food prices, putting their food security at risk. On the other hand, small-scale producers, who do not use harmful soil practices, do not receive the necessary support to increase their production. These farmers cannot compete with large companies that dominate the market with their monocultures.
 Dr Álvaro Lario
President
International Fund for Agricultural Development
International food prices have declined since their historic peak after the start of the war in Ukraine. According to the recently released biennial FAO Food Outlook, most food commodity markets present a stable outlook for 2024-25, which should help contain prices for consumers. But as the report reminds us, many factors can tip the delicate demand-supply balance, impacting food prices and global food security.
The drop in global food prices does not automatically mean that prices have decreased in real terms in local markets, especially considering the strong depreciation of local currencies in most low- and middle-income countries against a robust US dollar.
This is also true for rural communities in these countries, where 80% of the world’s poorest live. In these areas, people can spend up to 70% of their income on food, leaving them with no capacity to absorb any price hikes and pushing them into poverty and hunger. Since Covid-19 emerged, we have seen multiple crises, such as climate change, conflict and record-high food prices, have compounded to push 122 million more people into hunger.
And, despite the current trend, we must remember how fragile our food systems are. They are increasingly threatened by more frequent and intense weather extremes, and volatile geopolitics. Our food systems are overly concentrated on a few crops, countries and producers, and are inefficient, with significant food losses along the value chain and high levels of food waste at the consumer level.
 Siraj Hussain
India’s former agricultural secretary. Trustee.
World Food Programme Trust for India
Food inflation has been a source of major concern for a vast majority of Indians.
It is quite an enigma that even cereals, in which India is surplus, have seen double-digit inflation in the last year. Despite the erratic monsoon in 2023, India produced 137m tonnes of rice. Yet in every month since April 2023, the consumer price index inflation for rice was 11-13%.
In the case of wheat, inflation was more than 12% from April to July 2023. The Indian government released 10m tonnes of wheat under an open market sales scheme to cool down wheat prices and the intervention was quite successful as inflation has come down to about 3-7% since July 2023.
The reasons behind inflation in basic cereals of wheat and rice are not well understood. Despite low monsoon rains in 2023-24 due to El Niño, the production of both was not too low in 2023-24. As per the Indian government, wheat production was 113m tonnes.
The real concern in the basket of food inflation comes from vegetables, where inflation in the last year has reached more than 25%. This is attributed to losses in the supply chain from harvesting to marketing. India’s food surpluses are quite small except for rice and sugar. For long-term and stable food security, the yield has to go up and food losses have to come down.
 Prof Andy Challinor
Professor of Climate Impacts.
University of Leeds
Every five years, the UK is mandated to report on climate change risks. The scientific evidence for the second of these reports was published in 2017. It highlighted risks from weather-related shocks to international food production and trade as a key risk.
The final report, which is the responsibility of the government, not scientists, endorsed all the conclusions of the evidence report “with the exception of some of those on food security”. The reason? It said: “The government takes a more optimistic view of the levels of resilience that are achieved through functioning markets and diverse sources of supply.”
In the same month that the government response was written, reports of a UK courgette deficit, resulting from climate extremes abroad, soon deepened into wider concerns across a range of vegetables and rationing was commonplace across supermarkets. The World Economic Forum’s 2017 report on global risks identified extreme weather events – already ranked as the most likely global risk in every WEF report since 2014 – as both the most likely and most impactful risk, after weapons of mass destruction.
Skip forward to 2022, when the evidence for the new UK assessment was published. Amongst other additions, an increased underlying vulnerability to climate risk was identified along with a new specific risk of “risk amplification from the interactions and cascades of named risks across systems and geographies”.
The way we as a society (consumers, citizens, government, businesses) choose to set up our food systems has huge implications for stability and resilience – or lack thereof. The 2022 report makes clear that the UK is struggling to keep pace with climate change impacts because of both the pace of change and the way in which the many potential risks to food systems interact with each other.
Put plainly, climate change is beginning to outpace us because it is interacting with our complex interrelated economic and food systems. Until we find ourselves able to look at the big picture and adjust accordingly, we can expect more of the same.
 Dr Rob Vos
Director for Markets, Trade and Institutions.
International Food Policy Research Institute
The war in Ukraine caused world market prices for staple foods, especially wheat and vegetable oils, to skyrocket in the first half of 2022. Since then, however, those world market prices have come down to pre-war levels.
At the same time, consumers around the world have felt soaring domestic food price inflation well into 2023. People in some low- and middle-income countries, such as in Argentina, Egypt, Ethiopia, Gaza, Haiti, Sudan, Ukraine and Venezuela, are still seeing the cost of their daily bread and meals going up at high rates today.
What is driving these price fluctuations in global food markets and why are consumer prices not following the same pattern?
Food prices in global markets are most sensitive to weather conditions and supply disruptions in major producing countries. For instance, floods in India caused by the El Niño phenomenon disrupted rice production in India during 2023, pushing up rice prices worldwide.
The war in Ukraine caused shortages in global wheat, maize, sunflower seeds and fertiliser supplies as both Russia and Ukraine are major producers, pushing up wheat, vegetable oil and fertiliser prices.
I should add that the Ukraine war was not the only factor and, in fact, just exacerbated the surge in international food and fertiliser prices induced by the global economic recovery from the Covid-19 recession and the supply chain disruptions (recall the containership pile-up at harbours) that sent oil prices and shipping costs soaring and increasing the cost of farming and food trade worldwide.
Global market prices are further sensitive to misguided policy responses. Governments often respond to expected food supply shortages and price surges by imposing restrictions on exports (such as India’s bans on rice exports in 2023) or lowering import restrictions (as many rice-importing countries did in 2023). While trying to protect their consumers, these “insulation” measures end up just magnifying the price increase.
Why do domestic food prices not necessarily follow the same pattern?
In fact, most countries are relatively insulated from global price shocks as they rely predominantly on their own food production to feed their populations; typically, only 10-15% or less of food consumption is imported.
Domestic conditions for food production and distribution systems thus matter more than global prices. These conditions vary across countries, but countries with the highest rates of consumer price inflation have seen food systems disrupted by intensified conflict (as in Ethiopia, Gaza, Haiti and Sudan, for instance) and those suffering macroeconomic constraints and weak currencies that have kept both general and food price inflation high (e.g. Argentina, Venezuela, Turkey, and many highly indebted low-income countries).
 Prof Alan Matthews
Professor Emeritus of European Agricultural Policy
University of Dublin Trinity College
Food prices in the EU rose dramatically in 2022 and 2023. EU food prices were 41% higher in May 2023 relative to the price level in 2015, while the overall price level rose by just 26% during this period. The monthly annual rate of food price inflation peaked at 19.2% in the EU in March 2023.
Even higher rates were recorded in central and eastern Europe, with Hungary a particular outlier, with food price inflation of 46% in February 2023. Since then, food prices have not fallen, but are now increasing at a rate below the general inflation rate for the first time in two years.
There have been multiple drivers of this food price inflation. The rapid recovery of consumer demand following the disruptions caused by the measures to contain the Covid-19 pandemic, extreme weather events, animal disease outbreaks and tight global markets all contributed.
For Europe, the impact of the Russian invasion of Ukraine has been particularly important. There was a direct impact through the increased price of energy, and thus fertilisers and fuel, given the EU’s dependence on imports particularly of Russian gas, but also an indirect impact through the knock-on effect of higher world market crop prices due to the subsequent curtailment of Ukrainian exports to the world market.
Extreme weather events have contributed to food price increases. High temperatures and drought badly affected olive oil production in 2022-23 as well as production of cereals in southern Europe, while heavy rains and wet weather have delayed planting and harvests and damaged fruit quality in northern Europe.
Despite these production losses, a March 2024 study in Communications Earth & Environment estimated that the 2022 extreme summer heat had increased food inflation in Europe by 0.43-0.93 percentage points – so making a relatively minor contribution to the overall 19% increase in food prices at that time. Nonetheless, in more normal times that would cause a more noticeable uptick in food prices, and the authors suggest that the warming projected for 2035 could amplify these numbers by 30-50%.
Xiomara Paredes
Executive Director, Latin American and Caribbean Coordinating Association of Small Fair Trade Producers and Workers
The new regulations that the EU has recently implemented, such as the deforestation-free regulation, changes in organic regulation, human rights and environmental due diligence, entail the investment of additional resources, thus raising production costs.
For example, to comply with the deforestation-free regulation, producers must first invest in geolocation equipment and have technical staff who can survey the points or polygons on the plots of each producer member of the organisation. Geolocating all the producers’ plots also takes time and effort that must be diluted in the installed capacity of the producer organisations.
In short, every time a new regulation is created, it increases production costs, makes market access difficult and thus makes food products more expensive.
 Dr Shouro Dasgupta
Environmental Economist
Fondazione CMCC
Visiting Senior Fellow
Grantham Research Institute, LSE
The issue of increasing food prices is multifaceted and is due to a complex set of reasons including conflicts, climate change and supply chain disruptions.
Conflicts are one of the main reasons behind price shocks. For instance, Russia’s invasion of Ukraine, known as the breadbasket of Europe, has substantially reduced exports of wheat, maize and sunflower, resulting in food price fluctuations. While global food prices have decreased from their peak levels at the onset of the conflict, they remain higher than the pre-conflict levels.
Climate change, manifested by increasing temperatures and the increasing intensity and frequency of extreme events such as heatwaves, droughts and floods, has led to crop failures and reduced yields in many parts of the world. This, in turn, has pushed up food prices through supply shocks.
Many of these events have also disrupted supply chains and infrastructure, such as roads, and lowered water levels of major rivers such as the Rhine. Whether due to conflicts or climate change, several countries have imposed export bans on major agricultural commodities (for example, India, Myanmar and Russia on rice; Thailand on sugar; Argentina on beef). These restrictions affect countries that are highly dependent on imports the most.
Several policy failures in the global food system also contribute to food inflation. One such issue is the inadequacy of storage facilities, especially in low- and middle-income countries. Another is the concentration of food production in certain regions and on selected crops (60% of the plant-based calorie intake is provided by rice, wheat and maize) and the fact that global food chains are dominated by a small number of multinational corporations.
Dr Manuel Otero
Director-general, Inter-American Institute for Cooperation on Agriculture
In recent years, food prices have experienced significant increases due to various interrelated economic, social, environmental and political causes. Armed conflicts have disrupted supply chains and food production and distribution, exacerbating shortages and driving up prices. These conflicts have also displaced millions of people, affecting their ability to produce and access food.
Economic shocks, such as the Covid-19 pandemic and its repercussions, plus the slowdown of economies, have reduced consumers’ purchasing power, decreasing incomes and increasing unemployment, which has raised relative demand and prices.
Extreme weather events, such as droughts and storms, have affected agricultural production, reducing supply and increasing production costs, resulting in higher prices for consumers. Volatility in fertiliser markets, driven by trade restrictions and armed conflict, has also increased agricultural production costs, reflected in higher prices for food products.
Trade restrictions, such as export bans, have exacerbated the global food crisis, limiting international food trade and further driving up prices in global markets. According to our Observatory of Public Policies for Agrifood Systems tool, since the pandemic, food inflation has reached 28% annually on a global average – compared to a general inflation of 19% annually.
This is despite the fact that international food prices fell 9% annually for the same comparison period, suggesting that other economic, political and environmental factors contribute to food inflation.
Latin America and the Caribbean is home to 16 net-exporting and 16 net-food-importing countries, so the region has benefited from the increase in international food prices, but has also been one of the most affected by food insecurity due to factors such as increasing poverty.


The post Experts: What is causing food prices to spike around the world? appeared first on Carbon Brief.
Experts: What is causing food prices to spike around the world?
The global goal to halt and reverse nature loss by 2030 “will not be achieved” unless action by countries “accelerates rapidly”, says a draft UN report.
Countries are falling short on 22 of the 23 targets for 2030 they set under the Kunming-Montreal Global Biodiversity Framework (GBF), the “Paris Agreement for nature”.
That is according to a draft version of a global report prepared by the UN Convention on Biological Diversity (CBD), published on 26 July.
The report will be finalised ahead of the next nature summit, COP17, taking place in Armenia in October of this year.
The second draft of the global report has undergone “peer review”, but will still be subject to “technical edits” before being formally published ahead of COP17.
The final version will inform a global review of countries’ progress towards meeting the world’s 2030 nature goals, which will take place in Armenia.
Below, Carbon Brief explains why the report has been produced and what it says about countries’ progress in areas such as restoring ecosystems and raising funds for biodiversity.
Global report
In Montreal, Canada, in 2022, nearly every country in the world agreed to the GBF. The overall “mission” of the framework is to halt and reverse biodiversity loss by 2030. Its “vision” is to bring the world into “harmony with nature” by 2050.
The GBF includes a list of 23 targets for 2030. They cover an expansive range of topics, from restoring ecosystems, to addressing pollution and providing developing nations with finance to help cover the costs of protecting nature.
As part of the GBF and its underlying documents, countries agreed to a schedule for monitoring their progress towards achieving the 2030 targets.
This included the preparation of a “global report” of progress coordinated by the CBD, which will inform a “global review” undertaken by countries at COP17.
The global report draws on countries’ national reports, which were due to be submitted to the UN in February of this year. It also draws on countries’ national nature plans, known as “national biodiversity strategies and action plans” (NBSAPS) and national targets, which were both due in 2024.
Not all countries have met the call to publish these documents and targets. According to the UN, 45% of countries published NBSAPs in time to be considered for the report, 83% had submitted at least one national target and 66% had produced their new national report.
The first draft of the global report was published on 29 June 2026. This draft was subject to a “peer review process”, which invited countries and observers, such as NGOs and businesses, to submit comments on all aspects of the report.
The second draft, which has been revised based on the peer review, was published on Sunday 26 July. (This was just ahead of COP17 preparatory talks being held in Nairobi from 27 July to 1 August.)
A final version of the global report will be formally published ahead of COP17, which will take place from 19-30 October.
Overall findings
The second draft of the global report says that the GBF has led to “unprecedented” interest in tackling biodiversity loss, but adds:
“However, unless collective implementation accelerates rapidly, the 2030 targets and mission will not be achieved.”
It says that countries have taken some action to address all 23 targets, but that “no target presents a fully positive picture”.
(The first draft has slightly softer language. It “concludes that the world is not yet on track to collectively meet the global ambitions that the parties to the convention set when they adopted the framework”.)
The report identifies “two distinct gaps in progress”, relating to ambition and implementation.
First, that the national targets and plans submitted by countries “do not yet fully reflect the scope and level of ambition” of the global targets in the GBF.
Second, countries are not taking sufficient action to achieve their targets, according to the report.
It adds that progress is “particularly lagging” for addressing the “indirect drivers of biodiversity loss”, such as harmful business practices and government subsidies promoting them.
In addition, countries are showing “consistent gaps” in making progress on taking action to protect “marine, coastal and inland water ecosystems”.
The report produces a “scorecard” assessing countries’ progress towards meeting each of the 23 targets of the GBF.
The scorecard includes an “overall score” of between 0 and 1 for each target. This is calculated by considering countries’ self-reported progress in their plans and targets, as well as an assessment of progress based on a set of agreed indicators.
The results are split into four categories: 0-0.25 is red, 0.25-0.5 is orange, 0.5-0.75 is yellow and 0.75-1 is green.
The report gives a “green” score for just one target, indicating overall positive progress. This is target 8, on “minimising” the impact of climate change on biodiversity, including through mitigation and adaptation.
Elsewhere, the draft says that countries have “reported gaps in the scale and timely provision” of “financial resources, capacity-building and development, technical and scientific cooperation, access to and transfer of technology, and knowledge sharing”. It adds:
“These barriers can result in uneven capacities and cause specific technical and financial constraints for all parties, but particularly for developing-country parties. It is likely these constraints are even more pressing for least developed countries and small island developing states.”
Protecting and restoring nature
Target 3 of the GBF is for countries to protect “30% of Earth’s land and sea for nature” by the end of the decade.
This commitment – referred to as “30 by 30” – is widely considered the flagship target of the agreement.
The report says that countries are making “progress in expanding and managing protected areas, especially for marine and coastal areas”. But it adds that “current ambition and implementation remain insufficient to fully achieve all aspects of the target”.
It continues that, according to countries’ available national targets, “monitoring and reporting of some elements of the target remains low”. This includes “those relating to equitable governance of protected areas” and “recognition of Indigenous and local territories”.
The report adds that countries “face significant challenges in implementation, particularly related to lack of finance and capacity”.
(An investigation by Carbon Brief and the Guardian in 2025 revealed that more than half of nations that have submitted UN biodiversity plans do not commit to “30 by 30” within their borders.)
Another conservation measure included in the GBF is target 2, which aims to ensure that at least 30% of land and sea areas are under restoration by 2030.
The report says that “restoration efforts are expanding”. However, it says that “current commitments to restore areas and implementation of those commitments remain below the level required” to achieve target 2.
It adds that countries’ national targets are “generally well aligned with target 2”, but that “addressing the effectiveness of restoration efforts is often absent”.
Moreover, the report adds that monitoring of progress is “constrained by inconsistent definitions and monitoring approaches for ecosystem degradation and restoration”.
Another “major barrier” is a lack of available finance for developing countries looking to restore ecosystems, it says.
Climate and biodiversity links
Target 8 of the GBF is the only one to specifically address climate change, one of the major drivers of biodiversity loss.
It says countries should “minimise the impact of climate change” on biodiversity through mitigation and adaptation, including “nature-based solutions” and “ecosystem-based approaches”.
Target 8 was the only one to achieve a “green” marking in the report’s scorecard of progress (see: Overall findings).
The report says that actions to make biodiversity more resilient against climate change are “progressing”. Yet “implementation remains constrained by data gaps, limited means of implementation and the need for stronger coherence between biodiversity, climate and disaster risk reduction planning”.
It continues that countries’ national targets “generally” show “good alignment” with target 8, across “all elements apart from efforts to minimise the impacts of ocean acidification”.
It adds that the deployment of nature-based solutions and ecosystem restoration is not yet at a “sufficient scale”.
Subsidies
Overall progress is “insufficient” on target 18, which calls on countries to identify subsidies and other incentives that are harmful for biodiversity by 2025, says the GBF report.
It also outlines that nations should “eliminate, phase out or reform” these subsidies in a “proportionate” way, reducing them by at least $500bn per year by 2030.
Countries should first target the “most harmful” incentives, while simultaneously scaling up positive incentives for nature, it adds.
The report finds that countries have made some progress in assessing, compiling inventories and commissioning studies on harmful subsidies.
But issues remain, such as incomplete data and the lack of agreed definitions on which subsidies are deemed “harmful”.
Several national reports also note “entrenched interests and political barriers to subsidy reform”, says the report.
Only one-quarter of countries’ national targets that are “highly aligned” with target 18 are “on track” to be met, it finds. Most show “insufficient progress”.
It notes that 38% of countries have addressed the 2025 aim to identify harmful subsidies in their national targets “to some extent”.
Countries’ national reports do not “provide a sufficient basis to determine” whether this goal was met, says the report, but available evidence “suggests” that it was not.
Recent analysis by Carbon Brief found that just 16% of the 134 national reports submitted so far appear to meet the aim.
The report outlines that half of countries have set national targets addressing plans to eliminate, phase out or reform harmful incentives. Almost 60% mention scaling up positive incentives, it adds.
Just 27%, however, address the issue of reducing subsidies by at least $500bn annually by 2030. Also, only 5% set quantitative national targets to reduce subsidies.
There are two headline “indicators” to measure progress on target 18. The first shows that 30% of countries have outlined information on their nature-positive incentives.
The second indicator shows that 22 countries submitted the value of their biodiversity-harmful subsidies, which amounted to a total of $268bn spent on harmful subsidies over 2022 to 2025 – averaging $67bn each year.
Carbon Brief’s analysis had identified an estimated $270bn each year, based on a wider list of submissions from 32 countries. (More countries submitted national reports since the CBD’s deadline to be included in the global report in February.)
All of these figures remain well below the estimated trillions of US dollars spent annually.
The report notes that different methodologies could lead to global subsidy estimate “inconsistencies”, meaning that reported values are likely “underestimates”.
The amount of positive incentives in place is also likely underestimated, it adds.
The report says that harmful subsidies may have declined by around 20% in recent years, based on figures consistently reported by a minority of countries over 2022-24.
Despite this, the total value of subsidies “remains higher than the resources that parties reported mobilising for biodiversity”. (See: Mobilising finance.)
Mobilising finance
Overall progress on raising biodiversity finance has been “insufficient”, according to the report.
Goal D of the GBF, shown below, states that countries must close a $700bn biodiversity gap by 2030 through ending harmful subsidies ($500bn per year) and mobilising resources from the global north to south ($200bn per year).
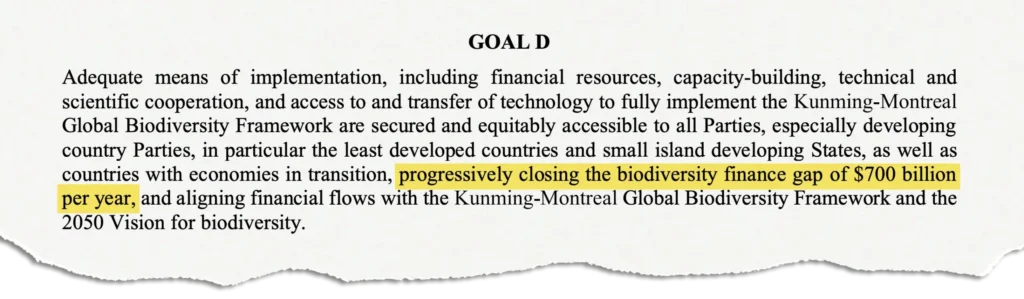
This target aims to raise “at least $200bn per year” by 2030 from “all sources”, including domestic, international, public and private funding.
In all, countries reported raising a cumulative total of $186.4bn over four years, according to the report.
While it adds that it “is still too early to conclude”, the report states that the total finance mobilised so far “falls far short” of what is needed to close the biodiversity finance gap.
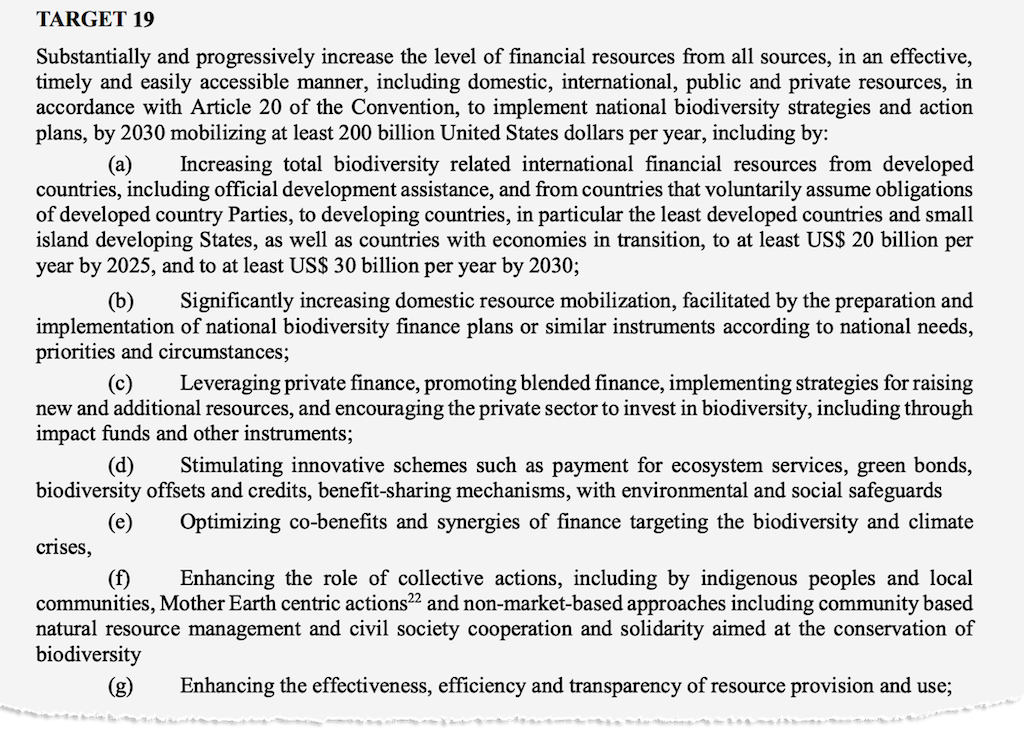
Target 19, shown below, states that developed countries and others should boost finance for nature to “at least $20bn” per year by 2025 and “at least $30bn” by 2030. This falls to developed countries and others that “voluntarily assume” the obligation of contributing.
However, the report suggests that the milestone of raising “at least $20bn per year by 2025” was “likely not achieved”.
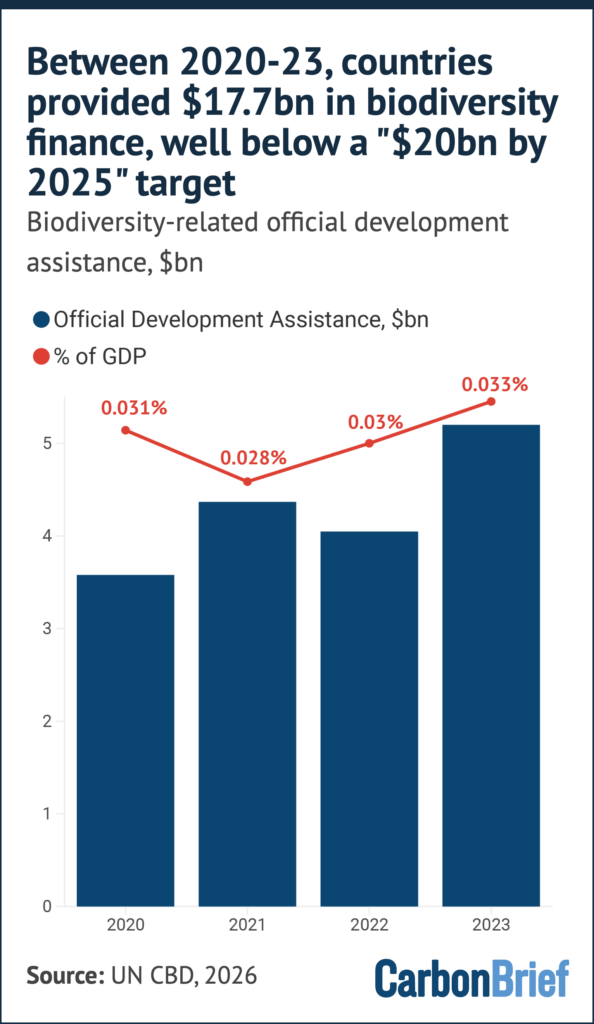
Between 2020 and 2023, reporting countries cumulatively raised just $17.7bn in international public funding for biodiversity, according to the report.
This amounts to an average of $4.4bn per year between 2020-23, with the total touching its highest at $5.2bn in 2023.
The report cautions that this figure “should be read as a minimum”, as it does not account for all potential flows of biodiversity finance.
Both estimates “fall below the $20bn milestone”, although the report adds that a “definitive assessment will only be possible” once data for 2024 and 2025 are included.
An earlier draft of the report included language noting that biodiversity-related “official development assistance” remains “well below the agreed 2025 milestone”. This was cut from the summary in this latest iteration of the report.
References to the OECD reporting a “shortfall in funding” and projecting “a decrease for 2024 and 2025” – suggesting the $20bn target was “unlikely to be met” – were also removed from the latest draft.
The chart below shows how international public funding for biodiversity has varied from 2020 to 2023, according to the report.
By comparison, domestic spending makes the largest cumulative contribution to biodiversity finance, at ($135.9bn) over the four years. However, spending has “declined” as a share of GDP. It also notes that spending varies “greatly”, from 0.1% to 2.7% of GDP.
According to the report, many countries highlighted that national budget allocations for biodiversity are “far too low” and that biodiversity “frequently loses out to competing development priorities”, including “defence, food security and infrastructure”.
At COP15 in Montreal, the EU and several other countries pushed for the inclusion of “all sources” of finance in the final text – including private finance and “innovative” schemes.
Private and “innovative” biodiversity finance – which spans a plethora of sources such biodiversity offsets and debt-for-nature swaps – was eventually included in target 19.
The report, however, notes that private finance “peaked in 2021 and fell afterwards” and “remains particularly undeveloped”, with a cumulative total of $32.7bn between 2020-23.
At the same time, the report notes that only 26% of all countries had reported data on private biodiversity finance, making it harder to assess funding declines in 2022 and 2023.
Genetic resources
The report finds there has been limited progress on sharing genetic biodiversity data.
”Digital sequence information” (DSI) refers to genetic data derived from biodiversity, which is often sourced from species in biodiversity-rich developing countries.
These countries have long called for an international mechanism to ensure that the benefits of DSI are shared fairly with the people living where the resources were “discovered”, including Indigenous communities.
At COP16, countries agreed to the first-ever global fund, called the Cali Fund, for companies profiting from genetic data to contribute to conservation goals on a voluntary basis.
However, experts have cautioned that much rests on whether countries develop strong national laws to support the COP16 agreement. This could include incentivising companies in their regions to contribute to the fund.
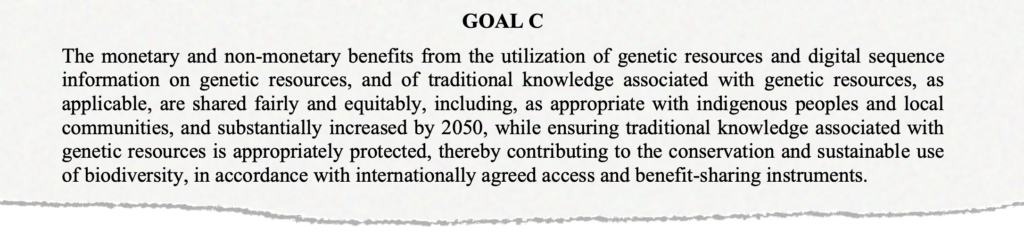
In the GBF, target 13 and goal C address elements of DSI, including the sharing of benefits from genetic resources and their digital derivatives.
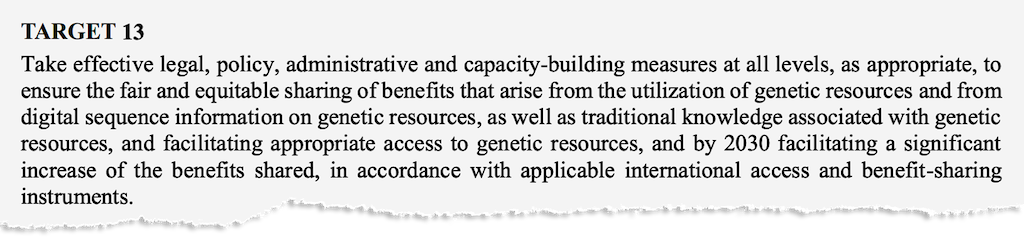
According to the report, 79% of countries submitted national targets that address legal, policy and administrative measures to enable benefit-sharing from DSI. Some 71% included measures to facilitate access to genetic resources.
The report finds that the “strongest progress” has been in developing laws and policies, which are now at an intermediate stage.
The “most fundamental regulatory barrier”, according to many countries cited, is the lack of a “dedicated” national framework to enable access to genetic resources and share benefits with communities.
This would involve enacting laws compatible with the GBF, setting up digital registries to catalogue and trace genetic resources, as well as implementing tracking systems to monitor how they are used. It would also include a financial mechanism to pay communities for the use of their traditional knowledge.
Progress in monitoring monetary and non-monetary benefits from DSI is “much weaker” and is “particularly limited” for measures related to the Cali fund.
According to the report, most parties have “no monitoring systems [for evaluating benefits from genetic resources] in place, or [are] still developing them”. It says they add that the benefits from genetic resources are hard to track “across borders and along value chains through to the final product”.
For those that have tracked benefits, it says that countries reported a cumulative $6.9m in receipts from the use of genetic resources between 2022 and 2025. It adds that “several parties reported that they had received no monetary benefits” to date.
Countries also reported more than 960 non-monetary benefits, ranging from technical training to research participation. The report cautions that these “fluctuated over time rather than increasing consistently, and cannot be seen as indicative of global benefit-sharing”.
In December 2025, Carbon Brief reported that the Cali fund had received only one contribution of $1,000 as an “icebreaker”. No other major companies have stepped up to fill the fund.
Meanwhile, the report states that the formal protection of traditional knowledge held by Indigenous peoples and local communities remained “underdeveloped”.
It says that a “significant number” of countries raised concerns about gaps in recognition of Indigenous peoples’ rights and dedicated registries to document their traditional knowledge.
The report says it is not yet possible to assess progress towards goal C:
“To date it is not possible to comment on whether benefits are being shared fairly and equitably nor on the role played by traditional knowledge and Indigenous peoples and local communities. Therefore, progress towards goal C cannot yet be assessed.”
Pollution
Target 7 of the GBF focuses on tackling pollution from pesticides, chemicals, plastic and other sources.
It calls for countries to reduce pollution risks and negative impacts “from all sources” to “levels that are not harmful” to biodiversity and ecosystems by 2030.
It also aims to reduce excess nutrients in the environment and overall risks from pesticides and hazardous chemicals by “at least half”.
The draft report finds that there is no significant change or insufficient progress on 60% of national targets categorised as being highly aligned with target 7. Only one-third of these national targets (35%) are on track to be achieved by 2030.
On average, it says countries have addressed around half of the various elements of target 7 “to some extent” in their national targets.
The most frequently-mentioned aspect of the target – addressed by 72% of countries – refers to reducing pollution from all sources by 2030.
One headline indicator related to target 7 focuses on the concentration of pesticides in the environment.
Just five countries out of 125 submitted estimates on this, according to the report. It says only one country has met the aim of halving the overall risk from pesticides on a national basis so far.
Measures to address plastic pollution are the most frequently reported actions by countries in relation to this target, including bans on single-use bags and straws.
A number of countries in Europe and Asia have also implemented measures to reduce nutrient losses from fertilisers and slurry.
A “major challenge” for countries in advancing pollution aims is “effectively and fairly considering and managing impacts on food security and livelihoods”, according to the report.
Several countries point to a lack of national funding to implement measures towards achieving this target.
Some developing countries also list poor wastewater-treatment infrastructure as a “persistent challenge” on this issue.
Invasive species
Invasive alien species refers to those that have moved to and become established in a region outside their natural habitat, as a result of human activities. This has negative impacts for local biodiversity and ecosystems.
Target 6 of the GBF calls for countries to, among other things, reduce the rates of introduction and establishment of invasive alien species by 50% by 2030.
The draft report says countries are “taking action” on this target, but progress is “difficult to assess”.
Two-thirds of national targets aligned with target 6 show “no significant progress or insufficient progress”, it finds. Fewer than one-third are on track to be achieved by 2030 and just 1% of these national targets have already been achieved.
But most countries have made progress in putting in place measures to manage invasive species – mostly focusing on reducing the introduction rate and impact of species.
Countries have addressed around half of the different elements of the invasive species target “to some extent” in their national targets, finds the report.
But fewer than one-third (30%) have set national targets that put a numeric goal on reducing invasive species.
Island biosecurity programmes and measures to intercept invasive species at country borders are among the actions countries have put in place to tackle the issue.
The report lists some barriers countries say stand in the way of achieving the target. These include a lack of baseline data from which to measure a 50% reduction rate, poor early-detection systems and a lack of funding for long-term reduction efforts.
Some countries also cite capacity and technical challenges in monitoring invasive species, according to the report.
They say many of these species “go unnoticed for years before impacts become apparent”, it adds, with countries arguing that setting a specific reduction target is “challenging”.
Related

Analysis: 84% of nations miss deadline to identify ‘nature-harming’ subsidies by 2025

UK withdraws millions in funding from world’s second-largest rainforest in Congo
Livestock heat deaths in transit doubled in UK record-hot summer of 2025

Mombasa: Key outcomes from the Our Ocean Conference in Kenya
The post World falling short on 22 of 23 nature targets for 2030, says draft UN report appeared first on Carbon Brief.
World falling short on 22 of 23 nature targets for 2030, says draft UN report
Rising temperatures are redistributing the risk of childhood malaria in sub-Saharan Africa, resulting in areas of “new risk” in the east and south of the continent, but also “relief hotspots” in western Africa.
This is according to a new study, published in Nature, which provides the “most comprehensive look to date at the impact of climate change on any infectious disease”.
The research finds that since the year 1900, climate change has resulted in one extra case of malaria for every 1,000 children in sub-Saharan Africa on average.
Over the 21st century, climate change is expected to drive down malaria rates across the continent on average, as temperatures rise above the optimum range for mosquitoes.
However, the authors emphasise that continent-wide averages hide more detailed local trends.
They find that cooler parts of Africa face an increase in malaria risk, as rising temperatures have made the regions more suitable for malaria-carrying mosquitoes, while warmer regions see a suppression in malaria cases.
The lead author tells Carbon Brief that this is the first study to use “attribution” – a field of climate science which uses models to compare conditions in a world with global warming to one without – to assess the impact of climate change on malaria.
The study also reveals that climate change is not the main driver of shifting malaria risk in Africa, with public health measures and government policy making a more significant impact.
The “most important” message from the study, according to another expert, is that to eliminate malaria entirely, “effective surveillance, prevention and treatment remain substantially more influential – and more actionable – than climate change alone”.
Childhood malaria
Malaria kills hundreds of thousands of people every year. The World Health Organization (WHO) estimates that 610,000 people died due to the disease in 2024.
The disease is transmitted to humans by bites from mosquitoes infected with the malaria parasite. Malaria spreads most rapidly in warm, wet regions, where the parasite-carrying mosquitoes can live and breed.
However, malaria is preventable. A total of 42 countries – mainly in Europe and the Americas – have eliminated the disease entirely through a combination of measures including insecticide use, draining the swamplands that provide breeding habitats for mosquitoes and improving basic healthcare services .Global mortality from malaria declined by 90% over the 20th century.
Today, the vast majority of malaria cases are recorded in Africa, which was home to 95% of malaria cases and deaths in 2024. Children under the age of five make up three-quarters of all African malaria deaths.
The malaria-causing parasite can be detected using a blood test. Over the last century, scientists, government officials and healthcare professionals have collected thousands of blood samples from people across sub-Saharan Africa and tested for the presence of the malaria parasite.
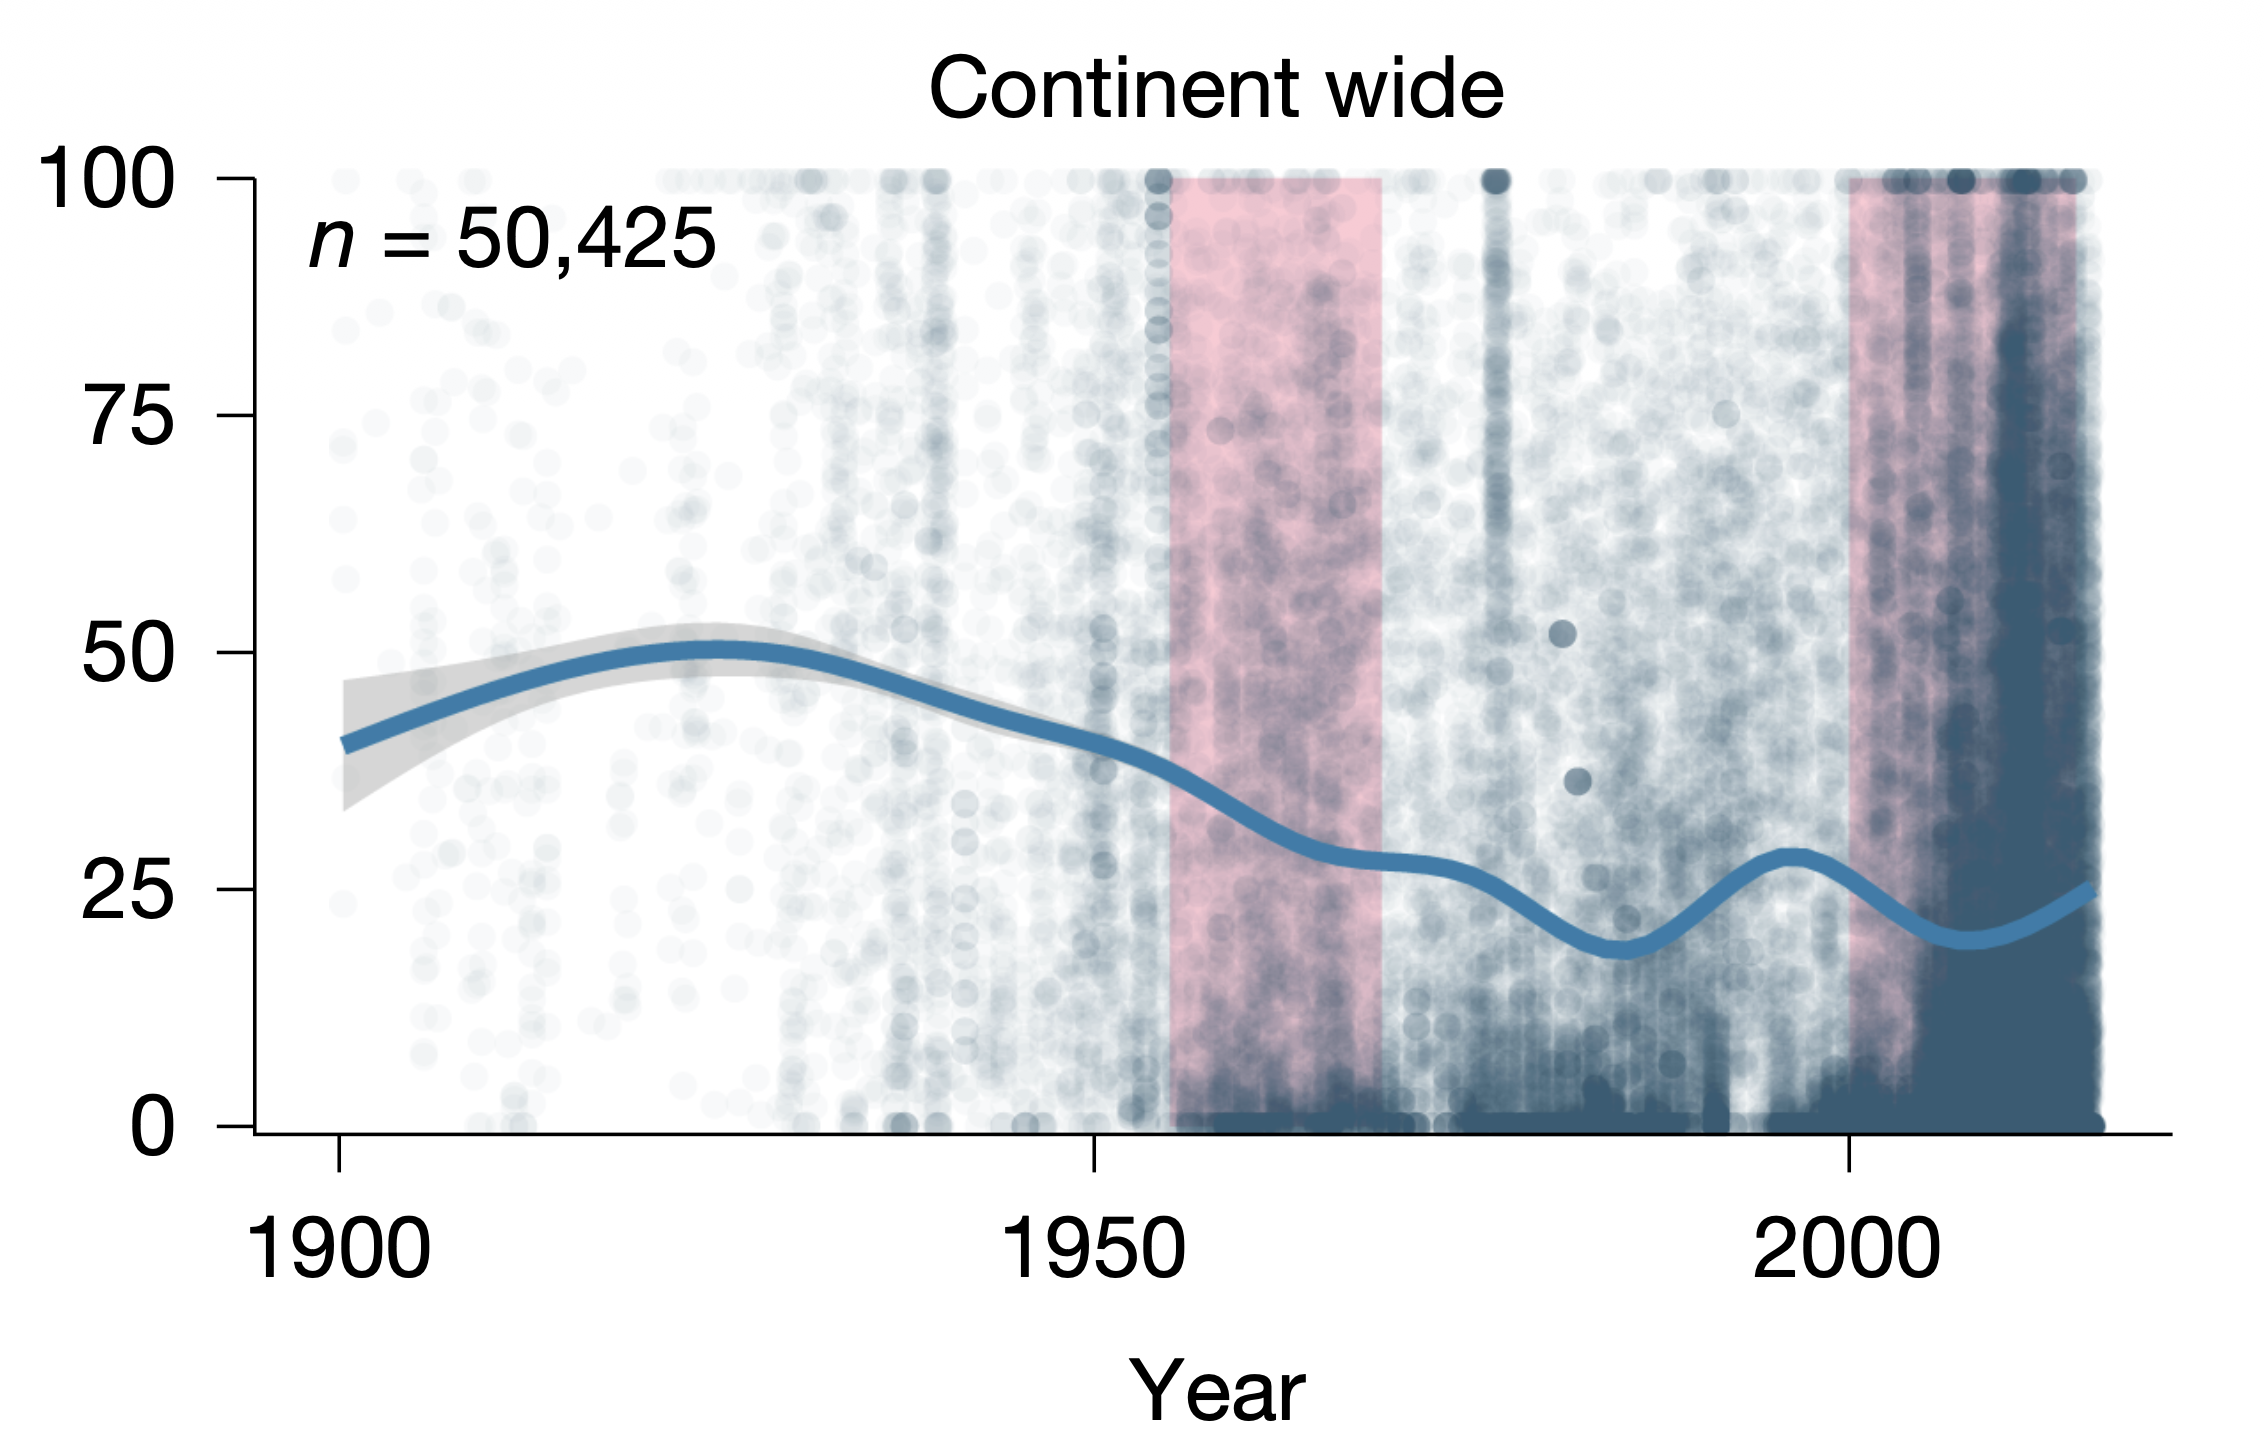
In 2017, scientists brought together more than 50,000 samples collected from sub-Saharan Africa over 1900-2016. This data provides a “snapshot” of the amount of malaria in the population in any year in the last century the study explains.
Dr Colin Carlson is an assistant professor of epidemiology at the Yale school of public health and lead author of the study. He tells Carbon Brief that malaria in Africa is “extraordinarily well documented”, as a result of academic interest and colonial rule in the continent.
The size and quality of the malaria dataset are “exceptionally rare”, Carlson says. He explains that the dataset stretches back to before the impacts of human-caused climate change were strongly felt, making it “extraordinarily” valuable for this analysis.
The chart below shows the percentage of children between two and 10 years old who tested positive for the malaria parasite over 1900-2016. Each dot indicates one blood test result and the pink vertical bars indicate periods of “successful malaria prevention intervention”, such as the 1955-69 global malaria eradication programme.
Attribution
The authors use the blood test survey data to develop a statistical model separating out the climatic, social and economic factors that affect malaria, such as temperature, rainfall, economic development, healthcare and population changes. This allows the authors to isolate the effects of the climate on malaria.
They find that malaria prevalence in children peaks when average monthly temperatures reach 24.9C, dropping off in warmer and cooler climates.
Mosquitoes also need stagnant or slow-moving water in which to lay their eggs. The authors find that periods of drought tend to decrease malaria prevalence one-to-two months later, whereas floods increase prevalence two-to-three months later. However, they conclude that rainfall is “less important than temperature” in predicting malaria rates.
They then combine the statistical models with climate models, to simulate childhood malaria rates in a range of past and future climates.
First, the authors simulate malaria rates in the present day, by running the models using the climate of 2000-14. They then carry out the same analysis, using the climate of a hypothetical world without human-caused climate change.
By comparing the two, the authors were able to attribute the impact of climate change on malaria rates across Africa.
The link between climate change and malaria in Africa is complex and “surprisingly contentious”, according to the authors. For example, they write that “malaria resurgence in the east African highlands became a particular point of contention, with over a dozen studies arguing for or against climate change as a substantial driver”.
It adds:
“Today, malaria experts generally agree that climate change has contributed to elevational shifts in malaria epidemics and the geographical ranges of mosquito vectors. However, the cumulative effect of climate change on the burden of malaria is still an open question.”
Lead author Carlson says this paper is “one of the first impact attributions on infectious disease” and the first attribution study on climate change and malaria. He adds:
“I think it’s the most clarity we’ve had on the malaria question.”
Dr Teresa Yamana, an associate research scientist at Columbia University, who was not involved in the study, praises its “rigorous” methodology. She tells Carbon Brief that the work “demonstrates the potential of climate attribution methods to quantify the impacts of climate change on infectious diseases”.
Warming world
The findings show that “climate change isn’t just making malaria worse or better – it’s moving it, says study author Prof Tamma Carleton, an assistant professor at UC Berkeley:
“Whether a place sees elevated malaria risks or reduced burdens under climate change depends on how hot it is today. We see relief in the hotspots and new risk nearly everywhere else.”
For example, in the Ethiopian highlands, low temperatures – which are unsuitable for mosquitoes to live and breed – have historically limited the spread of malaria. However, the region has seen childhood malaria rates increase by more than eight cases per 1,000 children since the year 1900 as rising temperatures have allowed the insects to expand their habitat.
The authors also found a similar increase in malaria prevalence in cooler southern African countries.
In contrast, global warming is pushing average temperatures above the ideal range for mosquitoes in many hotter parts of Africa, driving down malaria rates. The authors find that in western Africa, climate change has caused a reduction of four malaria cases per 1,000 children per year by 2014, reducing prevalence by 1-2%.
Overall, climate change has resulted in one extra case of malaria for every 1,000 children in sub-Saharan Africa since the year 1900, the study says.
The authors also run their models for three future climate scenarios: low (SSP1-2.6), intermediate (SSP2-4.5) and very-high (SSP5-8.5) emissions pathways. Comparing these to the present-day model results shows how climate change could affect malaria cases over the coming century.
They find that the trends observed so far will largely continue into the future – meaning climate change will lower the prevalence of malaria in warm regions and increase the prevalence in cool regions.
The study concludes that under the intermediate scenario, which is broadly in line with current climate policies, warming will drive down childhood malaria cases by about three cases per 1,000 children in central Africa and 16 cases per 1,000 children in west Africa by the end of the century.
By contrast, cases could increase by around 20% over the same period in regions such as the Rift Valley and coastal southern Africa – a rise of 30 cases per 1,000 children.
The maps below show changes in childhood malaria prevalence due to climate change in today’s climate (left) and the climate of 2096-2100 under the intermediate scenario (right).
Red indicates an increase in malaria prevalence and blue indicates a decrease. Greyer colours indicate greater uncertainty in the model results. White indicates regions where no data was collected.
Carlson tells Carbon Brief that this is “the first study to really confidently answer the highland East Africa debate”.
Eradicating malaria
Healthcare workers, governments and scientists have been working to eliminate malaria for decades.
On average, the authors find that climate change will reduce the prevalence of malaria in sub-Saharan Africa, as temperatures rise above the optimum range for mosquitoes. This effect is more pronounced at higher warming levels.
Under the low emissions scenario, about 1 case per 1,000 children will be averted by the end of the century. Meanwhile under the highest emissions scenario, average prevalence falls by 20 cases per 1,000 children, marking a 9% reduction.
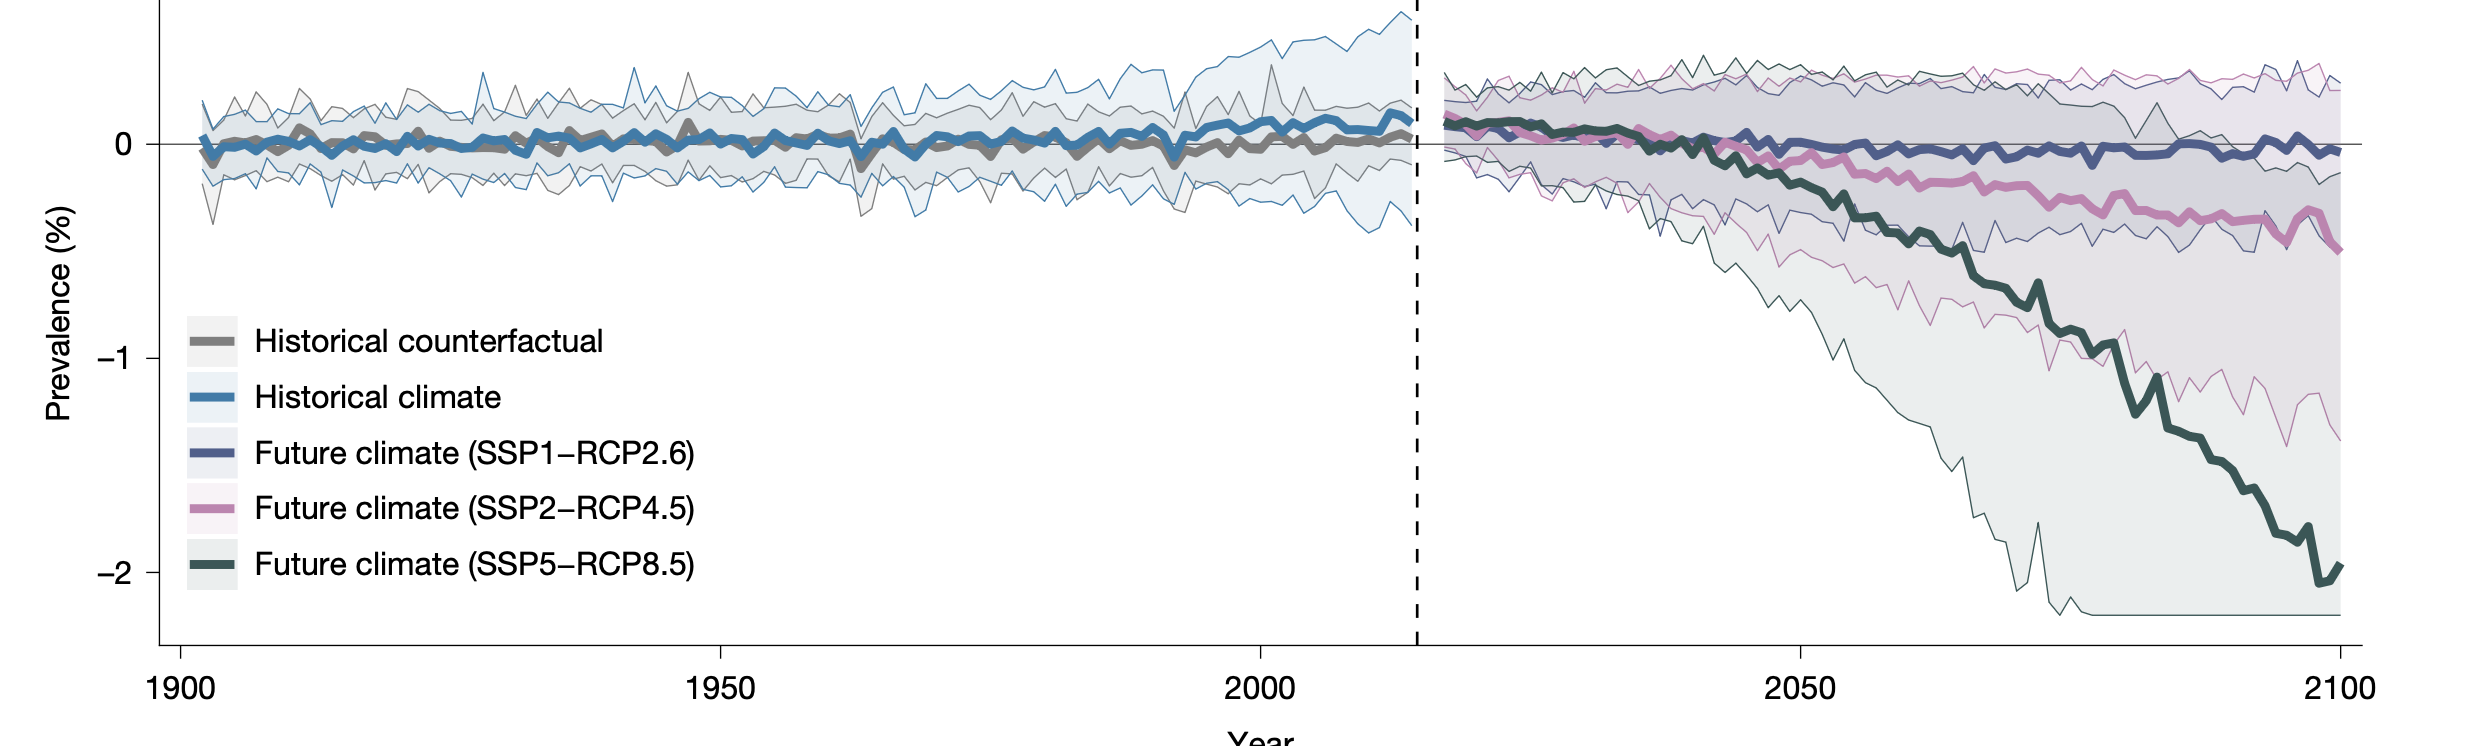
The graph below shows childhood malaria rates over 1990-2024 in the historical climate (blue) and in a world without climate change (grey). These estimates are shown relative to baseline prevalence across 1901-30.
After the year 2014, the plot shows projected future changes in malaria prevalence, relative to a 2015-20 baseline, in the low (purple), intermediate (pink) and high (green) scenarios.
Carlson emphasises that this does not mean that climate change is “good news” for healthcare in sub-Saharan Africa. He explains that climate change will bring a wide range of negative health impacts that will strain healthcare systems, adding:
“A world that is too hot for malaria is not a good world for the health of children.”
He also notes that climate change is “not the primary driving factor of malaria dynamics”. For example, he notes that malaria prevalence fell over 2000-15, by about 16 percentage points, after the disease was identified as a “critical global target of the Millennium Development Goals”.
This reduction is 200 times greater than the increase seen so far because of climate change, Carlson says. He adds:
“It would not be tremendously hard both to keep malaria out of new places and to eliminate it where it is maybe going to get a little bit of an assist from climate change.”
Dr Adugna Woyessa is a senior researcher at the Ethiopian Public Health Institute and was not involved in the study. He has previously carried out research on malaria in eastern Africa.
Woyessa praises the study, telling Carbon Brief that the research could bring about a “paradigm shift” in efforts to eliminate malaria. He argues that the study is a “tool for engaging giant development partners”, adding that “future work will be needed to situate these global trends in local contexts”.
Dr Janey Messina is an associate professor in the school of geography and the environment at the University of Oxford and was also not involved in the study. She praises the paper’s “strong” method.
However, she cautions that the findings “should not be interpreted as forecasts of total future malaria burden”, because they only model the impact of climate change on malaria, while excluding “social, demographic and public-health determinants”, such as inequality, migration, conflict and changing access to malaria interventions.
She adds:
“One of the paper’s most important messages is this: effective surveillance, prevention and treatment remain substantially more influential – and more actionable – than climate change alone.”
Carlson, C. et al. (2026) The past and future impact of climate change on childhood malaria in Africa, Nature, doi:10.1038/s41586-026-10840-w
Related

Q&A: Europe’s May and June heatwave deaths – and how they were counted

Guest post: France’s June heatwave caused more than 2,700 heat-related deaths

Revealed: Floods have forced at least 67 closures at NHS hospitals since 2021

Climate change could lead to 500,000 ‘additional’ malaria deaths in Africa by 2050
The post Climate change is driving a ‘shift’ in childhood malaria risk across Africa appeared first on Carbon Brief.
Climate change is driving a ‘shift’ in childhood malaria risk across Africa
China has released its “15th five-year plan for the development of renewable energy”, outlining key targets and policies for the sector in 2026-2030.
A key focus of the plan is boosting renewable generation and consumption as a share of China’s overall energy mix.
It calls for continued capacity additions of wind and solar – albeit at lower levels than previous years – as well as hydropower, biomass and other clean-energy sources.
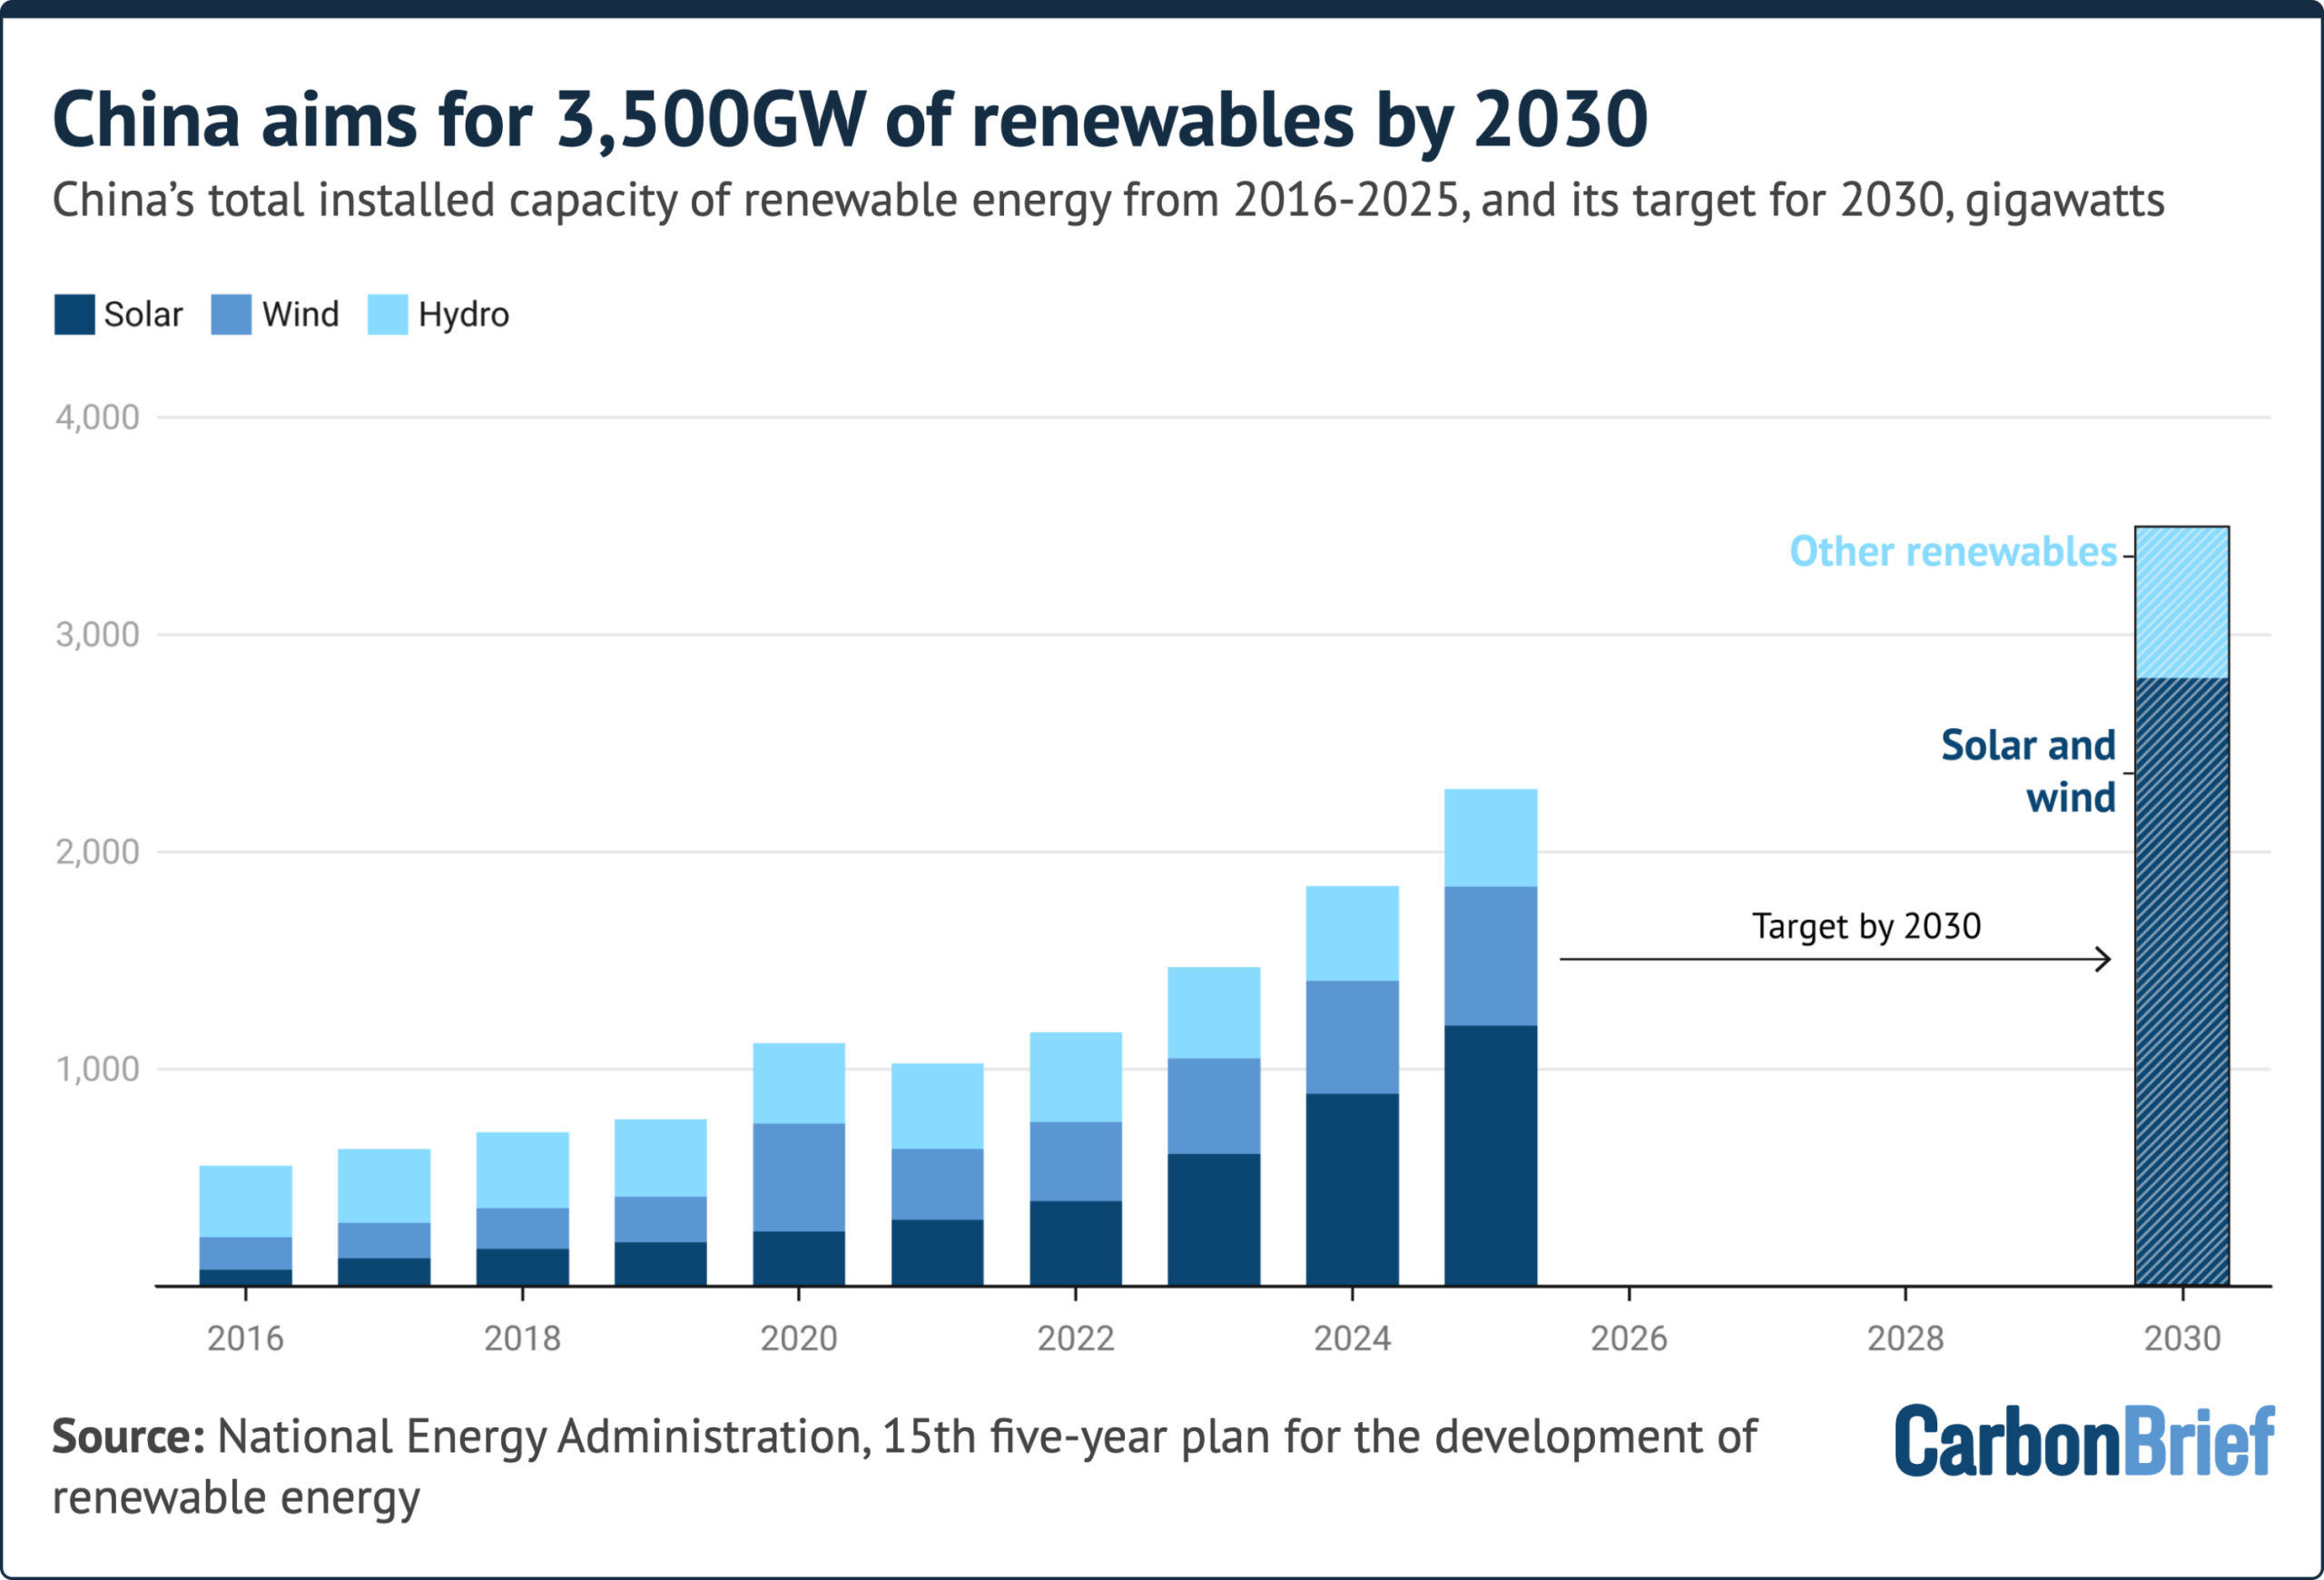
Specifically, China will aim to install 3,500 gigawatts (GW) of renewables capacity by 2030, 2,800GW will be wind and solar.
The country had previously pledged to install 1,200GW of wind and solar by 2030, a goal that China met six years early.
Another major theme is the provision of wind and solar supply that is “dependable” and “grid-friendly”.
Setting a target for “dependable output” from wind and solar could help to entrench their role as a provider of “energy security”, according to analysts.
The government also aims to boost renewables consumption by developing non-power uses of renewable energy, in sectors such as steel and chemicals.
Below, Carbon Brief examines the key targets and policies outlined in the five-year plan and what they mean for China’s energy transition.
- Why are China’s five-year plans important?
- What overarching renewables targets are in the plan?
- Why does the plan focus on ‘firm capacity’ for renewables?
- What does the plan say about ‘distributed’ energy?
- What does the plan say about non-electricity use of renewables?
- What does the plan say about China’s cleantech dominance?
Why are China’s five-year plans important?
Five-year plans are key to China’s political system. An overarching plan, covering all socioeconomic issues of importance to policy leaders, is published at the beginning of each five-year cycle.
The plan for the 15th five-year period (2026-2030) was published in March 2026.
It includes what the government considers to be the most important targets and policy signals for climate and energy. For example, binding targets for carbon intensity, the share of non-fossil energy in total energy consumption and total energy production capacity.
Following this overarching document, five-year plans focused on specific sectors or themes are then published over the course of the five-year plan period.
This year, the government has already published several five-year plans related to energy and climate change. One covers the development of the “new-type” energy sector more broadly. Another wraps climate goals together with other environmental targets under the “Beautiful China” programme.
By contrast, the renewables five-year plan focuses specifically on the development of hydropower, wind, solar, biomass, geothermal and wave energy.
It was published in late July by the National Development and Reform Commission (NDRC), the country’s top economic planning agency, and the National Energy Administration (NEA).
It covers topics including capacity and generation targets, as well as efforts to increase integration and reliability of wind and solar. It also has policies to encourage “non-power use” of renewable energy and ways to strengthen innovation of clean-energy technologies.
What overarching renewables targets are in the plan?
China will aim to install 3,500 gigawatts (GW) of renewables capacity by 2030, according to the five-year plan.
Of this, 2,800GW will be wind and solar – a pledge reiterated from China’s action plan for peaking carbon emissions, which was released earlier this month.
The goal more than doubles a previous 2030 target for wind and solar to reach 1,200GW, which China met six years early.
As of June 2026, the country has installed just under 2,000GW of wind and solar capacity, as well as 454GW of hydropower. Biomass, geothermal and wave energy hold very small shares of the overall energy mix.
As such, China would need to build 160GW of wind and solar each year – and just under 220GW of renewable capacity in total – to meet the targets.
The country installed 277GW of new solar alone in 2024 – and 315GW in 2025.
A key part of meeting the targets will be the development of large-scale clean-energy bases in China’s northern regions. These will generate power to be exported elsewhere via ultra-high voltage lines. The plan also encourages greater “local consumption” and installations of distributed energy (see below).
The plan says that further research will be directed at increasing the renewable share of electricity generated by these large-scale energy bases to 100%.
A recent report by the thinktank Global Energy Monitor (GEM) finds that output from these bases “continues to be paired with coal-fired generation in the name of balancing and system flexibility”. It says that currently, coal generates 42% of the power transmitted to the rest of the country from these bases.
China will also add more hydropower, says the plan, with capacity rising from 448GW in 2025 to 570GW in 2030. Some 160GW of this will be pumped-storage hydropower.
Meanwhile, the plan sets a target for renewable power generation to reach 6,000 terawatt-hours (TWh), 4,000TWh of which would come from wind and solar.
This would be a 50% increase in five years as renewables generated just under 4,000TWh of electricity in 2025, according to the National Energy Administration.
By 2030, the plan says that total consumption of renewable energy will stand at 1.8bn tonnes of coal equivalent (Gtce).
This would be up from 1.2Gtce in 2025, which represented about one-fifth of China’s total energy consumption of 6.2Gtce that year.
The renewable targets in the plan are lower than those suggested in a recent study by high-profile Chinese scholars.
The study, from the department of energy and power engineering and the Institute of Climate Change and Sustainable Development at Tsinghua University in Beijing, assessed the “likelihood of China attaining its carbon peak” under different pathways.
It found that, in order to meet its climate commitments, China would need to either install more than 4,000GW of “non-fossil energy capacity” before 2030, or to “maintain a total energy consumption” below 6.5Gtce.
The table below outlines some of the key renewables targets for 2030, as specified in the plan.
| Key targets for 2030, adapted from 15th five-year plan for renewable energy | |||
| Type | 2025 | 2030 | Percentage change |
| Renewable energy use | 1.2Gtce | 1.8Gtce | 53% |
| Total renewables capacity | 2,340GW | 3,500GW | 50% |
| Wind and solar capacity | 1,840GW | More than 2,800GW | 52% |
| Of which: Solar thermal | 1.8GW | 15GW | 733% |
| Hydro capacity | 450GW | 570GW | 27% |
| Of which: Pumped storage hydropower | 66GW | 160GW | 142% |
| Wave energy | – | 0.4GW | – |
| Renewable generation | 4,000TWh | 6,000TWh | 50% |
| Of which: Wind and solar | 2,300TWh | 4,000TWh | 74% |
| Non-electricity use | 60Mtce | 150Mtce | 150% |
| Renewable hydrogen | 0.25Mt | 2Mt | 700% |
Why does the plan focus on ‘firm capacity’ for renewables?
As well as increasing the overall size of China’s renewable power supply, the country must also maintain an “uninterrupted and reliable power supply”, officials from the NDRC and NEA told state news agency Xinhua in coverage of the new plan.
To support this goal, the plan says that the development of renewables will “enter a new stage”. This will mean that “improving quality and serving as a reliable alternative” to fossil fuels will be as important as “expanding scale”.
The plan, therefore, proposes targets for the “firm capacity” from wind and solar (置信出力). This is the amount plants or grids can be relied on to produce during critical supply periods, in conjunction with on-site storage.
The target for wind is a firm capacity of at least 11% of total installed capacity by 2030, while the equivalent goal for solar is 6%.
Wind and solar will also be expected to supply more than 20% of total demand in peak periods during the summer and winter evenings, says the plan. It expects “reliable peak-shaving capacity from renewable sources” to reach more than 300GW.
The new targets are a “positive move”, says Yao Zhe, global policy advisor at Greenpeace East Asia, as it “only applies during peak load and critical supply periods, when coal power is typically used to stabilise the power supply”.
She adds that this could, theoretically, “prevent the construction of new coal-fired power projects that are proposed and approved for the reason of meeting peak demand”.
The new metrics mark a change in focus, says Lyu Wenbin, director general of the Energy Research Institute – a state thinktank under the NDRC – in an “explanatory reading” posted on BJX News. He says it “marks a shift in renewable energy development from the mere pursuit of installed capacity to…also taking into account system support capabilities”.
The plan pledges to “accelerate the construction of grid-friendly wind and solar power stations”. It says this will enhance “reliable peak-load generation” and strengthen renewables’ ability to ensure “safe and stable operation” of the grid.
It says this will particularly be a focus in the energy-hungry east, central and south areas of China.
It sets out a slightly different focus for areas that already have a high share of renewables in their power mix, such as north-west China. Here, the aim will be to develop wind and solar parks that are “capable of providing voltage, frequency and inertia support”.
“This is a real challenge”, says James Norman, research analyst at GEM. He says these challenges are particularly acute in some circumstances:
“[For example], when the share of wind and solar is very high, relatively few synchronous generators (like coal) are online or large volumes of electricity are being transferred through high voltage DC lines.”
The plan mentions many technological solutions to address the problem, he tells Carbon Brief. However, he adds, there are no quantitative details for the issue. For example, he notes there is no target for “how many gigawatts of wind and solar must gain grid-forming capability”. This is in contrast to the goals for overall renewables capacity or generation.
Norman was a co-author on the recent GEM report, which identified further barriers to renewable uptake. It said these include transmission bottlenecks, alongside systemic features such as dispatching and power-contract mechanisms.
As a result, said the report, renewable power – especially solar – is increasingly being “curtailed”, particularly in north-western and northern provinces.
Yao also notes that the plan does not “spell out specific measures to address systemic constraints” around the electricity grid and the role of coal in the power sector.
“I interpret this as evidence that the vested interests are still strong in the policy debate,” she adds.
What does the plan say about ‘distributed’ energy?
Alongside gigawatt-scale clean-energy megabases, China also aims to expand construction of “distributed” energy. This means smaller-scale installations, such as rooftop solar.
More than 300GW of “distributed new energy” is to be added over 2026-30, some 60GW per year.
The plan aims for distributed new energy to be adopted in sectors such as industry, transport, buildings and agriculture.
Applications include the use of distributed solar and wind in industrial parks, coal mines and oilfields, as well as encouraging residents to install solar panels on buildings and developing rural clean-energy grids.
In some regions, distributed solar and wind is “likely to meet a large proportion of local demand”, says Prof Pan Jiahua at the Hong Kong University of Science and Technology (Guangzhou). He tells Carbon Brief that micro- and mini-grids using such resources will be particularly important in central and coastal China.
The 60GW annual target for new distributed energy is not “overly ambitious”, says Isadora Wang, head of China at the thinktank Transition Asia. She tells Carbon Brief that distributed solar additions, alone, exceeded 100GW in both 2024 and 2025.
Cosimo Ries, analyst at the consultancy Trivium China, agrees that the target is reachable. The biggest question mark, he tells Carbon Brief, is whether it will continue to make sense for industry and utilities to build distributed power at the volumes seen during the 14th five-year plan period.
He adds that market conditions for distributed solar have deteriorated sharply over the past two years. He says a range of factors have hit investor confidence:
“[Distributed solar faces] growing exposure to market trading, worsening returns in spot markets, growing risks of curtailment and new policies limiting or forbidding the selling of power back to the grid.”
What does the plan say about non-electricity use of renewables?
The plan also sets goals for renewable energy’s role in “non-electricity use”.
This means using renewable energy for purposes other than generating electricity, through converting it to other forms, such as heat or mechanical energy.
The government is aiming for non-power use to nearly triple from 60m tonnes of coal equivalent (Mtce) in 2025 to 150Mtce in 2030.
Ries tells Carbon Brief that he thinks this target is “one of the main highlights” of the plan. However, he notes that limited available data means it is hard to assess the level of its ambition. He adds that, given the relative conservatism of China’s other recent clean-energy targets, this one may also be met relatively easily.
Key applications for non-power use of renewables include “green hydrogen, ammonia and methanol”, says the plan. It also points to using wind and solar for heat, as well as to biomass and geothermal for heating and cooling.
Green hydrogen, ammonia and methanol are the “centrepiece” of the non-power push, according to state-owned newspaper Economic Information Daily.
For hydrogen alone, China plans to scale up renewable hydrogen production to 2m tonnes in 2030, up from 250,000 tonnes in 2025.
Today, non-power use of renewables accounts for only around 1% of China’s total energy consumption, NEA and NDRC officials said in a Q&A. They added that there is “considerable room for growth” in sectors such as industry, transport and buildings.
Potential new applications include the use of wind and solar for heat. This could see the use of centralised wind and solar heating stations in the chemicals, textiles, pharmaceuticals, papermaking and food sectors.
New projects in the steel and cement sectors should use locally-generated wind and solar to power electric-arc furnaces and kilns, adds the plan.
Wang tells Carbon Brief that she believes the naming of individual sectors is a “clear indication” that they will be included in China’s renewable consumption quotas. These already cover aluminium and other heavy industry sectors.
She adds that power and heat demand from the named sectors may help absorb distributed renewable energy. It will also serve as a testing ground for matching demand with supply through increased grid flexibility and power price reforms.
To Ries, the growing focus on non-power use signals that China’s decarbonisation efforts are “now entering deeper waters”. That means regulators are turning from easier-to-abate sectors, such as aluminium, to more challenging industries, such as steel.
The plan could create a “second growth curve” for the new-energy industry, says He Zhao, in a commentary for China Power News Net. He, the vice-president of the China Electric Power Planning and Engineering Institute (EPPEI). says this might begin with non-power use, before shifting to fuel, feedstock and heat substitution.
What does the plan say about China’s cleantech dominance?
The next five years is a prime opportunity for China to “consolidate our leading position across the entire industrial chain” for clean-energy technologies, says the plan.
It adds that the government will “strengthen technological innovation” and accelerate the roll-out of new applications of artificial intelligence in China’s renewable-energy system.
A particular focus for new R&D will be “cutting-edge, original and disruptive technologies”. It also points to technologies that “enhance the reliability of renewable energy” as a substitute for fossil fuels.
The plan names technologies for further development. For wind power, these include “reliable and low-cost” blades, ultra-tall towers and new types of floating platforms. It also mentions the development of “high-altitude wind power”. For solar, it points to the development of perovskite and other “high efficiency” solar cells, as well as space-solar technologies.
The plan also pledges to develop a power market that supports the “full entry” of renewable-energy companies. It underscores that companies should plan for an increasingly market-based and competitive environment.
Meanwhile, the government will also deepen cooperation with other countries on clean energy and “advance” global climate cooperation, it says.
A priority will be “strengthening” international coordination on investment and development in “green energy projects”. Another is “actively promoting the free circulation of China’s high-quality green technologies and products in global markets”.
Chinese exports of clean-energy technologies have been surging, especially since the closure of the strait of Hormuz.
At the same time, Chinese investment in clean-energy projects in Belt and Road Initiative member states totalled $20bn in the first half of 2026. This is also driven by the crisis.
The US, EU and others have launched tariffs and pricing mechanisms to curb imports of Chinese cleantech. This has contributed to pushback from China, against what it and others refer to as “unilateral trade measures”.
China is transitioning from a “major energy nation” (能源大国) to an “energy powerhouse” (能源强国), writes the Energy Research Institute’s Lyu in his explanatory reading. He says this will enable China to increasingly shift to building “systemic” advantages in developing clean-energy technologies.
He continues that, from 2026-2030, China will “move to the very forefront of the global stage” on clean energy, “venturing into uncharted territory”. This will create both “major new challenges and significant opportunities” for the country, he adds.


The post Q&A: What does China’s 15th ‘five-year plan’ for renewables mean for climate change? appeared first on Carbon Brief.
Q&A: What does China’s 15th ‘five-year plan’ for renewables mean for climate change?


World falling short on 22 of 23 nature targets for 2030, says draft UN report

Climate change is driving a ‘shift’ in childhood malaria risk across Africa

Q&A: What does China’s 15th ‘five-year plan’ for renewables mean for climate change?
-
Greenhouse Gases12 months ago
Guest post: Why China is still building new coal – and when it might stop
-
Climate Change12 months ago
Guest post: Why China is still building new coal – and when it might stop
-

 Greenhouse Gases2 years ago
嘉宾来稿:满足中国增长的用电需求 光伏加储能“比新建煤电更实惠”
-

 Climate Change2 years ago
嘉宾来稿:满足中国增长的用电需求 光伏加储能“比新建煤电更实惠”
-
Climate Change2 years ago
Bill Discounting Climate Change in Florida’s Energy Policy Awaits DeSantis’ Approval
-

 Renewable Energy9 months ago
Sending Progressive Philanthropist George Soros to Prison?
-

 Carbon Footprint2 years ago
US SEC’s Climate Disclosure Rules Spur Renewed Interest in Carbon Credits
-
Greenhouse Gases1 year ago
嘉宾来稿:探究火山喷发如何影响气候预测