

Cold-blooded sea creatures seeking refuge from warming ocean waters may find themselves at increasing risk of deadly cold shocks due to changes in ocean currents, new research warns.
Climate change is pushing species to higher latitudes in an attempt to stay within their range of comfortable temperatures, but this migration can come with unforeseen consequences.
The new study, published in Nature, documents a mass mortality event in March 2021 that saw at least 260 dead sea creatures wash up on the shores of South Africa.
Using satellite data, ocean observations and data on the movements of bull sharks, the researchers link the event to a sudden influx of cold water coming up from the deeper ocean.
They also show that such events have been increasing in frequency over the past three decades and forecast that this trend may continue into the future as the world continues to warm.
One of the study authors tells Carbon Brief that “we predict this is going to become a more regular phenomenon and could impact a lot of different species”.
Marine migration
As the Earth warms, many species that are able to do so are migrating to higher latitudes, allowing them to maintain their place within their “thermal niche” – the set of temperatures at which they can comfortably survive.
Nowhere is this effect more pronounced than in the global oceans, where there are fewer barriers to migration than there are on land. On average, highly mobile marine species have been moving polewards by nearly 60km per decade since the 1950s, according to the latest report on climate impacts from the Intergovernmental Panel on Climate Change (IPCC).
But this migration comes with its own risks.
These shifting ranges due to climate change can introduce species to new, unfamiliar stressors – such as shipping lanes or fisheries, says Dr Natalie Posdaljian, a bioacoustician at Scripps Institution of Oceanography in La Jolla, California, who was not involved in the study.
One of these risks is what the researchers describe as a temperature “bait and switch” – where creatures seeking warmer waters can instead be trapped by a sudden cold event. Posdaljian tells Carbon Brief that the new study is the first time that she’s seen evidence of this hazard.
Mass mortality
On 2 March 2021, dead sea creatures started washing up on the south-eastern shores of South Africa between Port Elizabeth and East London. In all, more than 250 individual organisms and 82 separate species were found, including large, migratory species such as manta rays and bull sharks.
In deducing what had happened, the team of researchers examined the temperature data in the days leading up to the event. Using satellite and other observational data, they found that the temperature of the surrounding ocean had dropped by up to 9.2C in less than 24 hours.
The cold event persisted for seven days and had “severe physiological consequences” for the marine organisms there, including hypothermia, malfunction and death, the paper says.
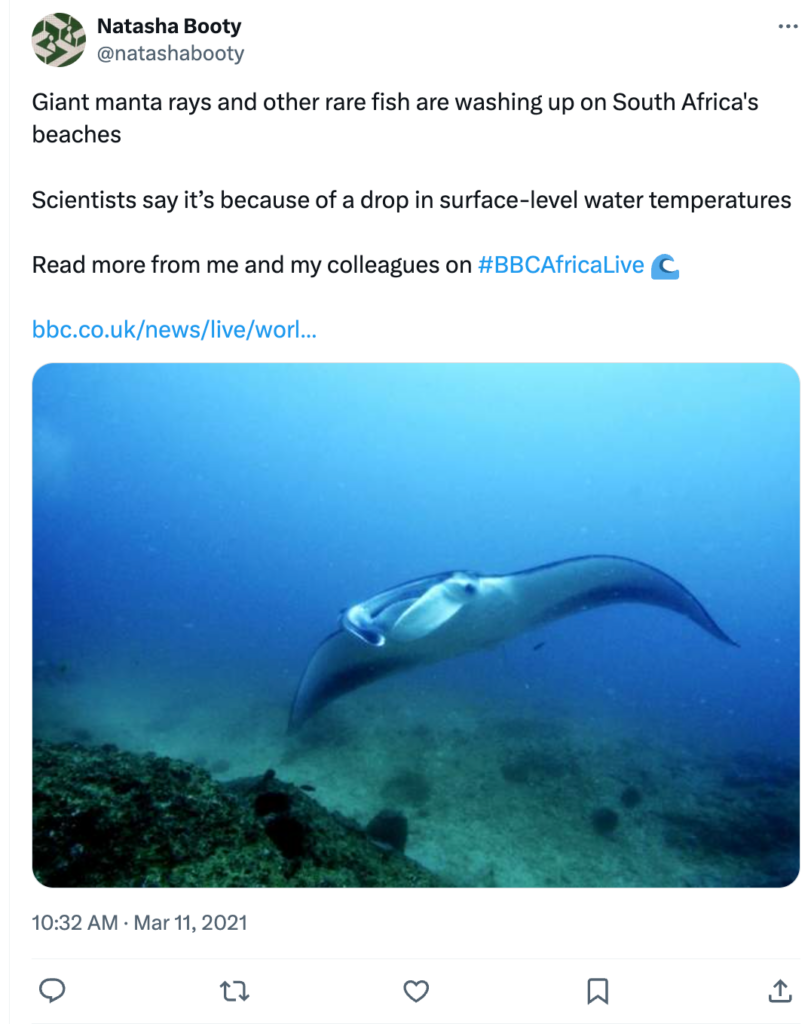
Similar cold shocks have previously occurred in south-eastern South Africa, dating back to at least 1989 and affecting a wide array of creatures, according to the study. But this instance was “probably the biggest cold-water shock [mass mortality event]” ever recorded, Dr Ryan Daly, a marine scientist at the Oceanographic Research Institute in Durban, South Africa, tells Carbon Brief. Daly is one of the authors of the new study.
The influx of cold water was due to a process called “upwelling”, which carries cold, nutrient-rich water from the ocean depths to its surface.
The study identifies three factors that make rapid upwelling events likely to happen: strong currents interacting with the continental shelf, strong winds blowing from the east to the west and meanders in the current. Such winds occur predominantly during the southern hemisphere’s summer, between October and April. They often act as a harbinger of temperature drops occurring in the coming 0-72 hours, the study notes.
All three of these factors are characteristic of both the south-eastern coast of South Africa and the eastern coast of Australia, where strong currents known as the Agulhas and the East Australian Current, respectively, run up against the continental shelf.
‘Trapped’
Dr Camrin Braun, an ocean ecologist at the Woods Hole Oceanographic Institution in Massachusetts, finds it surprising that even large, migratory species such as rays and bull sharks were killed by the cold snap. Braun, who was not involved in the new research, tells Carbon Brief that these animals “can move really far and really fast”.
Daly says that this surprised the research team as well. But it’s possible, he says, that the onset of the cold temperatures was quick enough and large enough that the animals got “trapped” instead of being able to escape.
To underscore this, the researchers use data on bull shark movements and ocean temperatures from tags attached to sharks before, during and after the event.

They find that the sharks consistently demonstrate “attempted avoidance” of lower temperatures – moving closer to the surface while swimming through upwelling areas and only travelling at deeper depths once they reach warmer waters.
The team also observe one shark taking up residence in a sheltered bay during one upwelling event to escape the cold waters. The researchers write that these actions “probably represent behavioural strategies to avoid/survive intense temperature declines”.
On its own, the shark-movement data is “kind of limited” and does not “make a very convincing case”, Braun says. But combining it with other data “really up[s] the ante on the importance” of the research, he adds.
Climate patterns
The researchers also look at several decades’ worth of sea surface temperature and wind data to understand whether these upwelling events are changing in frequency or intensity.
They identify clear increasing trends in the proportion of winds that favour upwelling events across three sites in South Africa. (Previous research has shown a similar increase in such winds in south-eastern Australia.)
Then, for the three South African sites and three Australian sites, they compare temperature data from three locations: “inshore”, defined as between 0-15km from the shore, “midshelf”, which is 15-30km from the shore and “offshore” – located within the warm “core” of the current. The inshore and midshelf locations fall within the upwelling zone, but the offshore ones do not.
If, as they hypothesised, upwelling events were becoming more frequent, the number of cold events inshore would increase over time, while the number of such events offshore would stay the same. Similarly, an upwards trend in the intensity of cold snaps would be revealed in the inshore and midshelf, but not the offshore, data.
The chart below shows that the proportion of upwelling-favourable winds (top left) at three sites in South Africa has been steadily increasing since the “upwelling season” – the period of upwelling-favourable winds stretching from October to April – of 1988-89.
The other three charts show increasing trends in the number of cold events (top right), the average intensity of cold events (bottom left) and the average rate of onset of such cold events (bottom right) for a single site, Port Alfred, over the same period. All three characteristics increase over time for the inshore (blue) and midshelf (pink) locations, but not the offshore (green) one, supporting the idea that the cold snaps are linked to upwelling.

These increases persist over long enough time periods, the authors argue, to be clear evidence of long-term trends, rather than natural variation. Furthermore, the study points to previous research – dating back more than 30 years – that shows evidence of climate change increasing upwelling intensity due in part to increasingly strong winds driven by the land warming faster than the ocean.
This trend analysis is one of the most valuable contributions of the new study, Posdaljian says. She tells Carbon Brief:
“It’s often hard to be able to have that kind of concrete evidence about how something could be increasing in intensity or frequency over time.”
The idea that climate change could lead to an increase in cold snaps may seem counterintuitive. But those increased temperatures “mean more energy in the climate [system] too”, Daly says. He explains:
“This wind-driven upwelling, linked to climate change, is essentially an extreme event – just like we might have more flooding and stronger cyclones and hurricanes.
“If you think about equivalent on land, that might be fires being fuelled by more intense wind. It takes an existing natural phenomenon and basically supercharges that to become [more] intense.”
He adds:
“Going forward, we predict that this is going to become a more regular phenomenon and could impact a lot of different species.”
The researchers “did a really good job of creating this foundational understanding” of how such cold events could hit marine ecosystems in future, Posdaljian says.
Looking ahead, she adds that she would like to see more work focusing on projecting future trends in cold snaps and perhaps even being able to predict them. She tells Carbon Brief:
“A lot of these animals are not just dealing with one stressor from climate change…We can’t necessarily mitigate these [extreme events], but what we can do is maybe reduce the other stressors that we can control.”


The post Climate change ‘bait and switch’ threatens sharks and rays appeared first on Carbon Brief.

An Lambrechts is a biodiversity politics expert at Greenpeace International with extensive experience in biodiversity-related multilateral negotiations. She is the head of the Greenpeace delegation at the Convention on Biological Diversity (CBD) COP17 happening in Yerevan, Armenia.
In 2022, COP15 delivered the landmark Kunming-Montreal Global Biodiversity Framework to halt and reverse biodiversity loss by 2030. With COP17 starting in Yerevan, we are now halfway to the deadline, and according to the first Global Review of progress, countries are not on track to meet the biodiversity targets, and implementation must accelerate fast.
One of the main findings of the Global Review is that funding falls far short of the scale needed to halt and reverse nature loss. But the crisis facing the world’s biodiversity is not an absolute scarcity of capital – it is a profound public policy distortion.
The global economy currently spends roughly $30 destroying nature for every single dollar invested in its protection. According to a report from the Intergovernmental Science-Policy Platform on Biodiversity and Ecosystem Services, a staggering $2.4 trillion is spent in public subsidies for fossil fuels, agriculture and water use, while global investment in biodiversity conservation and restoration stands at a mere $220 billion.
Countries urged to ramp up “insufficient” nature policies at COP17
Yet, discussions about how to close the biodiversity finance gap continue to claim that salvation lies in mobilising private capital, scaling offsets and “derisking” investments in nature. This is a fundamental misunderstanding of both the nature of ecological stewardship and of the global financial architecture.
Biodiversity conservation is not a speculative investment portfolio – it is the foundation of human survival. The health of our planet is a non-monetisable, non-excludable public good. Expecting profit-seeking private capital to protect nature perpetuates the structural drivers of ecosystem destruction in the first place.
But if private market mechanisms cannot save biodiversity, where will the necessary public resources come from?
Money going to the wrong places
The answer lies in recovering the vast public wealth currently drained by cross-border tax abuse, financial secrecy and corporate impunity. Finance and environment ministers meeting in Yerevan must give a strong political signal that, to avert ecological breakdown, countries need to take swift action to reform global tax rules, eliminate harmful public subsidies and cancel unsustainable sovereign debts for the public revenues to end up where they belong.
Extractive sectors such as industrial agriculture, fishing, timber and mining continue business-as-usual, often heavily subsidised by public treasuries, while voluntary carbon and biodiversity offset markets pose a serious risk to nature conservation. Offset schemes have delivered only a negligible fraction of the funding needed to preserve ecosystems, allowing industries to continue with their destructive business-as-usual practices.
-
Global deforestation slowed in 2025 but Brazil’s election could undo “fragile” gains
Countries remain 70% off track to meet a goal to end deforestation by 2030, as progress in Latin America offset by failures in Africa -
Brazil confident new rainforest fund will reach $10bn donor milestone
Brazil’s environment minister said the Tropical Forest Forever Facility has raised billions in record time – which he hopes will convince more investors


In advanced economies, public funding often actively undermines biodiversity. In Europe, over €5.3 billion in public subsidies is funnelled annually into intensive forest biomass harvesting under renewable energy directives, degrading primary forest ecosystems and undermining long-term climate resilience. Pleading with private investors to fill a “finance gap” while pouring billions into ecological destruction is an exercise in futility.
Developing countries struggle with debt burden
For developing countries, reliance on private finance is further compounded by a crushing sovereign debt crisis. In 2024, public debt in developing economies reached record levels, with net interest payments alone absorbing $921 billion. A record 61 developing countries now spend more than 10% of government revenue on foreign debt service, with many climate-vulnerable nations spending twice as much servicing external debt as they receive in climate and biodiversity finance combined.
This burden acts as a structural driver of ecosystem destruction. Under pressure from external creditors and international financial institutions to avoid default and secure foreign exchange, governments are routinely forced into austerity measures and pushed to expand raw commodity exports into pristine biomes.
Comment: World Bank and IMF should lead the financial system in responding to the climate crisis
The current negotiations for a United Nations Framework Convention on International Tax Cooperation (UNFCITC) also offer a way forward. An estimated $492 billion in tax revenue is lost every year to offshore tax havens. Multinational corporations account for around $348 billion of this total by shifting profits away from the countries where real economic extraction and environmental degradation occur.
In the mining sector alone, developing nations lose tens of billions annually to corporate tax dodging. Furthermore, international financial secrecy shields environmental criminals, with illicit financial flows from illegal logging draining between $51 billion and $152 billion annually.
At COP17, leaders must seize the opportunity to build a bridge between the two conventions and enhance cooperation. Governments must put the world on a firm path to securing predictable, sufficient, sovereign public finance for biodiversity conservation. It’s the only path to a restorative, rights-based future for people and the planet.
The post Protecting nature is a public duty, not a Wall Street profit opportunity appeared first on Climate Home News.
Protecting nature is a public duty, not a Wall Street profit opportunity
Climate Change
Greenpeace delivers 47 metre-long petition with half a million signatures to Woodside HQ following major gas protest
Greenpeace delivers 47 metre-long petition with half a million signatures to Woodside HQ following major gas protest
PERTH, Monday 19 October 2026 — Dozens of Perth community members delivered a giant petition, signed by almost half a million people, to Woodside’s corporate headquarters this morning, calling on the government to save Scott Reef from Woodside’s reckless Browse gas proposal.
Dressed in sea creature costumes and hats, supporters carried one of Australia’s biggest environmental petitions to Woodside’s headquarters, and a local choir performed a ‘Scott Reef’ rendition of Angie McMahon’s iconic cover of ‘Reckless’ by Australian Crawl.
On the sidelines of the Perth Global Citizen Now event, it comes following a two day-long protest at Woodside’s Scarborough gas platform that saw activists scale and occupy the Floating Production Unit calling to “Stop Woodside’s Dirty Gas” and “Save Scott Reef”. The activists were taken from the platform by police helicopter on Sunday afternoon.
David Ritter, CEO at Greenpeace Australia Pacific, said: “Less than a day after two Greenpeace Australia Pacific activists were arrested for their peaceful protest at Woodside’s Scarborough gas platform to save Scott Reef, we are here again with another message to Woodside: half a million of us do not want your dirty gas at Scott Reef.
“Community pressure on Woodside is rising. Today we are here to show Woodside that they can’t ignore half a million people who want Scott Reef protected, not turned into an industrialised gas zone.
“Woodside can’t be trusted with our oceans. Woodside’s plans to drill up to 57 toxic wells at Scott Reef, Australia’s largest oceanic reef, putting endangered pygmy blue whales at risk, and jeopardising a nesting ground for unique green sea turtles.
“We Australians love our oceans and this is an opportunity for our governments to do the right thing, to reject Woodside’s reckless drilling plans, and save Scott Reef.”
-ENDS-
Media contact
Kate O’Callaghan on +61 406 231 892 or Emma Sangalli on +61 431 513 465
Climate Change
Greenpeace Australia Pacific activists in police custody after two-day protest against Woodside’s Browse gas project at Scott Reef
PERTH, Sunday 18 October 2026 — Two Greenpeace Australia Pacific activists are in police custody after occupying a gas platform at Woodside’s Scarborough gas project, in peaceful protest of the fossil fuel corporation’s plans to drill for oil and gas at Scott Reef.
NEW footage and photos of the peaceful protest available here and on Instagram
The activists used specialised climbing equipment to scale and attach themselves to a Floating Production Unit (FPU), a key piece of gas processing infrastructure at the Scarborough gas field over 200km off the coast of Exmouth, at around 05:45am AWST on Saturday and proceeded to occupy the platform for two days, displaying banners reading “Stop Woodside’s Dirty Gas. Save Scott Reef.”
Special police forces landed a helicopter on the FPU at around 11:30am AWST. The activists safely removed themselves from their equipment before being taken into police custody around 1:00pm AWST. At the time of writing, no charges have been laid.
David Ritter, CEO at Greenpeace Australia Pacific, said: “It takes guts and conviction to do what our activists have done, peacefully protesting Woodside’s reckless gas plans at Scott Reef.
“Woodside’s plans to drill up to 57 toxic wells at Scott Reef are outrageous. If allowed to go ahead Woodside would turn Scott Reef, Australia’s largest oceanic reef, home to nesting green sea turtles and elusive pygmy blue whales, into an industrial gas zone. Around half a million people have called on our governments to stop Woodside and to save Scott Reef.
“Our activists are highly trained and experienced in these activities. West Australia has a proud history of peaceful, democratic protest at sea, to protect our oceans from environmental threats. From whaling in Albany in the seventies, to Woodside’s threat to Scott Reef today, there’s more than fifty years of history, of Greenpeace taking action off WA’s coast to protect the places we love.
“Peaceful protest has long been part of what has given us so many of the things that are great about Australia and is part of the fabric of our democracy and our national identity.”
“The right to peaceful protest is fundamental to a healthy democracy. From Australia to the Arctic and the Amazon, Greenpeace has been peacefully protesting for more than 50 years to expose the biggest environmental threats around the world. We will not be silenced by corporations like Woodside who actively try to stop everyday people from speaking out against their reckless plans.
“Woodside’s reckless proposal to drill at Scott Reef is an unacceptable risk to Scott Reef and to the climate, which our government should emphatically reject.”
Speaking from the Rainbow Warrior, Captain of the Rainbow Warrior Hettie Geenen, said:
“It felt powerful watching from the Rainbow Warrior as these brave activists scaled Woodside’s enormous and imposing gas infrastructure, which has no place at Scott Reef. We are all out here because we feel an urge to act, in the face of Woodside’s grave threat to Scott Reef and to our climate. Now we ask for the Australian government to act too, and reject Woodside’s reckless Browse project.
“Just before this peaceful protest, the Rainbow Warrior sailed to Scott Reef, where our whole crew got to witness the magic of an untouched, healthy reef ecosystem full of marine life. It was my second time visiting Scott Reef with the Rainbow Warrior. When you see Scott Reef up close and witness its magic first hand, it is impossible not to feel driven to try and protect it.”
The activists sailed to Scarborough on the Rainbow Warrior, Greenpeace’s flagship vessel, which is in the region campaigning to protect Australia’s oceans, including Scott Reef.
-ENDS-
Media contact
Greenpeace Australia Pacific media team in Perth on +61 406 231 892 or +61 407 581 404 or email media.au@greenpeace.org