Carbon dioxide (CO2) emissions from fossil fuels and cement will rise around 1.1% in 2025, reaching a record 38.1bn tonnes of CO2 (GtCO2), according to the latest figures from the Global Carbon Project.
However, falling land-use emissions means that global CO2 emissions in 2025 will remain relatively unchanged compared to 2024 levels.
The 20th edition of the annual Global Carbon Budget report, published today, also finds that the land carbon sink – the portion of human-caused CO2 emissions absorbed by plants and soils – appears to have recovered to its pre-El Niño strength after two unusually weak years.
However, research published alongside the report by the same team also suggests that climate change has caused a long-term decline in land and ocean carbon sinks, with sinks being about 15% weaker over the past decade than they would have been without climate impacts.
The study, published in Nature, finds that the decline of carbon sinks has contributed about 8% to the rise in atmospheric CO2 concentration since 1960.
The 2025 Global Carbon Budget report also estimates that:
- Emissions in China and India are projected to grow much less in 2025 compared to the past decade, while emissions in the US and EU are projected to grow this year after years of decline.
- Global CO2 emissions from land-use change are expected to decrease by nearly 10% in 2025, driven by reductions in deforestation and forest degradation in South America.
- Total CO2 emissions – fossil and land use – have grown more slowly over the past decade (0.3% per year on average) compared to the previous decade (1.9% per year).
- The remaining carbon budget to limit global warming to 1.5C is virtually exhausted and is equivalent to only four years of current emissions. Carbon budgets to limit warming to 1.7C and 2C would similarly be used up in 12 and 25 years, respectively.
- The concentration of CO2 in the atmosphere is set to reach 425.7 parts per million (ppm) in 2025, 2.3ppm above 2023 and 52% above pre-industrial levels.
(For detailed coverage of previous editions of the report, see Carbon Brief’s coverage for 2024, 2023 and 2022.)
Global emissions remain flat
The Global Carbon Budget (GCB) finds that total global CO2 emissions in 2025 – including those from fossil fuels and land use – are projected to remain approximately flat at 42.2GtCO2, falling by a negligible -0.04% compared to last year.
This means 2025 is effectively tied with 2024 as the highest global CO2 emissions on record.
Flat total CO2 emissions in 2025 reflect a combination of continued rising emissions from fossil fuel and industry and declining emissions from land-use change. Fossil CO2 emissions rose 1.1% to 38.1GtCO2, while land-use emissions declined by -9.8% to 4.1GtCO2 (albeit with large uncertainties).
The figure below shows the 2025 global CO2 emissions update (red solid line) alongside 2024 (dark blue dotted), 2023 (mid blue dotted) 2022 (light blue dotted), 2021 (light grey dotted) and 2020 (dark grey dotted). The shaded area indicates the uncertainty around the new 2025 budget.
(Each year, the GCB is updated to include the latest data as well as improvements to modelling sources and sinks, resulting in some year-to-year revisions to the historical record.)

The 2025 figures are notably higher than those in the prior five GCB reports, reflecting an upward revision in historical land-use emissions. (This is discussed in more detail in the land-use emissions section below.)
Total global CO2 emissions have notably flattened in the past decade (2014-25), growing at only 0.3% per year compared to the 1.9% rate of growth during the prior decade (2004-13) and the longer-term average growth rate of 1.6% over 1959-2014.
This apparent flattening is due to declining land-use emissions compensating for continued – but slow – increases in fossil CO2 emissions. Fossil emissions grew around 0.2GtCO2 per year over the past decade, while land-use emissions decreased by a comparable amount.
However, despite the emissions plateau, there is still no sign of the rapid and deep decrease in CO2 emissions needed to reach net-zero and stabilise global temperatures in-line with the Paris Agreement temperature goal.
If global emissions remain at current levels, the remaining carbon budget to limit warming to 1.5C (with a 50% chance) will be rapidly exhausted.
(The carbon budget is the total amount of CO2 that scientists estimate can be emitted if warming is to be kept below a particular temperature threshold. Earlier this year, the Indicators of Global Climate Change report estimated the remaining carbon budget had declined by three-quarters between the start of 2020 and the start of 2025.)
With human-caused global warming sitting at around 1.36C above pre-industrial levels in 2024, the remaining budget for 1.5C is 170GtCO2, equivalent to four years of current emissions.
The GCB report finds that the remaining carbon budgets to limit warming to 1.7C and 2C have been reduced to 525GtCO2 (12 years at current emissions levels) and 1,055GtCO2 (25 years), respectively.
Global fossil CO2 emissions also grew more slowly in the past decade (0.8% per year) compared to the previous decade (2.1%). This was driven by the continued decarbonisation of energy systems – including a shift from burning coal to gas and replacing fossil fuels with renewables – as well as slightly weaker global economic growth during the past decade.
The figure below breaks down global emissions (dark blue line) in the 2025 budget into fossil (mid blue) and land-use (light blue) components. Fossil CO2 emissions represent the bulk of total global emissions in recent years, accounting for approximately 90% of emissions in 2025 (compared to 10% for land use). This represents a large change from the first half of the 20th century, when land-use emissions were approximately the same as fossil emissions.
Global fossil emissions include CO2 emitted from burning coal, oil and gas, as well as the production of cement. However, to determine total fossil emissions, the Global Carbon Budget also subtracts the cement carbonation sink – CO2 slowly absorbed by cement once it is exposed to the air – from fossil emissions.

Global emissions can also be expressed on a per-capita basis, as shown in the figure below.
While it is ultimately total global emissions that matter for the Earth’s climate – and a global per-capita figure glosses over a lot of variation among, and within, countries – it is noteworthy that global per-capita fossil emissions peaked in 2012 and have been slightly declining in the years since.

Land-use emissions continue downward trend
Global land-use emissions stem from deforestation, forest degradation, loss of peatlands and harvesting trees for wood. They averaged around 5.0GtCO2 over the past decade (2015-24) and the Global Carbon Budget provides an initial projection for 2025 of 4.1GtCO2.
This represents a 0.5GtCO2 decrease in land-use emissions relative to 2024. The GCB report suggests that this was largely driven by a combination of reductions in deforestation and forest degradation in South America and by the end of the dry 2023-24 El Niño conditions.
Overall, land-use emissions have decreased by around 32% compared to their average in the 2000s, with a particularly large drop in the past decade. This decline is statistically significant and is due both to decreasing deforestation and increasing levels of reforestation and afforestation globally.
Three countries – Brazil, Indonesia and the Democratic Republic of the Congo (DRC) – collectively contribute approximately 57% of the global land-use emissions. In the past, China has been a meaningful contributor to land-use emissions, but in recent years its land-use emissions have turned net-negative as more trees have been planted than cut down.
The figure below shows changes in emissions over time in these countries, as well as land-use emissions in the rest of the world (grey).

Historical land-use emissions have been revised upward in the 2025 GCB report compared to prior estimates. This reflects a combination of two factors:
- The discontinuation of one of the four bookkeeping models that GCB has historically relied on for land-use emissions estimates. This model tended to show lower land-use emissions than the others.
- The inclusion of the impacts from CO2 fertilisation on global biomass densities. Because forests have higher biomass densities now than in the past, due to increasing CO2, this tends to increase the estimate of land-use emissions for recent years.
Fossil-fuel CO2 hits record highs
Global emissions of fossil CO2 – including coal, oil, gas and cement – increased by around 1.1% in 2025, relative to 2024, with an uncertainty range of 0.2-2.2%. This represents a new record high and surpasses the prior record set in 2024.
The figure below shows global CO2 emissions from fossil fuels, divided into emissions from major emitting countries including China (dark blue shading), the US (mid blue), the EU (light blue), India (light blue) and the remainder of the world (grey).

China represents 32% of global CO2 emissions today. Its 2025 emissions are projected to increase by a relatively small 0.4% (with an uncertainty range of -0.9% to 2%), driven by a small rise in emissions from coal (0.3%), a modest rise in gas (1.3%) and a larger rise in oil (2.1%).
Given the uncertainty range, a decrease in Chinese emissions is also a possibility, but this will not be confirmed until the full 2025 data is available.
Similarly, recent analysis for Carbon Brief found that China’s emissions were “finely balanced between a small fall or rise” in 2025. However, it said that a drop in the full-year total became more likely after a 3% decline in September. (The Global Carbon Project estimates are based on data covering January through to August, which point towards a small rise in 2025.)
Whether China’s emissions see small rise or fall in 2025, the outcome will be due to moderate growth in energy consumption combined with an extraordinary growth in renewable power generation. This would represent the second year in a row where Chinese emissions growth was well below the average rate over the past decade.
The US represents 13% of global emissions and emissions in 2025 are projected to increase by 1.9% (-0.2 to +4.1%) compared with 2024. This marks a reversal from recent trends in declining CO2 emissions.
The projected growth of emissions in the US is likely driven by a combination of three factors: a colder start to the year after a mild 2024, which led to greater heating requirements, higher gas prices, which led to more coal being used in power generation, as well as an increase in total demand for electricity.
US emissions from coal are expected to increase by a substantial 7.5% in 2025, emissions from both oil and gas by a more modest 1.1% and emissions from cement to fall by -8.0%.
While policies enacted by the current US administration may increase CO2 emissions going forward, their impact on national emissions levels in 2025 were likely relatively modest compared to other factors.
India represents 8% of global emissions. In 2025, its emissions are projected to increase by 1.4% (-0.3% to +3.1%) on 2024 levels, significantly below recent trends.
An early monsoon with the highest-ever May rainfall substantially reduced cooling requirements in May and June, the hottest months of the year. Strong growth or renewables – particularly solar – has also helped limit the growth of Indian emissions.
Indian emissions from coal are expected to grow 1.7%, with oil growing 0.1%, gas shrinking by -6.4% and cement growing by 9.9%.
The EU represents 6% of global emissions. Its emissions are projected to increase by 0.4% in 2025, with an uncertainty range of -2.1 to +2.8%. This represents a divergence from a past decline in emissions (albeit with large uncertainties).
EU emissions from coal are expected to decline by -0.3%, whereas emissions from oil and gas are projected to increase by 0.6% and 0.9%, respectively. Cement emissions are expected to fall by -4.1%.
The increase in EU emissions is in part from weather-related low hydropower and wind generation which – despite increases in solar – have led to an increase in electricity generation from gas. In addition, a relatively cold February led to increased use of natural gas for space heating.
International aviation and shipping (included in the “rest of world” in the chart above) are responsible for 3% of global emissions. They are projected to increase by 6.8% for aviation, but remain flat for international shipping. This year will be the first time that aviation emissions have exceeded pre-Covid levels.
The rest of the world (excluding aviation) represents 38% of global emissions. Emissions are expected to grow by 1.1% in 2025 (ranging from -1.1% to +3.3%), with increases in emissions from coal (1%), oil (0.5%), gas (1.8%) and cement (2.4%).
The total emissions for each year over 2022-25, as well as the countries and regions that were responsible for the changes in absolute emissions, are shown in the figure below.
Annual emissions for 2022, 2023, 2024 and estimates for 2025 are shown by the black bars. The smaller bars show the change in emissions between each set of years, broken down by country or region – the US (dark blue), EU (mid blue), China (light blue), India (pale blue) and the rest of the world (grey). Negative values show reductions in emissions, while positive values reflect emission increases.

The US represented a large part of the rise in global fossil-fuel emissions in 2025. US emissions increases over 2024-25 contributed about 40% of the total global increase – more than the EU, China and India contributions combined.
The Global Carbon Project notes that emissions have declined over the past decade (2015-24) in 35 nations, which collectively account for 27% of global emissions. This is up from 18 countries during the prior decade (2005-14).
The decrease in emissions in those countries comes despite continued domestic economic growth and represents a long-term “decoupling” of CO2 emissions and the economy.
The carbon intensity of energy has consistently decreased over the past decade in China, the US, the EU – and, to a lesser extent, globally.
However, peaking CO2 emissions requires that the rate of decarbonisation exceeds the growth in energy demand. This has happened in some regions, including the US and EU, but not yet globally.
Modest growth in emissions from coal, oil, gas and cement
Global fossil-fuel emissions primarily result from the combustion of coal, oil and gas.
In 2025, coal is responsible for more emissions than any other fossil fuel, representing approximately 42% of global fossil-fuel CO2 emissions. Oil is the second largest contributor at 33% of fossil CO2, while gas comes in at 21%.
The production of cement is responsible for around 3.8% of global emissions, but this is reduced to 1.9% once the carbonation sink – the drawdown of atmospheric CO2 by concrete – is taken into account.
These percentages reflect both the amount of each fossil fuel consumed globally, but also differences in CO2 intensities. Coal results in the most CO2 emitted per unit of heat or energy produced, followed by oil and gas.
The figure below shows global CO2 emissions from different fuels over time, covering coal (dark blue), oil (mid blue) and gas (light blue), as well as cement production (pale blue) and other sources (grey).
While coal emissions increased rapidly in the mid-2000s, they have largely flattened since 2013. However, coal use increased significantly in 2021 and then more modestly in the subsequent four years.

Global emissions from coal increased by 0.8% in 2025 compared to 2024, while oil emissions increased 1.0% and gas emissions increased by 1.3%.
Despite setting a new record this year, global coal use is only 6% above 2013 levels – a full 13 years ago. By contrast, during the 2000s, global coal use grew at a rate of around 4% every single year.
The figure below shows the total emissions for each year over 2022-25 (black bars), as well as the absolute change in emissions for each fuel between years.

Global oil emissions were suppressed for a few years after the 2020, but rebounded to pre-pandemic levels as of 2024 and have continued to grow in 2025.
This reflects that, despite falling sales of internal combustion engine vehicles, not enough electric vehicles (EVs) have yet been sold to result in peak oil demand.
The global carbon budget
Every year, the Global Carbon Project provides an estimate of the overall “global carbon budget”. This is based on estimates of the release of CO2 through human activity and its uptake by the oceans and land, with the remainder adding to atmospheric concentrations of the gas.
(This differs from the commonly used term “remaining carbon budget”, which refers to the amount of CO2 that can be released while keeping warming below global limits of 1.5 or 2C.)
The most recent budget, including estimated values for 2025, is shown in the figure below.
Values above zero represent sources of CO2 – from fossil fuels and industry (dark blue shading) and land use (mid blue) – while values below zero represent carbon sinks that remove CO2 from the atmosphere. Any CO2 emissions that are not absorbed by the oceans (light grey) or land vegetation (mid grey) accumulate in the atmosphere (dark grey). In addition, a dashed black line is shown to represent the expected sum of sinks based on estimated emissions.
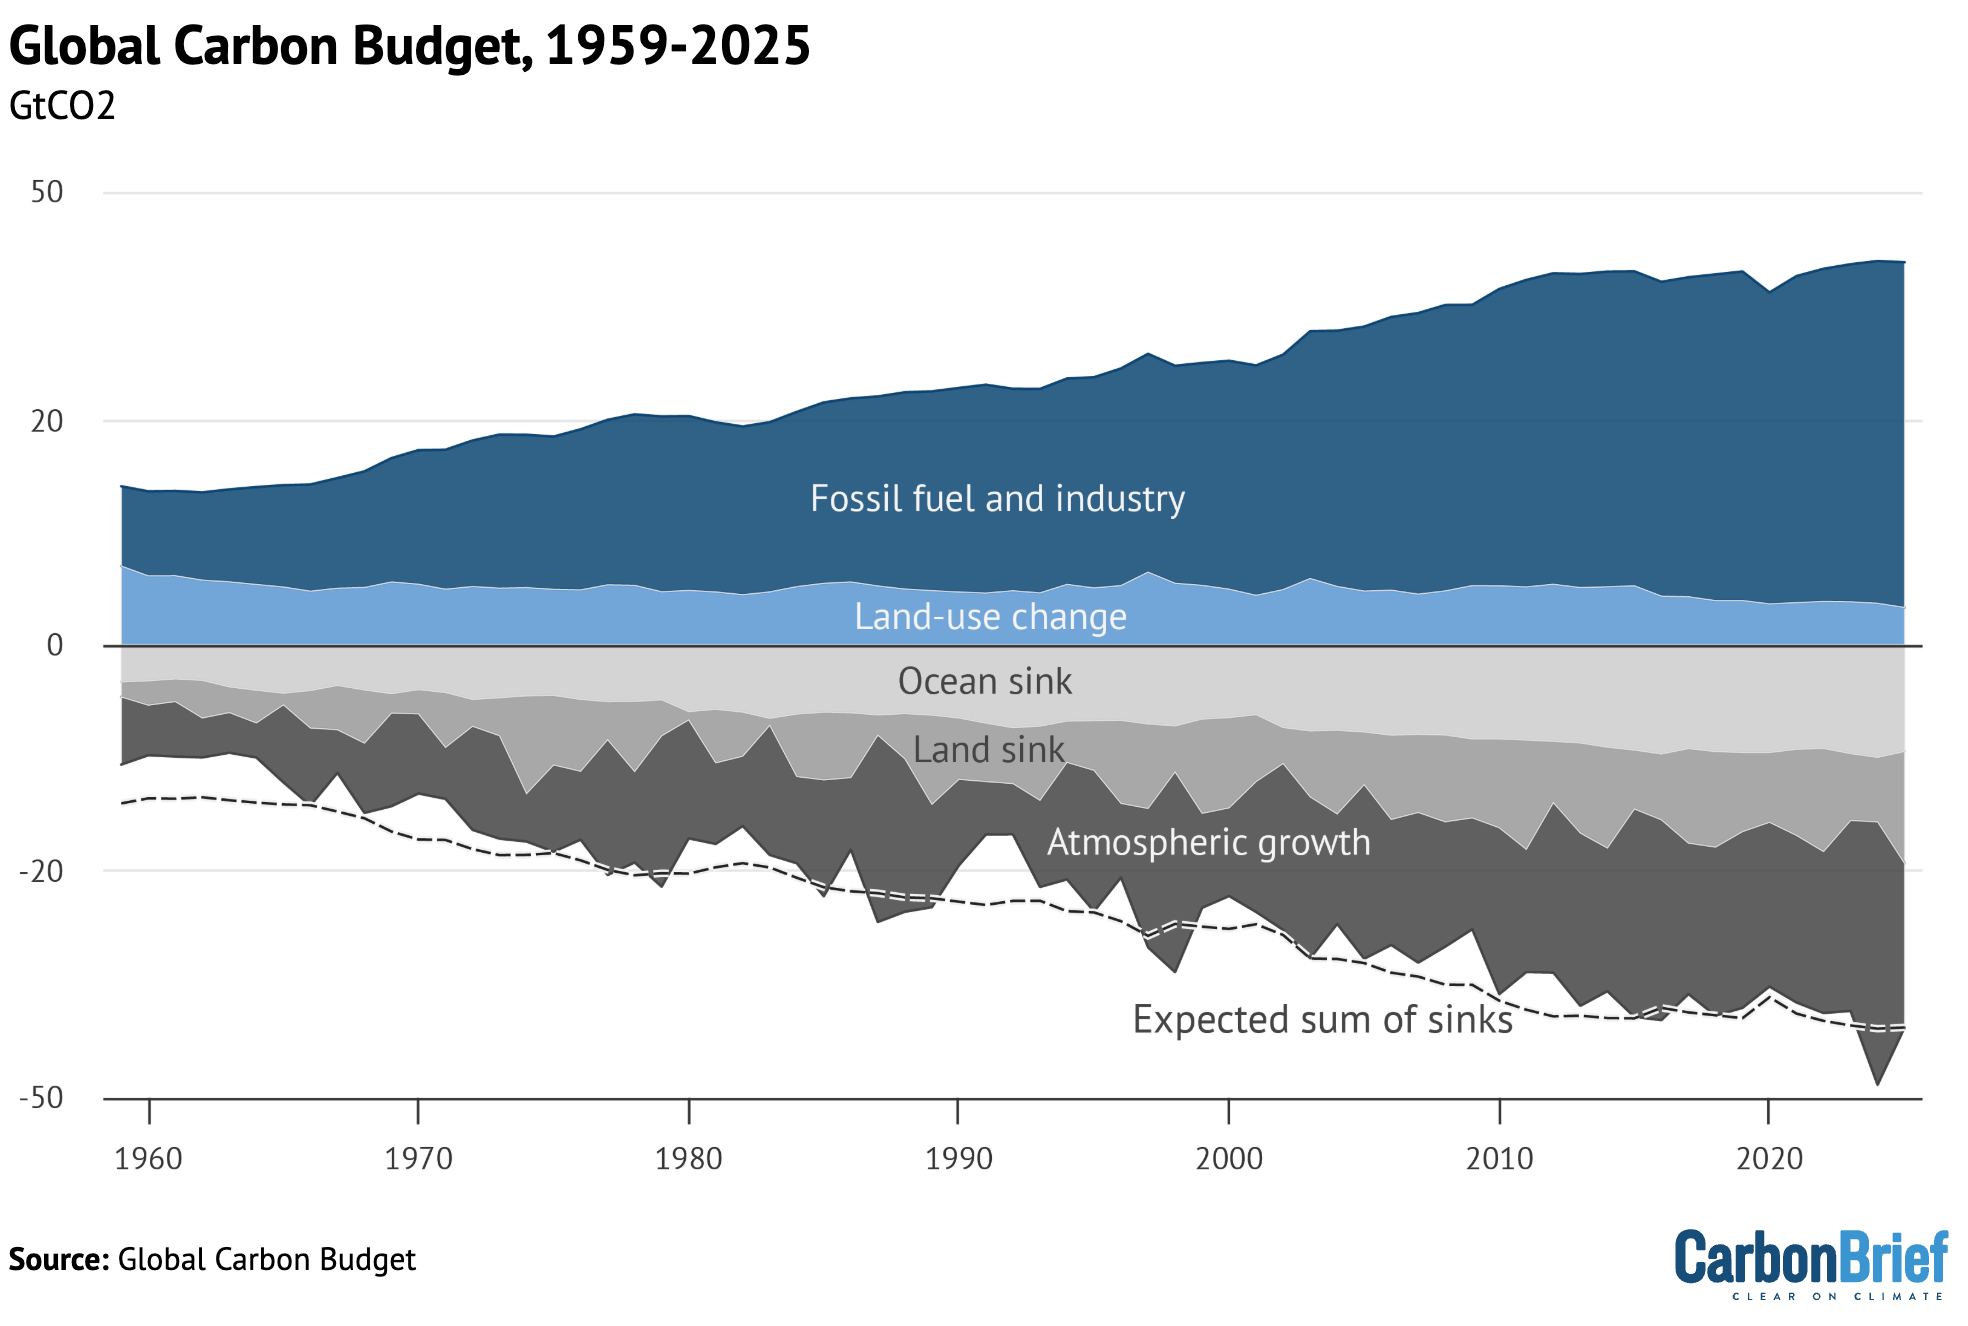
Over the past decade (2015-24), the world’s oceans have taken up approximately 29% of total human-caused emissions, or around 11.8GtCO2 per year.
The ocean CO2 sink has been relatively flat since 2014 after growing rapidly over the prior decades, reflecting the flattening of global emissions during that period.
This estimate for carbon sinks has been revised up from 26% in prior versions of the GCB, reflecting a major update to carbon budgets driven by new data and modelling of carbon sink behavior.
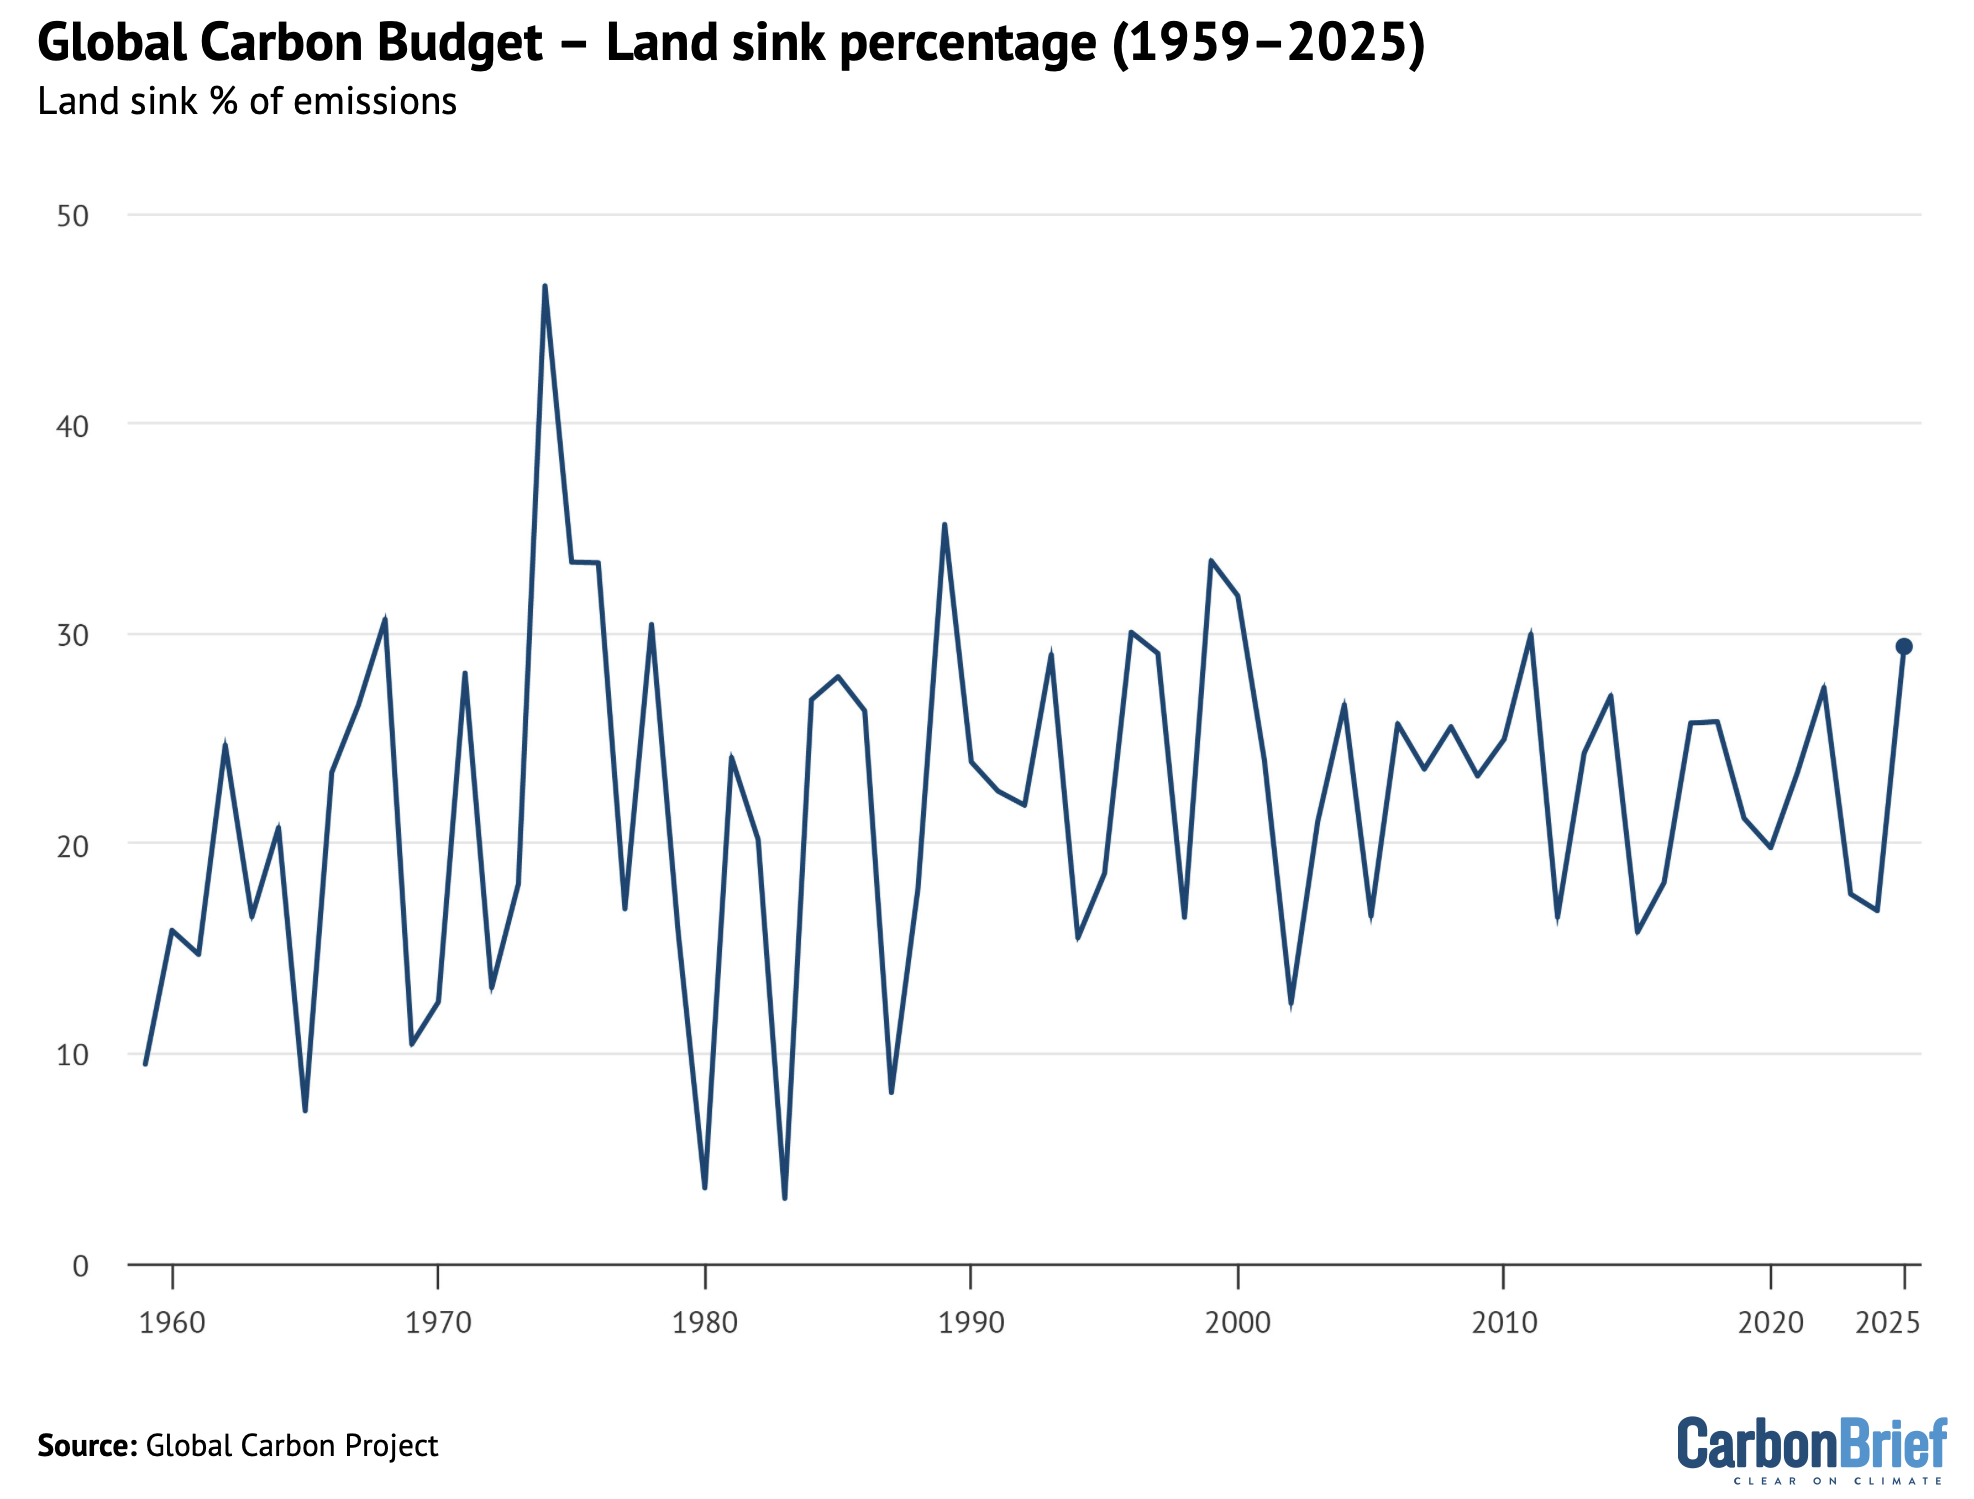
The land sink takes up around 21% of global emissions, or 8.7GtCO2 per year on average over the past decade – discussed in more detail in the section below. This is down from 29% in prior budgets.
The atmosphere continues to accumulate the bulk of human-caused CO2 emissions, with about 49% going into the atmosphere on average over the past decade – a rate of 20.4GtCO2 per year.
The growth rate of atmospheric CO2 in 2025 is expected to be around 2.3ppm, which is a bit below the decadal average rate of 2.6ppm over the past decade (2015-24). This is well below the record-setting rise of 3.7ppm in 2024, which was primarily driven by the effect of the 2023-24 El Niño conditions weakening the land sink.
Atmospheric CO2 concentrations are set to reach an annual average of 425.7ppm in 2025, representing an increase of 52% above pre-industrial levels of 280ppm.
There remains an unusual imbalance in the carbon budget in 2024, where the sum of the sinks is notably larger than estimated emissions. This can be seen in the figure above, where the dashed line is below the shaded area.
Budget imbalances are not unprecedented – there are large uncertainties in both emissions data and sink estimates. But the rise in the amount of CO2 accumulating in the atmosphere in 2024 is larger than would be expected based on emissions.
There are a number of potential explanations for this 2024 imbalance. The land cover data for 2024 is not yet complete and it is possible that some fire emissions data might be missing from the record. This might result in either higher land-use emissions or lower land sinks than currently estimated.
Alternatively, it could be due to the CO2 growth rate – captured by surface stations managed by the US National Atmospheric and Oceanic Administration (NOAA) – being slightly high. CO2 records for 2024 from these stations are higher than those obtained from satellite-based sensors, though it remains unclear which provides the most accurate measurement.
A declining, but not collapsing, land sink
After an usually weak land carbon sink in 2023, there were a number of media articles about its potential collapse.
For example, in October 2024, the Guardian wrote that “the sudden collapse of carbon sinks was not factored into climate models – and could rapidly accelerate global heating”.
The truth is a bit more complicated. While the impending collapse of the land carbon sink has been greatly exaggerated, there is growing evidence of a long-term weakening of both the land and ocean carbon sinks due to human activity.
And while the land sink has recovered to its pre-El Niño strength in 2025, aided by relatively low global fire CO2 emissions, it will continue to gradually weaken as global temperatures rise. This is not unexpected – scientists have long foreseen a weaker carbon sink in a warmer world.
A weaker land sink will contribute to higher global temperatures in the future as more CO2 emissions from burning fossil fuels and land use change will accumulate in the atmosphere.
The figure below shows the percentage of human emissions absorbed by the land sink in every year since 1959, with a recovery upwards in 2025 after two relatively low years.
In a study published in Nature alongside the release of the 2025 Global Carbon Budget, the same team of researchers provide a detailed estimate of exactly how the land and ocean sinks have changed as a result of human activity.
The research finds that the land and ocean sinks are 25% smaller and 7% smaller, respectively, than they would have been without the effects of climate change over 2015-24.
This amounts to a nearly 20% reduction in the efficacy of current global carbon sinks – that is, both the land and ocean – and a 15% reduction compared to how large they would be without the effects of climate change.
The figure below, from the new paper, shows the impact of climate change on the ocean sink (blue), the land sink (green) and atmospheric CO2 concentrations (grey) since 1960.
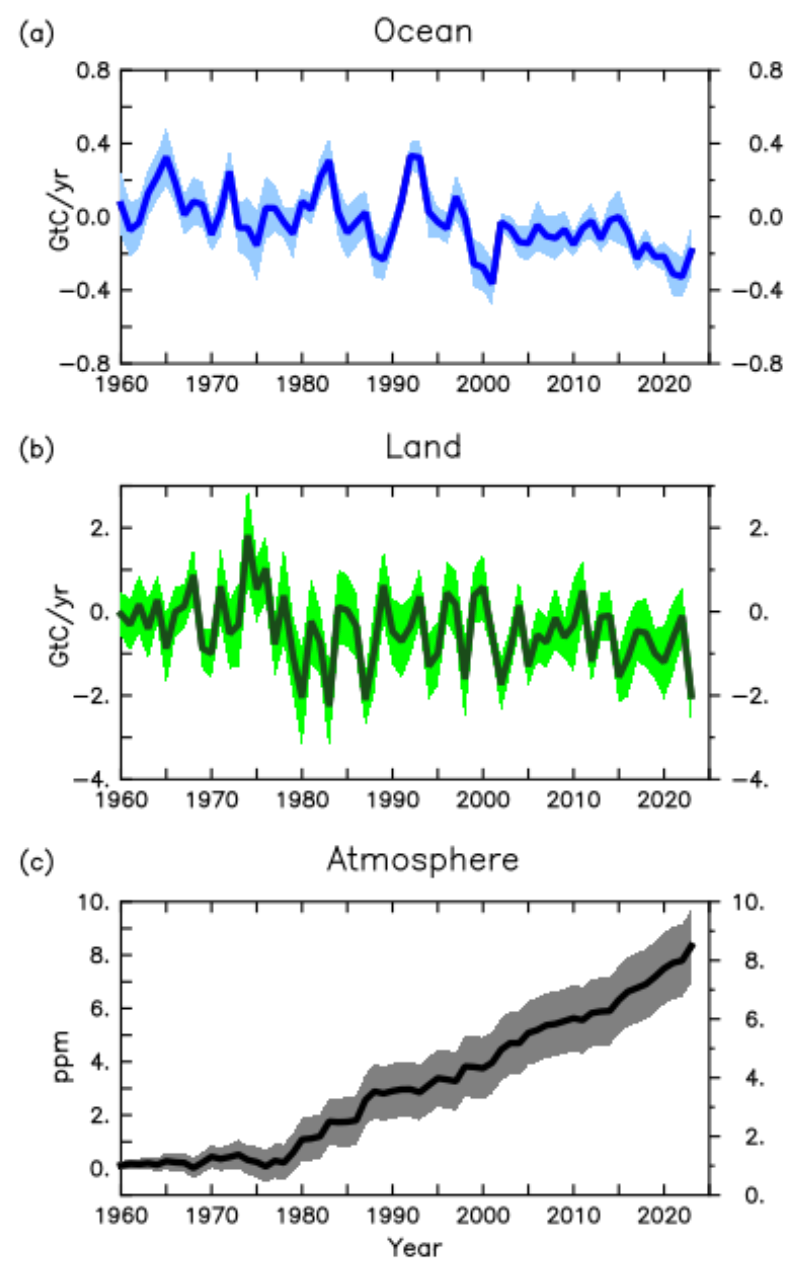
The weakening of carbon sinks due to human activity has led to an increase of atmospheric CO2 of more than 8ppm since 1960. The combined effects of climate change and deforestation have turned tropical forests in south-east Asia and in large parts of South America from CO2 sinks to sources.
And these sinks will likely continue to weaken as long as atmospheric CO2 concentrations continue to rise and the world continues to warm. There are a wide range of estimates of carbon cycle feedbacks among climate models, but a large carbon cycle feedback could result in a few tenths of a degree of future warming.

The post Analysis: Fossil-fuel CO2 emissions to set new record in 2025, as land sink ‘recovers’ appeared first on Carbon Brief.
Analysis: Fossil-fuel CO2 emissions to set new record in 2025, as land sink ‘recovers’
Climate Change
China Briefing 28 May 2026: Deadly rains | China pushes back | Examining China’s carbon intensity metric
Welcome to Carbon Brief’s China Briefing.
China Briefing handpicks and explains the most important climate and energy stories from China over the past fortnight. Subscribe for free here.
Key developments
Several dead as record rainfall hit several provinces
DEADLY DOWNPOUR: Multiple rounds of heavy rainfall have hit central and eastern China, with Agence France-Presse reporting that at least 25 people were killed in the first round, which affected provinces including Guangxi, Guizhou, Hunan and Hubei. Shortly afterwards, nine people died in south-western Chongqing province, reported finance news outlet Caixin, after receiving “nearly 300mm of rain in just two hours, a deluge local residents described as the worst in more than 60 years”. The government has dedicated 280m yuan ($41m) to support affected provinces, reported state news agency Xinhua. The Communist party-backed newspaper China Youth Daily reported that more than 20 provinces have been affected so far, with rains expected to continue throughout June.
CLIMATE CONTRIBUTION: National rainfall over 11-23 May was 46% higher than the seasonal norm, said Xinhua. Nearly 500 weather stations nationwide have logged record rainfall levels, according to state-sponsored newspaper Guangming Daily. The rains were described as “quite unusual”, according to Xinhua, with the National Climate Centre’s chief forecaster Gao Hui telling the agency that the heavy rains were caused by a combination of factors. These included a convergence of several climate systems carrying in strong flows of moisture from nearby marine regions, as well as “rapid global warming, compounded by a fast-developing El Niño” increasing the atmosphere’s moisture content.
The EU ‘overcapacity’ debate
‘CONCERNS’ REGISTERED: The EU will debate proposals in June to “step up efforts” to reduce economic reliance on China and protect its industries, including “safeguard investigations” for at-risk sectors and an “overcapacity instrument”, reported Politico. Finance news outlet Yicai said China in turn has registered its “concerns” with the World Trade Organization over the EU’s Industrial Accelerator Act (IAA), which includes local content requirements for industries including clean-energy technologies.

PATIENCE ‘WEARING THIN’: A report by the Hong Kong-based South China Morning Post cited “some observers” as saying a trade war characterised by the EU “clos[ing] its market down to Chinese imports” may be the “only” way in which the EU can get China to fully engage with its concerns. A China Daily editorial states that China’s “patience” over the EU’s “politicisation and over-securitisation of trade and economic issues” is “wearing thin”. An editorial in the state-supporting Global Times says “erecting higher trade barriers” against Chinese cleantech is “clearly unwise”, given the Iran conflict, adding: “China will never sit idly by while the EU unreasonably suppresses Chinese companies.”
MISSING AGREEMENTS: Meanwhile, Bloomberg covered US president Donald Trump’s claims that his counterpart Xi Jinping “likes the idea of buying more US oil”, following Trump’s state visit to China. [None of the Chinese government readouts or press briefings covering trade outcomes have mentioned any energy agreements so far.] Similarly, the “Kremlin said…a general understanding” had been reached on the Power of Siberia 2 gas pipeline following Russian president Vladimir Putin’s visit to China, according to Reuters, but that there was “no mention of any oil and gas deals among documents signed” during his meeting with Xi. A joint statement published by China’s Ministry of Foreign Affairs said China and Russia will “deepen” cooperation around oil and gas, coal, nuclear and renewable energy, adding that they will “strengthen cooperation in addressing climate change”.
Coal-power generation rose in April
‘INFLEXIBLE’ COAL: Thermal power generation in China “grew for a fourth straight month in April”, rising 3.1% year-on-year in the face of reduced wind and nuclear generation, reported Bloomberg. “Unfavorable weather” was not the only reason for weaker clean-energy generation, wrote Centre for Research on Energy and Clean Air lead analyst Lauri Myllyvirta on Bluesky, with “grid congestion due to inflexible operation of coal plants and transmission lines” also a factor. Separately, research by Global Energy Monitor found that Chinese coal-plant developers “requested approval for 51 gigawatts (GW)” of new capacity in January-March 2026, reported Bloomberg.
-
Sign up to Carbon Brief’s free “China Briefing” email newsletter. All you need to know about the latest developments relating to China and climate change. Sent to your inbox every Thursday.
SOLAR SLOWDOWN: Total power demand grew 6% year-on-year in April, according to Xinhua. Total capacity rose 14% by the end of April, reported energy news outlet International Energy Net, with China’s total solar-power capacity now exceeding 1,250 gigawatts (GW) and wind reaching 661GW, while thermal capacity rose 7% to 1,556GW. However, the growth rate of new solar installations continued to fall for a “fourth straight month”, said Bloomberg, with 9.5GW added in April 2026 compared to 45.2GW the year before.
POLICY EXPANDS: Meanwhile, the government has expanded its renewable power “direct connection” policy to allow clean-energy generators to supply multiple users directly “through dedicated [power] lines”, rather than just one consumer, reported finance news outlet Caixin. It cited a government official saying the policy is “intended to support cleaner energy use in industrial parks…and other large energy-consuming facilities”, which comprise more than two-thirds of total energy demand. Economic news outlet Jiemian quotes an expert saying the policy enables both “lower electricity prices” and “higher utilisation rates” for renewables, “reducing curtailment rates”.
More China news
- ‘SOLIDARITY AND RESOLVE’: China voted in favour of a UN general assembly resolution to back the International Court of Justice’s (ICJ) landmark 2025 opinion on states’ legal obligations to tackle climate change. The Chinese embassy to Vanuatu said on Facebook this displayed its “solidarity and collective resolve”.
- BOND DISCLOSURE: According to a disclosure report by China’s finance ministry, the country raised 6bn yuan in “green sovereign bonds” in 2025, said finance news outlet EastMoney ($884m), of which 700m ($103m) was spent on clean-energy retrofitting.
- WAR ON SAND: The central government has pledged to “improve” and expand its ecological compensation mechanism, including to now provide compensation for building solar farms in desertified areas, said power news outlet BJX News.
- SPACE-BASED SOLAR: Chinese scientists have begun “initial experiments” in a project to “collect [solar] energy in orbit and beam it wirelessly to Earth”, said PV Magazine.
- MINERAL STRATEGY: China has pledged to “accelerate the construction of strategic mineral-reserve sites”, reported Reuters. It will also work with the US on “reasonable” concerns around its rare-earth export controls, Reuters also reported.
Captured

Hydrogen in China continues to be mostly produced from coal, according to a National Energy Administration report. A new Carbon Brief article explored how a series of new policies in China could help scale hydrogen, particularly “green” hydrogen made with renewable power.
Spotlight
China’s new carbon metric leaves Germany-sized gap in its emissions
A major change in the way that China measures its core climate goal has effectively halved the growth in the country’s carbon dioxide (CO2) emissions over the past five years.
The revised measure of “carbon intensity” implies that China’s emissions have only gone up by 7% from 2020-2025, just half of the 14% rise indicated by previous official statistics.
This spotlight is an excerpt of an analysis explaining how the metric appears to have shifted and its implications for China’s climate goals. The full article can be found on the Carbon Brief website.
Germany-sized gap
Reducing carbon intensity – CO2 emissions per unit of GDP – has been China’s key climate commitment since the Copenhagen climate conference in 2009.
Neither China’s international climate pledges nor other official documents have ever set out a definition of carbon intensity.
However, until this year, it was possible to closely reproduce the reported numbers, based on a straightforward interpretation of what carbon intensity means – combining official GDP data with estimates of emissions from the use of fossil fuels.
Now, the types of emissions that are included in the carbon-intensity metric have changed.
The previous carbon-intensity measure apparently included emissions from the use of fossil fuels to generate energy and as chemical feedstocks, so-called “non-energy uses”. It did not include non-fossil fuel CO2 emissions from industrial processes, such as the production of cement.
Based on reported progress against this old scope, China’s carbon intensity had fallen by 12.4% from 2020-2025, well short of its 18% target under the 14th five-year plan.
Yet the 15th five-year plan reported that China had cut its carbon intensity by 17.7% over the same period, indicating a major shift in which types of emissions are included.
A footnote in China’s latest statistical communique indicates that carbon intensity now includes industrial process emissions and excludes non-energy uses of fossil fuels.
The shift has implications for estimates of the country’s emissions.
China’s total emissions were 11.2bn tonnes of CO2 (GtCO2) in 2020. Based on the original methodology, its fossil-fuel CO2 emissions had grown 14% by 2024, an increase of 1,430m tonnes (MtCO2).
In contrast, the newly reported carbon-intensity figures imply that China’s CO2 emissions only grew by 7% between 2020 and 2025, up just 690MtCO2.
The gap between these figures amounts to 730MtCO2, equivalent to the annual emissions of Germany or South Korea.
Decoding the new methodology
The methodology change could have significant implications, making it important to understand how it is being calculated.
The new scope includes industrial-process emissions. One of the largest sources of these emissions, the cement industry, has been contracting, helping explain the improvement to carbon intensity under the new scope.
In addition, the new scope excludes non-energy use of fossil fuels – largely relating to the chemicals industry – which have seen rapid growth in the past five years.
One way to make the numbers add up would be to assume that the amount of carbon embedded in chemical-industry products has increased by the equivalent of 500MtCO2.
However, the reported output of major chemical-industry products cannot account for this level of embedded carbon.
Neither the change in scope of the carbon-intensity calculation, nor the change in the amount of carbon retained in products, can explain the size of the revision in the newly reported numbers. There must be another explanation.
Either the new scope broadly aligns with the explanation outlined above, but also excludes a subset of the CO2 emissions. Or the scope does not exclude any of the CO2, but there are gaps in the monitoring of some energy or industrial-process emissions.
Either explanation would mean China is not accounting for some of its CO2 emissions.
Implications for China’s targets
This change has the effect of weakening China’s climate targets and introducing more uncertainty into tracking progress.
The new numbers means it will require less effort to hit the 2030 carbon-intensity target in its Paris pledge. This target can now be met even if emissions rise, whereas the previous metric would have required a reduction.
It will also require less effort to hit the carbon-intensity target in China’s 15th five-year plan.
In addition, China would be able to officially meet its target to peak emissions by 2030, even if its overall CO2 emissions do not actually peak. The change could also affect delivery of China’s targets to cut emissions by 2035.
While China may use any definition it wants for carbon intensity under the UN climate framework, retrospective changes or inconsistent accounting could erode the value of its commitments.
Moreover, it will ultimately have to close any gaps in its emissions data and reporting, under the transparency rules of the Paris Agreement.
This spotlight is adapted from an article by Centre for Research on Energy and Clean Air lead analyst Lauri Myllyvirta for Carbon Brief.
Watch, read, listen
MINING ACCIDENT: A column in Bloomberg argued that “continuing to veer…toward cleaner [energy] development” could avoid coal-mine accidents such as the one that claimed 82 lives in Shanxi province.
INDONESIAN NICKEL: The European Guanxi Podcast recorded a discussion with Ember’s Dr Muyi Yang about the role China plays in Indonesia’s coal-reliant nickel industry.
INDUSTRIAL HURDLES: A new article in Yicai investigated the reasons why companies are holding back on relocating to zero-carbon industrial parks.
NEGATIVE PRICES: The Communist party-affiliated People’s Daily published a widely-read article on how the emergence of “negative electricity prices” signals a need for a more “coordinated” buildout of clean energy.
163
In billion tonnes, the amount of carbon dioxide (CO2) that China could avoid between 2025-2060 by transitioning to clean energy, according to a new study published by several leading academic institutions in Nature Reviews Earth & Environment. Scientists estimate that the remaining global budget for keeping temperatures below 1.5C is 130bn tonnes of CO2.
New science
- Population exposure to heatwave-drought events “increased markedly” across China during between 1961-90 and 1991-2020, driven by a combination of population growth and more frequent heatwave-drought events | Atmospheric Research
- Fossil-fired power generation accounts for three-quarters of China’s total water consumption for energy production | Mitigation and adaptation strategies for global change
Recently published on WeChat
China Briefing is written by Anika Patel, with contributions from Lekai Liu, and edited by Simon Evans. Please send tips and feedback to china@carbonbrief.org
The post China Briefing 28 May 2026: Deadly rains | China pushes back | Examining China’s carbon intensity metric appeared first on Carbon Brief.
Climate Change
How Utility Companies and States Shaped America’s Clean Energy Transition
A new book examines “renewable portfolio standard” laws and the ways utilities drove the bus.
Not long ago, the rise of U.S. renewable energy was largely tied to state policies that required or encouraged utilities to meet benchmarks for obtaining wind and solar power.
How Utility Companies and States Shaped America’s Clean Energy Transition
Climate Change
Media reaction: UK and Europe’s ‘mind-boggling’ May heat and climate change
Europe has been hit by a searing heatwave, which has shattered temperature records across France, Spain and the UK.
In London, for example, the mercury hit a record high for May of 35.1C at Kew Gardens on Tuesday 26 May, breaking the former record-high May temperature by more than 2C.
Multiple people have died as a result of the high temperatures, including 14 people across the UK and France who drowned.
The heatwave was driven by a “heat dome”, in which warm air moving up from northern Africa has become trapped under a high-pressure system over western Europe.
Experts have been quick to point out the link between extreme heat and global warming, with one saying it was “beyond a shadow of a doubt” that climate change was making such events “more likely and more severe”.
In this article, Carbon Brief examines the impacts of the heatwave and the role of climate change.
- What is happening with the May heatwave in Europe?
- What is driving the record-shattering heat?
- What are the impacts of the extreme heat?
- How has the media responded?
What is happening with the May heatwave in Europe?
Europe has been hit by “mind-bogglingly crazy” temperature records in May, according to the Financial Times, quoting Peter Thorne, director of the ICARUS Climate Research Centre at Maynooth University in Ireland.
In London, on Tuesday 26 May, temperatures hit a record high for May of 35.1C at Kew Gardens – breaking the previous record of 34.8C, set just the day before.
This was more than 2C above the previous May temperature high of 32.8C recorded in 1922 and again in 1944, reported the Times.
The Associated Press added that the UK capital also recorded a rare “tropical night”, when temperatures did not fall below 20C overnight.
The Daily Telegraph reported that Wales and Northern Ireland also saw record-high temperatures, of 27.4C in Cardiff and 23.4C in Armagh, on Sunday.
As with the UK record, these were quickly surpassed. BBC News reported that temperatures hit 32.9C in Bute Park, Cardiff and 24.5C in Thomastown, County Fermanagh, on Tuesday.
BBC News quoted a spokesperson from the Met Office, who said:
“This heat would be exceptional in the UK even in mid-summer, let alone in May.”
The broadcaster added that the average temperature in the UK at the end of May is usually 14-20C.
The Associated Press reported that temperature records have also fallen across Europe.
This includes in France, where temperatures reached 36C on Monday in the country’s south-west and remained above 20C at night across much of the country. The newspaper Libération declared that “it has never been so hot, so early, in France”.
The Guardian reported that the weather agency Météo France said the heatwave could last through the week and bring temperatures as high as 39C in some areas in the country.
As well as the UK and France, other nations have been seeing temperatures soar. France24 reported that temperatures in Spain were expected to reach 38C, with Italy also facing high temperatures.
The Irish Times reported that the May high-temperature record was broken twice in Ireland on the same day, with 29.7C recorded in Carlow and then 30.5C at Shannon Airport on Tuesday.
Le Monde explained that a “heat dome” of warm air from northern Africa is behind the high temperatures across Europe. (See: What is driving the record-breaking heat?)
The Financial Times quoted ICARUS’s Thorne saying that the records being set in Europe, “particularly in the UK and France, are mind-bogglingly crazy”. He added:
“We have more than 100 years of observational records. To break the all-time May record by more than 2C…is hard to comprehend.”
What is driving the record-shattering heat?
The immediate driver of the extreme heat seen over Europe this week is a “heat dome”, according to Politico.
The outlet explained that the phenomenon is driven by “warm air moving up from northern Africa [that] has become trapped under a high-pressure system over western Europe”. It added:
“The effect is similar to that of a lid on a pot, with warm air forced downward and baking affected regions with prolonged, blistering heat.”
Spain’s El Correo explained that the phenomenon is “not a simple heatwave”, adding that such “high-pressure systems trapped over Europe are not usually seen before summer”.
However, many publications have linked the severity of the extreme heat to climate change. The Associated Press quoted ICARUS’s Thorne, who said:
“We know beyond a shadow of a doubt that heatwave events such as this have been made more likely and more severe due to climate change arising from our emissions of heat-trapping greenhouse gases.”
The Guardian quoted Dr Chloe Brimicombe, a researcher at the University of Oxford, who said:
“The record-breaking heat is a reminder of how climate change is impacting our lives in the UK. It highlights the urgency of recent calls for heat adaptation.”
France’s Le Figaro described the event as an “unequivocal sign of global warming”.
The Independent reported that the heatwave “has the fingerprints of climate change all over it”. Other outlets, including Inside Climate News and Scientific American, also covered the links between extreme heat and climate change.
BBC News noted that over the last 30 years, Europe has been warming by 0.56C per decade – more than twice the global average.
The outlet quoted Prof Erich Fischer, professor at the Institute for Atmospheric and Climate Science at ETH Zurich in Switzerland, who compared the record-breaking temperatures to setting a new record in sports.
He explained that “if someone beats a world record in high jump, you would expect them to beat it by one centimetre and not suddenly by 20, 30 centimetres”. Similarly, he said that in the case of temperature, you would expect new records to be broken by a fraction of a degree, rather than 2 or 3C.
However, the broadcaster explained that “when a relatively rare weather system, such as this week’s heat dome, comes around in a warming climate, the margin of record can be huge”.
Simon Stiell, the executive secretary of UN Climate Change, called the heatwave a “brutal reminder of the cost of global warming”, according to Politico.
The Guardian also quotes Stiell, who said:
“The science is clear that human-induced climate change is making these heatwaves more frequent and extreme”.
What are the impacts of the extreme heat?
The heatwave has already been linked to multiple deaths.
This included seven people in France, five of whom died by drowning and two who suffered heat-related deaths while competing in sporting events, said the Guardian.
Separately, the Guardian reported that at least nine people have died in the UK from “water-related incidents” during the heatwave.
France24 reported that “restrictions on outdoor work were imposed in parts of Italy” and that “farmers reported accelerated harvests as temperatures went beyond 30C across [south-west France]”.
The Guardian reported that tennis players at the French Open were “forced to adjust their games while trying to find their best level through obvious discomfort”, amid 33C temperatures in Boulogne-Billancourt, Paris, on Monday.
CNN added that, in the UK, “a wildfire broke out near Arthur’s Seat, a hill in Edinburgh, Scotland, and hundreds of properties in south-east England were left without water as demand spiked”.
BBC News reported on a warning from a chief nurse that hospitals in the south-west of England were busier than usual amid the heatwave.
BBC News reported that the UK saw a surge in emergency calls on Tuesday. The Daily Telegraph added that “Britain’s roads started melting and rail commuters were left stranded for hours”.
Meanwhile, the Guardian reported on a warning from climate campaigners that the government “urgently” needs to start installing air conditioning units in schools and care homes.
The extreme heat has also affected Europe’s renewable energy generation. Bloomberg said that “the heat dome has blocked clouds and fueled booming solar generation”, but added that “by clearing clouds and calming the atmosphere, the heat dome has had the opposite effect on wind speeds”.
How has the media responded?
The unseasonably high temperatures have caught the attention of news outlets in the UK, France and other affected nations.
Often, news stories were accompanied by photos of people relaxing at the beach, eating ice cream and swimming in the sea.
Such images of “fun in the sun” have often drawn criticism from climate researchers for “misrepresenting” the risks of heatwaves.
This choice of imagery – and the way right-leaning newspapers in the UK tend to focus on the positive aspects of hot weather – was highlighted by journalist and media critic Mic Wright in a Substack post. He wrote:
“Most British newspapers write about extremely hot weather with the tone of a frog in a boiling pot pretending it’s a jacuzzi.”
Despite blanket news coverage of the record heat in media outlets across western Europe, there has been relatively little commentary from their opinion pages.
No major UK newspapers have published editorials about the heat and there has been no space dedicated to it in the comment sections of the largest French and Spanish newspapers.
One exception in UK media was the Daily Mail’s climate-sceptic columnist Richard Littlejohn writing an article mocking heat-safety measures and warnings issued by the Met Office and the UK Health Security Agency (UKHSA).
In contrast, the Guardian published an article by Bill McGuire, professor emeritus of geophysical and climate hazards at University College London, warning of the dangers facing the UK as extreme heat becomes “the norm”. He wrote:
“We need, then, to face the fact that life in the 2050s is going to be very different from today, and act now. The sooner we recognise this and begin – as a nation – to prepare and adapt accordingly, the better we will be able to meet these enormous challenges to our everyday lives.”
Oliver Duff, editor-in-chief of the i newspaper, wrote that the UK is “emotionally underprepared”, as a nation, for the heat:
“Worries about climate change are forgotten in the giddy determination to enjoy our brief, unreliable summers, whichever month of the year they deign to visit.”
Writing in the Independent, journalist Kat Brown reflected on the Climate Change Committee’s recent advice to the UK government on adapting to climate change. She stressed the need to “take heatwaves seriously”.
James Wallace, chief executive of the charity River Action, was given a guest column in the Daily Express in which he wrote: “As the nation swelters in record-breaking temperatures, England is sleepwalking into a water crisis.”
In reference to water shortages and increasingly extreme weather, Wallace also emphasised that “this is climate breakdown in real time”.
The post Media reaction: UK and Europe’s ‘mind-boggling’ May heat and climate change appeared first on Carbon Brief.
Media reaction: UK and Europe’s ‘mind-boggling’ May heat and climate change
-
Climate Change10 months ago
Guest post: Why China is still building new coal – and when it might stop
-
Greenhouse Gases10 months ago
Guest post: Why China is still building new coal – and when it might stop
-
Greenhouse Gases2 years ago嘉宾来稿:满足中国增长的用电需求 光伏加储能“比新建煤电更实惠”
-
Climate Change2 years ago嘉宾来稿:满足中国增长的用电需求 光伏加储能“比新建煤电更实惠”
-
Climate Change2 years ago
Bill Discounting Climate Change in Florida’s Energy Policy Awaits DeSantis’ Approval
-
Renewable Energy7 months agoSending Progressive Philanthropist George Soros to Prison?
-
Carbon Footprint2 years agoUS SEC’s Climate Disclosure Rules Spur Renewed Interest in Carbon Credits
-
Greenhouse Gases11 months ago
嘉宾来稿:探究火山喷发如何影响气候预测