


Google has often claimed to be a climate leader. It highlights its use of renewable energy and efficient data centers. In its 2025 sustainability report, the company said it reduced energy emissions from its data centers by 12% in 2024. This was despite the rising demand for AI.
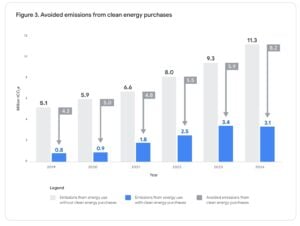
Kairos Fellowship Report Critiques Google’s “Eco-Failures”
On July 2, 2025, the Kairos Fellowship released a report called Google’s Eco-Failures. It accuses Google of misleading the public about its greenhouse gas (GHG) emissions. Google talks about cutting data center emissions and investing in energy. But the report reveals a different story: emissions are rising, and the accounting is unclear.
Key findings from the report include:
-
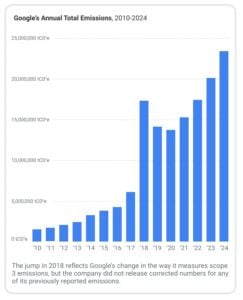
GHG emissions increased by 1,515% from 2010 to 2024.
-
Google emitted 21.9 million more metric tons of carbon in 2024 than in 2010.
-
Scope 2 emissions, related to purchased electricity, surged 820% during this time.
-
Scope 3 emissions (from supply chains and product use) remain high, with little transparency.
-
Only Scope 1 emissions (direct operations) showed a slight drop, just 0.31% of total emissions.
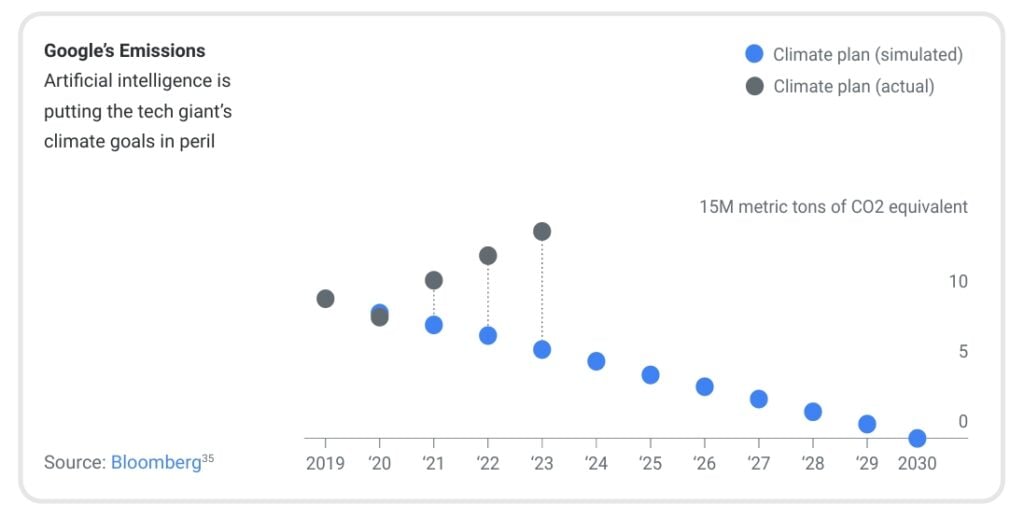
According to Kairos, Google’s focus on “market-based emissions,” which depend on renewable energy credits (RECs), hides its rising actual emissions. Instead of making real cuts, the company seems to offset its emissions on paper while expanding energy-intensive AI and cloud computing infrastructure.
Additionally, the team has also incorporated a chart (see below) from Bloomberg in July 2024 that tracks Google’s market-based emissions. It showed the enormous gap between the company’s plan and its reality.
AI Growth Fuels Energy Demand and Emissions
One major concern is the environmental impact of Google’s growing artificial intelligence infrastructure. The report links rising emissions to increased power use in data centers for generative AI services like Gemini and Google Cloud AI.
Since 2010, Google’s energy use has jumped by 1,282%, even with improvements in computing efficiency. In real terms, energy use and emissions are rising sharply, casting doubt on Google’s sustainability claims.
The Kairos report warns that efficiency metrics may distract from the real issue: massive energy growth driven by AI.
Google’s Energy Savings Aren’t as Impressive
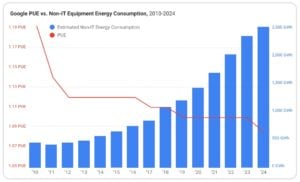
Google often highlights its PUE (Power Usage Effectiveness) improvements. However, the real drop in non-IT energy use happened only in 2011. That year, PUE improved slightly, saving 26.3 gigawatt-hours (GWh) of energy. While it sounds good, it’s small in the bigger picture.
In 2011, Google’s top executives took 491 private jet trips. These flights consumed about 855,000 gallons of jet fuel and burned over 33.8 GWh of energy—more than the energy saved from better PUE. Just by cutting private jet flights, Google could’ve saved more energy.
Simply put, 33.8 GWh equals all the clean energy added to the U.S. power grid in 2023.
Net Zero by 2030? “Unrealistic” and Overly Dependent on Tech Hype
Google aims for net-zero emissions by 2030, but the report calls this goal “unrealistic.” Much of Google’s strategy relies on speculative technologies like advanced nuclear power and carbon-free energy (CFE), which Kairos argues aren’t advancing quickly enough to make a real impact soon.
For exampDle:
-
Deal with Kairos Power for small modular reactors (SMRs) is still in early stages.
-
Its geothermal energy project in Nevada is promising, but too small to offset emissions company-wide.
-
24/7 CFE score rose only 2% (from 64% to 66%) in 2024. Only 9 of 20 grid regions achieved over 80% CFE.
The report noted that even Google admitted progress is slower than needed, citing challenges like energy policy delays, resource limits (especially in Asia-Pacific), and rising energy demands from AI.
Water Use Raises More Questions
Environmental concerns go beyond emissions. According to Kairos, Google’s water withdrawals rose by 340% from 2016 to 2024, reaching 11 billion gallons in 2024 alone. That equals the yearly water use of over 750,000 U.S. households, nearly the entire population of Phoenix, Arizona.
Much of this water cools data centers, raising alarms about Google’s overall environmental impact, especially in drought-prone areas.
Climate Denial on YouTube Adds to the Backlash
Additionally, the report accused Google of enabling climate misinformation on YouTube. Despite the platform’s content policies, Kairos states YouTube still hosts and monetizes climate denial content against its own guidelines.
Even more concerning, in 2025, YouTube reportedly reduced moderation efforts, allowing harmful narratives to spread unchecked, undermining Google’s climate goals.
Greenwashing Allegations Erode Trust
The Kairos Fellowship claims Google’s selective transparency misleads activists, policymakers, and the public about its true climate impact. By showcasing relative improvements and speculative technologies while downplaying rising total emissions, Google risks being seen as a greenwasher rather than a true climate leader.
The group asserts that:
-
Emissions disclosures are unclear and incomplete.
-
Changes in methodology (especially regarding Scope 3 emissions) obscure year-over-year comparisons.
-
Public claims of sustainability don’t match the reality.
The report appears amid growing pressure on tech giants to lessen their environmental impacts. Data centers are expected to use as much power as 22 million U.S. homes in five years.
Furthermore, a news agency stated that an open letter in major U.S. newspapers urged the CEOs of Google, Amazon, and Microsoft to turn down fossil fuel projects. It also called for faster coal plant closures.
What’s Next for Google’s Climate Path?
Google’s environmental goals are ambitious, but its actual progress may differ. The Kairos Fellowship report shows rising emissions, a heavy reliance on credits, and slow clean energy transitions.
While its technological advances and renewable energy efforts are commendable, they may not offset the climate impact of AI-driven growth. So, unless it tackles these underlying issues beyond its current green messaging, it risks falling short of its 2030 net-zero goal.
The bottom line is that Google faces a crucial choice…The tech world is moving fast into an AI-driven future, but environmental costs are climbing. To stay credible and set a standard, the tech giant will have to move from green promises to genuine climate action. If not, it may become a symbol of high-tech greenwashing in the climate battle.
- MUST READ: Google Backs Fusion Energy: Signs 200MW Offtake Agreement with Commonwealth Fusion Systems
The post Explosive Report Challenges Google’s Emissions Data as Nothing but Greenwashing appeared first on Carbon Credits.

EU carbon credit claims changed on 27 September 2026, the day the Directive (EU) 2024/825 began to apply across the European Union. The change is narrow. It changes how a company can talk about the credits it buys. A product can no longer be called neutral on the strength of compensation alone; however, every specific, evidenced statement about what a company measured, reduced, and funded stays fully available.

The post Promoting Improved Cooking Practices in Nigeria appeared first on Terrapass.


-
Climate Change1 year ago
Guest post: Why China is still building new coal – and when it might stop
-

 Greenhouse Gases2 years ago
嘉宾来稿:满足中国增长的用电需求 光伏加储能“比新建煤电更实惠”
-
Greenhouse Gases1 year ago
Guest post: Why China is still building new coal – and when it might stop
-

 Climate Change2 years ago
嘉宾来稿:满足中国增长的用电需求 光伏加储能“比新建煤电更实惠”
-

 Renewable Energy12 months ago
Sending Progressive Philanthropist George Soros to Prison?
-
Climate Change2 years ago
Bill Discounting Climate Change in Florida’s Energy Policy Awaits DeSantis’ Approval
-
Greenhouse Gases1 year ago
嘉宾来稿:探究火山喷发如何影响气候预测
-

 Climate Change2 years ago
Analysis: China’s CO2 falls 1% in Q2 2024 in first quarterly drop since Covid-19