

Despite coal-power output in the US falling to its lowest level in nearly 60 years, the nation’s greenhouse gas emissions fell by just 0.2% in 2024, according to new research from the Rhodium Group.
Increases in electricity demand and continued growth in transport emissions led to US emissions remaining broadly “unchanged”, while the economy grew by 2.7%, the New York-based research group finds.
The US is the world’s second-largest annual emitter, has very high per-capita emissions and by far the greatest historical responsibility for current warming.
Even though emissions remained unchanged from a year earlier, they were still 8% below pre-pandemic levels in 2024 and remained about 20% below 2005 levels, Rhodium notes.
While the pace of decarbonisation slowed in 2024, after a reduction of 1.9% in 2023, new policies and regulations introduced under the Biden administration were expected to see this accelerate in the coming years, Rhodium says.
However, it notes that this progress could now be at risk from the incoming presidency of Donald Trump. Trump has repeatedly pledged to roll back a range of environmental policies brought in by his predecessor Joe Biden.
Solar and wind overtake coal
Renewable energy in the US grew in 2024, with the combined output from solar and wind surpassing coal in the electricity mix for the first time ever, according to Rhodium.
Together, solar and wind made up 16% of the electricity mix in 2024, up nearly two percentage points from 2023. Solar generation grew by 32% and wind by 7%, both outpacing the 4% growth in gas generation, the report notes.
Solar had a record-setting year in 2024, accounting for 64% of all new electricity-generating capacity added to the US grid in Q3, according to the Solar Energy Industries Association.
However, the rollout of wind generation was hit by notable challenges, including increased costs and project siting difficulties.
Gas-fired electricity generation remained the single-largest source in the US by far, producing a record 1,782 terawatt hours (TWh) in 2024, some 43% of the total.
Nuclear was the second-largest, as shown in the figure below. It generated 781TWh, some 19% of the total, just ahead of the combined output of wind and solar, as well as coal.

The growth of wind and solar helped ensure that the generation mix was “slightly cleaner” in 2024, even though demand for electricity rose by 3%, says Rhodium.
Buildings represented the biggest increase in demand for electricity, where a 10% growth in “cooling degree days” – a measure of how hot the temperature is – drove up summer electricity use. (The US saw record-breaking heatwaves across the year, with the summer of 2024 the hottest on record, the Guardian reported.)
After buildings, industry ranked second and commercial buildings third as the biggest sources of increased electricity demand.
There has been a lot of media focus on artificial intelligence (AI) driving electricity demand growth. Moreover, a Department of Energy-commissioned study in December found that US data centre power demand could nearly triple within four years, consuming as much as 12% of the country’s electricity by 2028.
However, Rhodium notes that data centres were only a small source of demand growth in 2024, representing just a fraction of the third biggest source of electricity demand.
In 2024, the additional power demand was met by gas, wind and solar, while coal continued to decline, dropping one percentage point to 16% of the electricity mix.
In absolute terms, coal provided as much power in 2024 as it did in 1967 when Lyndon Baines Johnson was the 36th president of the US, the Vietnam War was raging and Elvis Presley married Priscilla Ann Beaulieu in Las Vegas.
Gas remained the single largest source of power in the US in 2024, accounting for 43% of the total (1 percentage point higher than in 2023), notes Rhodium.
This growth – to meet increased demand – offset the reduction in coal generation and emissions from the power sector increased by 0.2% (3m tonnes of carbon dioxide equivalent, MtCO2e) in 2024.
Alongside the increase in renewable energy, the US saw record-high investment in the manufacturing and deployment of clean technologies last year, Rhodium says.
For example, investment in clean technologies accounted for 5% of total private investment in structures, equipment and durable consumer goods in the third quarter of last year, according to the latest data from the Clean Investment Monitor.
Crude oil production was up by 2.4% in 2024, while gas production fell by 0.6%, according to Rhodium. This was a slightly bigger drop in gas production than in 2020 when the Covid pandemic hit, as producers reacted to lower prices by drilling fewer new wells and curtailing production, it adds.
The research estimates that oil and gas systems released around 10% less methane per unit of output in 2024 than in 2022, due to cleaner production practices as well as state and federal regulations.
As such, cleaning up oil and gas production led to a 3.7% drop in emissions from the sector, some 11MtCOe relative to 2023.
Hurricanes hit industrial emissions
Industrial emissions fell in 2024 due to low manufacturing output, Rhodium finds. Across the year, the sector’s emissions fell by 1.8%, or 22MtCO2e, from 2023.
Chemicals, computers and electronics, and paper production grew in 2024, but declines in food and beverages, mining and machinery offset these gains, it says.
This included historically low coal mining activity, which fell by 12% in 2024 to its lowest level in decades due to demand falling, as coal power plants retire and are replaced by renewables and gas, as noted in the section above.
One factor in declining industrial output was extreme weather. Along with the impact of labour disruption on production, Hurricanes Beryl, Milton and Helene also all hit manufacturing output, notes Rhodium.
Transport remained the highest-emitting sector in the US, with a 0.8% increase in emissions driven by post-pandemic rebounds in jet fuel and petrol consumption, according to Rhodium.
Emissions from transport, industry and buildings have remained relatively steady in recent decades, whereas the power sector has seen steady declines, as shown in the figure below.

“Available seat miles” – a metric used to quantify air travel – set a new record in 2024, up 6% year-on-year in the first three quarters of the year, according to Rhodium.
There was also “record-high road activity” the report notes, with a 1% increase in road traffic volumes up to October. As such, petrol consumption increased, although diesel continued to fall, dropping close to 2020 levels.
Despite these increases in transportation activity, emissions from the sector still remain 2.%% below 2019 levels.
Building sector emissions increased by 0.4% due to elevated fuel use, Rhodium adds.
Looking ahead
The “modest 2024 decline underscores the urgency of accelerating decarbonisation in all sectors” concludes Rhodium, in particular with the imminent change in US government.
Currently, the US is not on track to meet either its 2030 Paris Agreement target of a 50-52% reduction in emissions relative to 2005 levels or its newly set 2035 goal of a 61-66% reduction.
To bridge the gap between the current US trajectory and its stated goals would require an average emissions reduction of 7.6% every year from 2025 through to 2030, says Rhodium. This would be more than two-thirds of the drop seen as a result of Covid lockdowns in 2020.

Analysts, including Rhodium, have predicted that the combined impact of the Inflation Reduction Act (IRA), Infrastructure Investment and Jobs Act and Environmental Protection Agency (EPA) regulations on vehicles and power plants will increase the pace of emissions reductions in the future.
There is already some evidence of this, with the most recent data from Clean Investment Monitor suggesting that clean energy and transportation investment could reach a high of $71bn in the third quarter of 2024.
This would cap the “nearly unbroken streak of quarter-on-quarter growth since the IRA’s passage, with clean investment now accounting for a record 5% of total US private investment”, notes Rhodium.
However, whether the rate of emissions reduction actually accelerates is heavily dependent on the extent to which the incoming Trump administration and the Republican Congress rollback and repeal EPA regulations and energy and tax policies brought in or expanded through the IRA.
Trump has repeatedly promised to pull back climate policies, saying in September 2024 that “to further defeat inflation, my plan will terminate the Green New Deal, which I call the Green New Scam” in reference to the IRA, according to Politico.
In December, Rhoiodum published a separate piece of research dubbed: “Trump 2.0: What’s in Store for US Energy and Climate?” It explored a number of potential pathways the Trump administration could pursue when he takes office on 20 January, including one called “rollbacks and repeal”.
This pathway would see the pace of US decarbonisation slow significantly, leaving emissions at 24-40% below 2005 levels in 2035. This is equivalent to roughly an additional 1bn tonnes of CO2e in 2035 in each emissions scenario explored by Rhodium.
Rolling back regulations alone could lead to a 270-470MtCO2e increase in emissions by 2035, it adds. This would represent 25-50% of the total emissions increase under the full “rollbacks and repeal” pathway.
Analysis by Carbon Brief in March 2024 found that Trump winning November’s presidential election could lead to a cumulative additional 4bn tonnes of US emissions by 2030, compared to under Bidens’s plans.
Ben King, co-author of the preliminary emissions analysis and Trump 2.0 note, and an associate director in Rhodium Group’s energy and climate practice, tells Carbon Brief:
“It’s not clear what precise policy actions the Trump administration and Republican-controlled Congress will take, but we analysed the potential impacts of two major policy changes: rolling back major climate regulations from the Environmental Protection Agency (EPA) and repealing the energy and tax policies that were enhanced and expanded through the Inflation Reduction Act (IRA). Rolling back EPA climate regulations alone – which the Trump administration could pursue unilaterally, though not immediately – could increase greenhouse gas emissions by 270-470MtCO2e in 2035.
“A more extreme policy pathway, rolling back EPA regulations and immediately repealing the energy and tax components of the IRA – which would require congressional approval – could increase emissions by nearly 1GtCO2e in 2035.”
Rhodium concludes its analysis of the US’s emissions in 2024 by noting that it will be watching developments around rolling back and repealing climate policies “closely”.



The post US emissions ‘unchanged’ in 2024 despite coal power at lowest level since 1967 appeared first on Carbon Brief.
https://www.carbonbrief.org/us-emissions-unchanged-in-2024-despite-coal-power-at-lowest-level-since-1967/

Climate Change
GREENPEACE GAS PROTEST DAY TWO: Activists spend first night on Woodside’s Scarborough gas platform, “in this for the long haul”
- NEW footage and photos available here and on Instagram – more being uploaded today.
- Interviews available with campaigners on board the Rainbow Warrior on request.
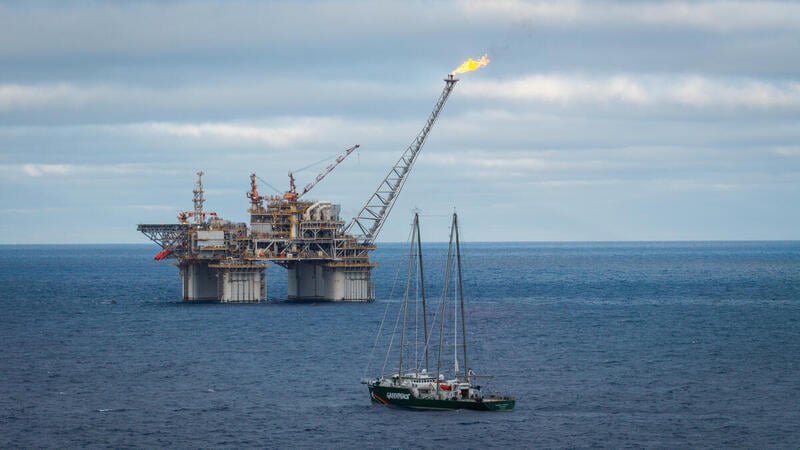
Greenpeace Australia Pacific activists have slept overnight on Woodside’s Floating Production Unit and dropped a massive 12×14-metre banner reading “Stop Woodside’s Dirty Gas. Save Scott Reef”.
Two activists have set up temporary hanging tents on the South East pillar, while the other two returned to the Rainbow Warrior late yesterday afternoon, after fulfilling their initial role. The activists will occupy the platform for as long as possible.
The environmental advocacy group is peacefully protesting Woodside’s plans to drill for oil and gas at Scott Reef as part of its Browse proposal.
Sakyo Noda, one of the Greenpeace Australia Pacific activists, said: “As a Japanese person living in Australia, I feel incredibly passionate about stopping Australia’s gas exports to Asia.
“Despite what the gas industry tells us, Australia’s gas is not helping to decarbonise Asia. It is simply not true. We shouldn’t be allowing fossil fuel companies like Woodside to extract new fossil fuels, let alone at extraordinary places like Scott Reef”.
Aboard the Rainbow Warrior, Geoff Bice, WA Campaign Lead at Greenpeace Australia Pacific, added, “Everyone is in good spirits. We’re in it for the long haul.”
Links:
Photos and video of Scott Reef here
Audio and footage of yesterday’s press conference here
Content and live updates will be uploaded to a live blog and Instagram
In-person interviews in Perth with David Ritter, CEO of Greenpeace Australia Pacific, can be organised. Dial-in, SimSat and Zoom interviews with Geoff Bice, WA Campaign Lead at Greenpeace Australia Pacific, currently aboard the Rainbow Warrior, can be organised.
Saturday, 17 October 2026
7.18 AM AWST
Hi folks! We’re joining you live from the Rainbow Warrior where we will be providing you with updates as our four activists continue scaling and occupying Woodside’s gas platform. The activists are peacefully protesting against Woodside’s latest gas expansion plans, the Browse project, which would see up to 57 toxic wells drilled at Scott Reef.
“Right now our activists are scaling Woodside’s massive Floating Production Unit. They are scaling the South-East pillar and the underside of the Helideck. They’ll be setting up camp soon and have plenty of provisions with them – so stick around!”
5:45 AM AWST
Our RHIBS are in the water! We’ve deployed our four activists and our ship crew on our small fast boats, headed to the gas platform. We’re carrying crew and equipment, plenty of food, all of our safety climbing gear, some big banners, cameras and a whole lot of heart… someone even has something to read after they get settled in.
5:26 AM AWST
Before sunrise activists prepared to launch RHIBS from the Rainbow Warrior.

Looking for a front seat view?
You can follow along with the Live Rainbow Warrior bow cam here!
Looking for more?
Follow us on Instagram for a peek behind the scenes and hear from our Rainbow Warrior crew.
Live blog: Greenpeace activists occupy Woodside gas project to save Scott Reef
Climate Change
Greenpeace activists climb and occupy Woodside’s Scarborough gas project calling on the Australian government to “Stop Woodside’s Dirty Gas” and “Save Scott Reef”
PERTH, Saturday 17 October 2026 — Four Greenpeace Australia Pacific activists are scaling and occupying a Floating Production Unit at Woodside’s Scarborough gas project off the coast of Western Australia, displaying banners reading: “Stop Woodside’s Dirty Gas. Save Scott Reef.”
- Photos and video available here and here. More will be uploaded throughout the day.
- Content and live updates will be uploaded to a live blog and to Instagram
Early this morning at 05:45 AWST, Greenpeace Australia Pacific activists launched from the Rainbow Warrior, Greenpeace’s flagship vessel, scaling and attaching themselves to a Floating Production Unit (FPU), a key piece of gas processing infrastructure at the Scarborough gas field over 200km off the coast of Exmouth.
Woodside has since confirmed it has initiated a temporary shut down of the FPU.
Greenpeace Australia Pacific is occupying the gas platform in peaceful protest of Woodside’s plans to drill for oil and gas at Scott Reef as part of its Browse proposal.
David Ritter, CEO at Greenpeace Australia Pacific, said: “Greenpeace Australia Pacific is taking action today to expose the unacceptable risk to Scott Reef posed by Woodside’s plans.
“Australians love our oceans. Woodside’s reckless Browse gas proposal would turn the magnificent Scott Reef into an industrial gas zone. Woodside wants to drill up to 57 toxic wells around Scott Reef, Australia’s largest oceanic reef, home to nesting green sea turtles, and endangered species like pygmy blue whales and the dusky sea snake; it is a place like nowhere else on Earth.
“Woodside has an alarming track record of oil spills, incidents and environmental neglect, and can’t be trusted with our oceans. From whaling in Albany in the seventies, to Woodside’s threat to Scott Reef today, there’s more than fifty years of history, of Greenpeace taking action off WA’s coasts to protect our oceans.
“There’s no future in new gas projects. Our future is in secure homegrown renewable energy, green industry and exports, where communities and places like Scott Reef are protected — there’s no future in dirty gas shipped offshore.
“The prospect of drilling for oil or gas on the Great Barrier Reef would be considered absolute madness today, but that is exactly the decision before the government: save Scott Reef or risk its destruction at the hands of a gas corporation.”
From aboard the Floating Production Unit, Dr Chris Holden, Greenpeace Australia Pacific activist said: “As a doctor, when I see new fossil fuel projects like Woodside’s Browse project being put forward, I can’t help but think about the impact this is going to have on the health of our communities and planet, and feel a sense of duty to act.
“Not only will this project do irrevocable harm to nature at Scott Reef, it will have a terrible impact on our climate, putting all of our lives at risk.
“On the Rainbow Warrior I’m carrying a copy of the 2025 Lancet countdown report, which warns that health impacts of climate change are worsening, with millions dying needlessly each year due to fossil fuel dependence, growing emissions, and failure to adequately adapt.
“With warnings like this from the leading global health professionals, our government simply can’t allow fossil fuel projects like Woodside’s Browse project to go ahead. It is their duty to do what is in the best interest of our communities.”
Almost half a million people have signed a petition calling on the government to Save Scott Reef and Woodside’s Browse gas project.
-ENDS-
Notes:
- Dial-in, SimSat and Zoom interviews with Geoff Bice, WA Campaign Lead at Greenpeace Australia Pacific, currently aboard the Rainbow Warrior, can be organised separately
Media contact:
Greenpeace Australia Pacific media team on +61 406 231 892 or +61 407 581 404

GREENPEACE GAS PROTEST DAY TWO: Activists spend first night on Woodside’s Scarborough gas platform, “in this for the long haul”

Making Billions by Harming Others
