

Lithium, a vital elemental metal, also dubbed as “white gold”, has gained significant attention as a sought-after commodity. This is particularly due to its crucial role in battery manufacturing for electric vehicles (EVs).
The surge in EV sales has fueled optimism among investors regarding companies involved in lithium production and refinement. Despite being a common substance, lithium prices experienced an astounding 1,000% increase from 2021 to the end of 2022. This exceeds the previous highs set in 2017.
However, the landscape changed in 2023.
An increasing supply of lithium from mines in Africa and Australia is putting downward pressure on prices. Plus, reports of lower consumer demand for EVs in the U.S. and China may further contribute to a decline in lithium prices.
Lithium Carbonate (CNY) Price

Following the unprecedented boom of 2021/2022, stocks of lithium producers have faced significant declines due to a continued plunge in lithium prices.
As with all commodity stocks, lithium stocks are intricately tied to supply and demand dynamics in the underlying materials they deal with. The future trajectory of lithium prices and associated stock values will likely be influenced by the continued demand for EVs.
Investing in top lithium stocks follows a similar process to investing in any other type of stock.
Here are our top picks for lithium stocks that are worth each penny of consideration.
Albemarle Corporation (ALB)
 Market cap: US$15.1 billion
Enterprise value: US$17.1 billion
Albemarle Corp. stands prominently among the largest lithium stocks and is a key player in lithium mining. With a market value comparable to other major commodities such as Barrick Gold Corporation (GOLD).
The company’s substantial scale and the optimistic long-term forecasts for EV demand position Albemarle as one of the top lithium stocks in the current market. Albemarle has embarked on a significant production expansion initiative in South Carolina, projecting an annual capacity of about 225,000 metric tons of lithium.
-
The American lithium giant anticipates this capacity to triple by the 2030, aligning its growth plans and expectations for the growing EV sector.
But recently, it redirected efforts towards its Kings Mountain lithium-spodumene mine resource in North Carolina, in response to softer market conditions.
Albemarle had warned of potential market share loss to Chinese producers after its unsuccessful takeover bid for Australian lithium producer Liontown Resources. The $4.2 billion merger was abandoned.
The largest producer of lithium for EV batteries has also revised its annual forecast downwards at the end of last year. They further reported a lower-than-expected quarterly profit due to declining prices for lithium.
Still, Albemarle now anticipates a 30% increase in lithium sales volume for the year. But with prices expected to rise only 15%, falling short of market expectations for robust growth.
The reduction in demand from consumers has led major EV manufacturers like Tesla, Ford Motor, General Motors, and Rivian to scale back production. Additionally, Toyota Motor has cut its EV sales forecast by 40% in 2024 due to lower demand in China. This reduced demand is impacting the lithium market and related stocks.
Albemarle’s peers have experienced similar declines. For instance, shares of Sociedad Química y Minera de Chile S.A. are down -39.4% YTD.
Sociedad Química y Minera S.A. (SQM)

Market cap: US$15.1 billion
Enterprise value: US$16.1 billion
Chile, globally recognized for its mineral wealth, features Sociedad Química y Minera de Chile (SQM) at the core of its mining industry. While SQM engages in the production of various minerals, its significance in lithium extraction is paramount.
Alongside diversified mining counterparts like Albemarle and Ganfeng, SQM maintains robust double-digit operating profit margins, substantial cash reserves for expansion, and minimal debt.
In 2022, SQM achieved its highest-ever corporate revenues, surpassing $10.7 billion in sales. A substantial 76% of this revenue was derived from lithium and related products.
SQM’s pivotal role goes beyond its economic contributions, as it stands as the largest taxpayer in Chile. Recent discussions about the government potentially increasing its stake in the company have emerged and raised eyebrows.
Such a move introduces the inherent risks associated with government ownership, including the possibility of political interference. Some investors don’t find it a favorable development.
The trajectory of SQM’s shares showed positive momentum until late 2022, when a decline followed. This is largely due to weakened lithium prices and concerns about the company receiving a fair valuation for the anticipated increased government stake.
The impending nationalization raises uncertainties about state control of lithium. Once this pushes through, it may impact SQM’s profitability.
Looking forward to a long-term demand for lithium to exceed supply, SQM has strategically invested in expanding its production capacity. These developments position the company to augment its market share in the lithium supply chain, particularly for EV batteries.
Li-FT Power (LIFT; LIFFF)

Market cap: US$168.5 million
Enterprise value: US$163.4 million
Given the insufficient domestic lithium reserves to meet demand, the U.S. is in a challenging position. With the need for a domestic supply, Canada is positioned to contribute to meeting U.S. lithium requirements. This is where a junior lithium company, Li-FT Power (LIFT: LIFFF), based in Vancouver, British Columbia, perfectly comes into the picture.
Li-FT has acquired promising lithium assets in Canada, starting drilling on their flagship project in June last year. The company’s investment thesis revolves around the aggressive exploration and expansion of high-grade lithium pegmatites to define world-scale resources in a proven mining jurisdiction.
The company’s strategy focuses on consolidating and advancing hard rock lithium pegmatite projects in Canada, particularly in known lithium districts. Li-FT Power aims to apply modern systematic exploration techniques to unveil value in these projects that historical work hasn’t fully realized.
The project portfolio includes assets in the Northwest Territories and Quebec, with flagship projects like the Yellowknife Lithium Project and the Pontax Project, which has revealed an 8km long lithium anomaly.
 The company is well-financed to progress its projects, cementing its commitment to advancing the exploration and development of high-quality lithium assets in Canada.
LIFT strategically positions itself to take advantage of weak industry sentiment, allowing for the acquisition of shares at discounted valuations.
The Lithium Deficit Looms
While those top lithium stocks are making waves in 2024, projections indicate that lithium prices will further decline due to:
- increasing supplies of the battery metal, and
- subdued demand from China.
In China, lithium carbonate prices have plummeted from an all-time high of $81,360 per tonne in November 2022. This is the lowest level in two years at $20,782 per tonne in the current month. As lithium carbonate prices have fallen by 67% year-on-year, Chinese refining companies are responding by cutting production or suspending operations.
This represents a nearly 75% correction due to a series of negative catalysts that have suppressed lithium prices. The situation is even more challenging for lithium hydroxide markets, primarily due to the sluggish performance of the nickel cobalt manganese battery sector compared to the lithium iron phosphate battery sector.
-
Australia, which contributes 40% of global lithium production, expects a decline in the spot price of spodumene from around $3,840 per tonne in 2022 to $2,200 per tonne in 2025.
Lithium miners are adjusting to the sharp drop in demand for EVs in China by reducing costs and scaling back production expansion plans.
This response aligns with the challenges faced by lithium producers globally as the market grapples with oversupply and weakening demand for EVs.
The inability of China to meet its own demand for lithium, despite being the world’s 3rd-largest producer, has significant implications for other countries that rely on Chinese lithium. This is why the US aims to develop its own lithium supply chain that doesn’t depend on China.
- RELATED: Lithium-Ion Wars: US Battery Imports Soar by 66%, Setting New Record as Domestic Production Ramps Up
The Inflation Reduction Act, in particular, specifically promotes onshoring of clean energy manufacturing, including EVs, within the U.S. And that also means to reduce or cut off import of lithium from China.
Corinne Blanchard, Deutsche Bank’s director of lithium and clean tech equity research, is among the analysts predicting a future shortage in the lithium industry. Despite forecasting supply growth, she believes that demand will outpace it at a much faster pace.
Blanchard anticipates a “modest deficit” of around 40,000 to 60,000 tonnes of lithium carbonate equivalent by the end of 2025, but she foresees a much larger deficit of 768,000 tonnes by the end of 2030. This forecast aligns with the broader industry expectations of increasing demand for lithium, particularly driven by the growing EV market.
2024 unfolds with challenges for the lithium market, witnessing stock declines post 2023’s meteoric rise. Despite the setback, top players like Albemarle, SQM, and Li-FT Power strategically position themselves. As global trends hint at a Chinese lithium market decline, industry experts see a future lithium deficit, driven by the relentless growth in the EV market.
The post Top Lithium Stocks Making Waves in 2024 appeared first on Carbon Credits.
More than 60 global companies, including Apple, Amazon, BYD, Salesforce, Mars, and Schneider Electric, are pushing back against proposed changes to global emissions reporting rules. The group is calling for more flexibility under the Greenhouse Gas Protocol (GHG Protocol), the most widely used framework for measuring corporate carbon footprints.
The companies submitted a joint statement asking that new requirements, especially those affecting Scope 2 emissions, remain optional rather than mandatory. Their letter stated:
“To drive critical climate progress, it’s imperative that we get this revision right. We strongly urge the GHGP to improve upon the existing guidance, but not stymie critical electricity decarbonization investments by mandating a change that fundamentally threatens participation in this voluntary market, which acts as the linchpin in decarbonization across nearly all sectors of the economy. The revised guidance must encourage more clean energy procurement and enable more impactful corporate action, not unintentionally discourage it.”
The debate comes at a critical time. Corporate climate disclosures now influence trillions of dollars in capital flows, while stricter reporting rules are being introduced across major economies.
The Rulebook for Carbon: What the GHG Protocol Is and Why It’s Being Updated
The Greenhouse Gas Protocol is the world’s most widely used system for measuring corporate emissions. It is used by over 90% of companies that report greenhouse gas data globally, making it the foundation of most climate disclosures.
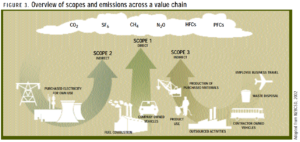
It divides emissions into three categories:
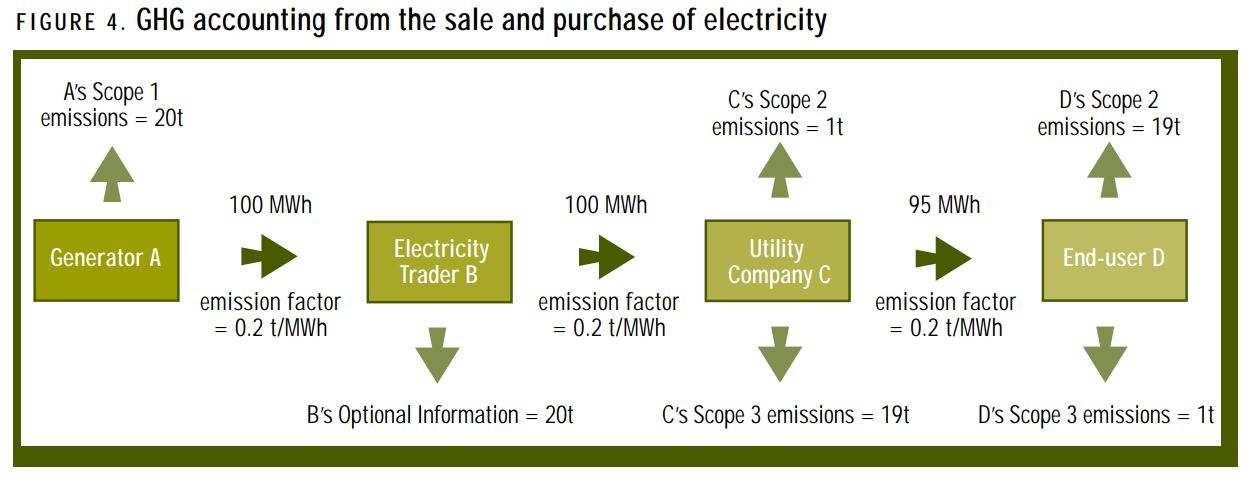
- Scope 1: Direct emissions from operations
- Scope 2: Emissions from purchased electricity
- Scope 3: Emissions across the value chain
The current Scope 2 rules were introduced in 2015, but energy markets have changed since then. Renewable energy has expanded, and companies now play a major role in funding clean power.
Corporate buyers have already supported more than 100 gigawatts (GW) of renewable energy capacity globally through voluntary purchases. This shows how influential the current system has been.
The GHG Protocol is now updating its rules to improve accuracy and transparency. The revision process includes input from more than 45 experts across industry, government, and academia, reflecting its global importance.
Scope 2 Shake-Up: The Battle Over Real-Time Carbon Tracking
The proposed update would shift how companies report electricity emissions. Instead of using flexible systems like renewable energy certificates (RECs), companies would need to match their electricity use with clean energy that is:
- Generated at the same time, and
- Located in the same grid region.
This is known as “24/7” or hourly or real-time matching. It aims to reflect the actual impact of electricity use on the grid. Companies, including Apple and Amazon, say this shift could create challenges.
According to industry feedback, stricter rules could raise energy costs and limit access to renewable energy in some regions. It can also slow corporate investment in new clean energy projects.
The concern is that many markets do not yet have enough renewable supply for real-time matching. Infrastructure for tracking hourly emissions is also still developing.
This creates a key tension. The new rules could improve accuracy and reduce greenwashing. But they may also make it harder for companies to scale clean energy quickly.
The outcome will shape how companies measure emissions, invest in renewables, and meet net-zero targets in the years ahead.
Why More Than 60 Companies Oppose the Changes
The companies argue that stricter rules could slow climate progress rather than accelerate it. Their main concern is cost and feasibility. Many regions still lack enough renewable energy to support real-time matching. For global companies, aligning energy use across different grids is complex.
In their joint statement, the group warned that mandatory changes could:
- Increase electricity prices,
- Reduce participation in voluntary clean energy markets, and
- Slow investment in renewable energy projects.
They argue that current market-based systems, such as RECs, have helped scale clean energy quickly over the past decade. Removing flexibility could weaken that momentum.
This reflects a broader tension between accuracy and scalability in climate reporting.
Big Tech Pushback: Apple and Amazon’s Climate Progress
Despite their push for flexibility, both companies have made measurable progress on emissions reduction.
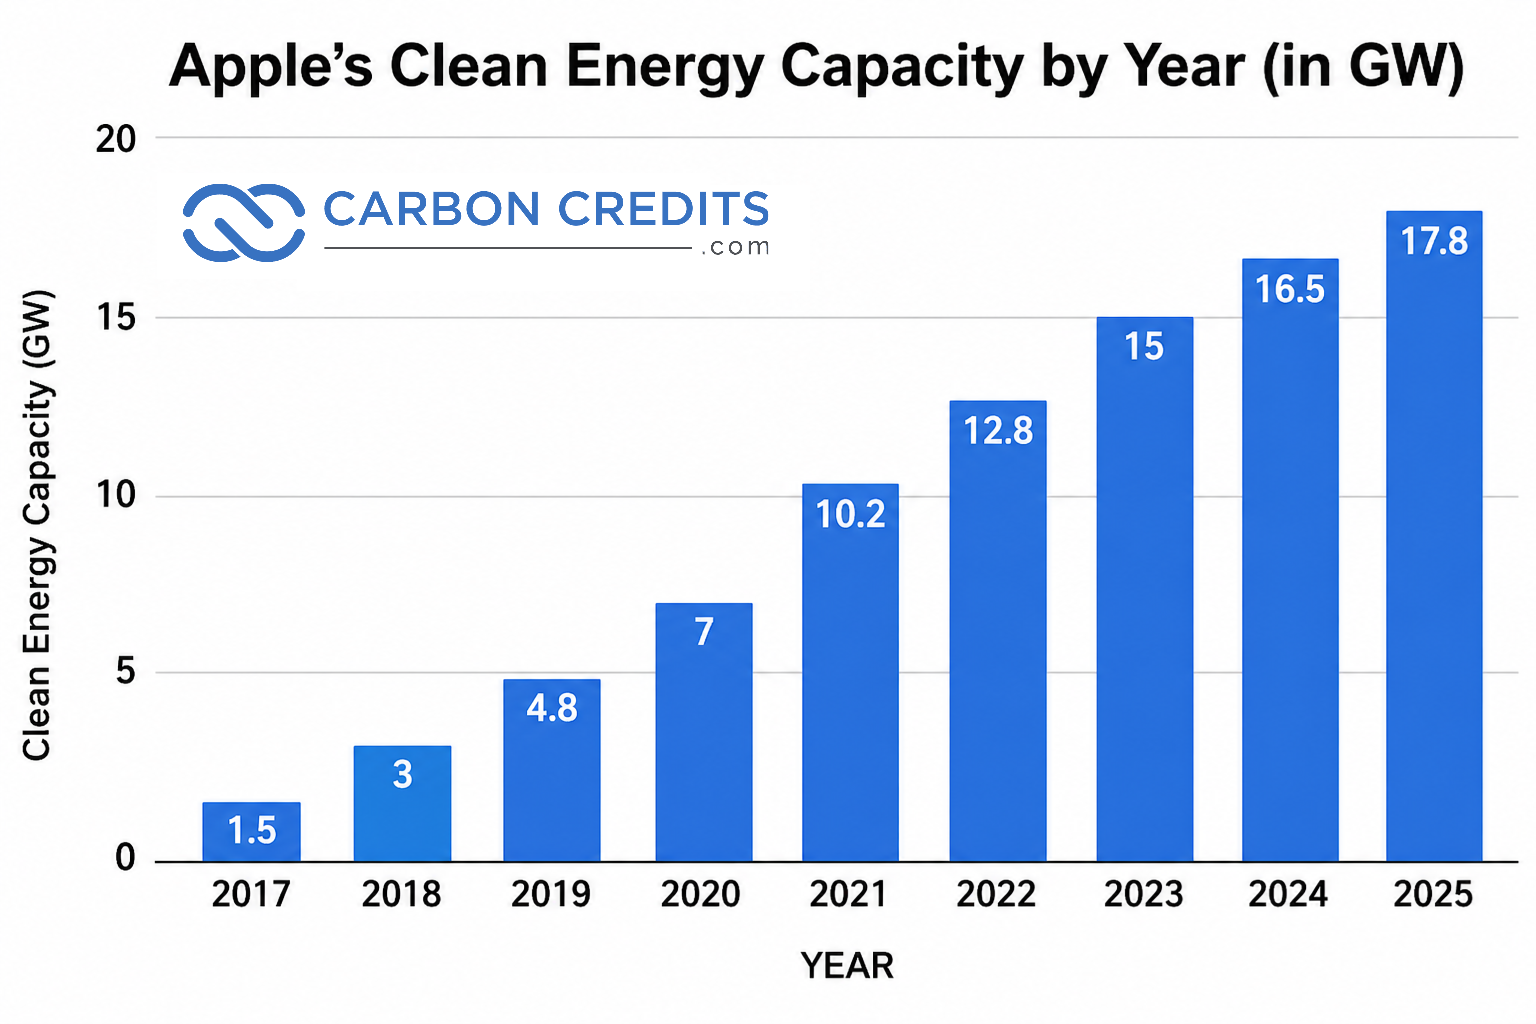
Apple reports that it has reduced its total greenhouse gas emissions by more than 60% compared to 2015 levels, even as revenue grew significantly. The company is targeting carbon neutrality across its entire value chain by 2030. It also reported that supplier renewable energy use helped avoid over 26 million metric tons of CO₂ emissions in 2025 alone.
In addition, about 30% of materials used in Apple products in 2025 were recycled, showing a shift toward circular manufacturing.
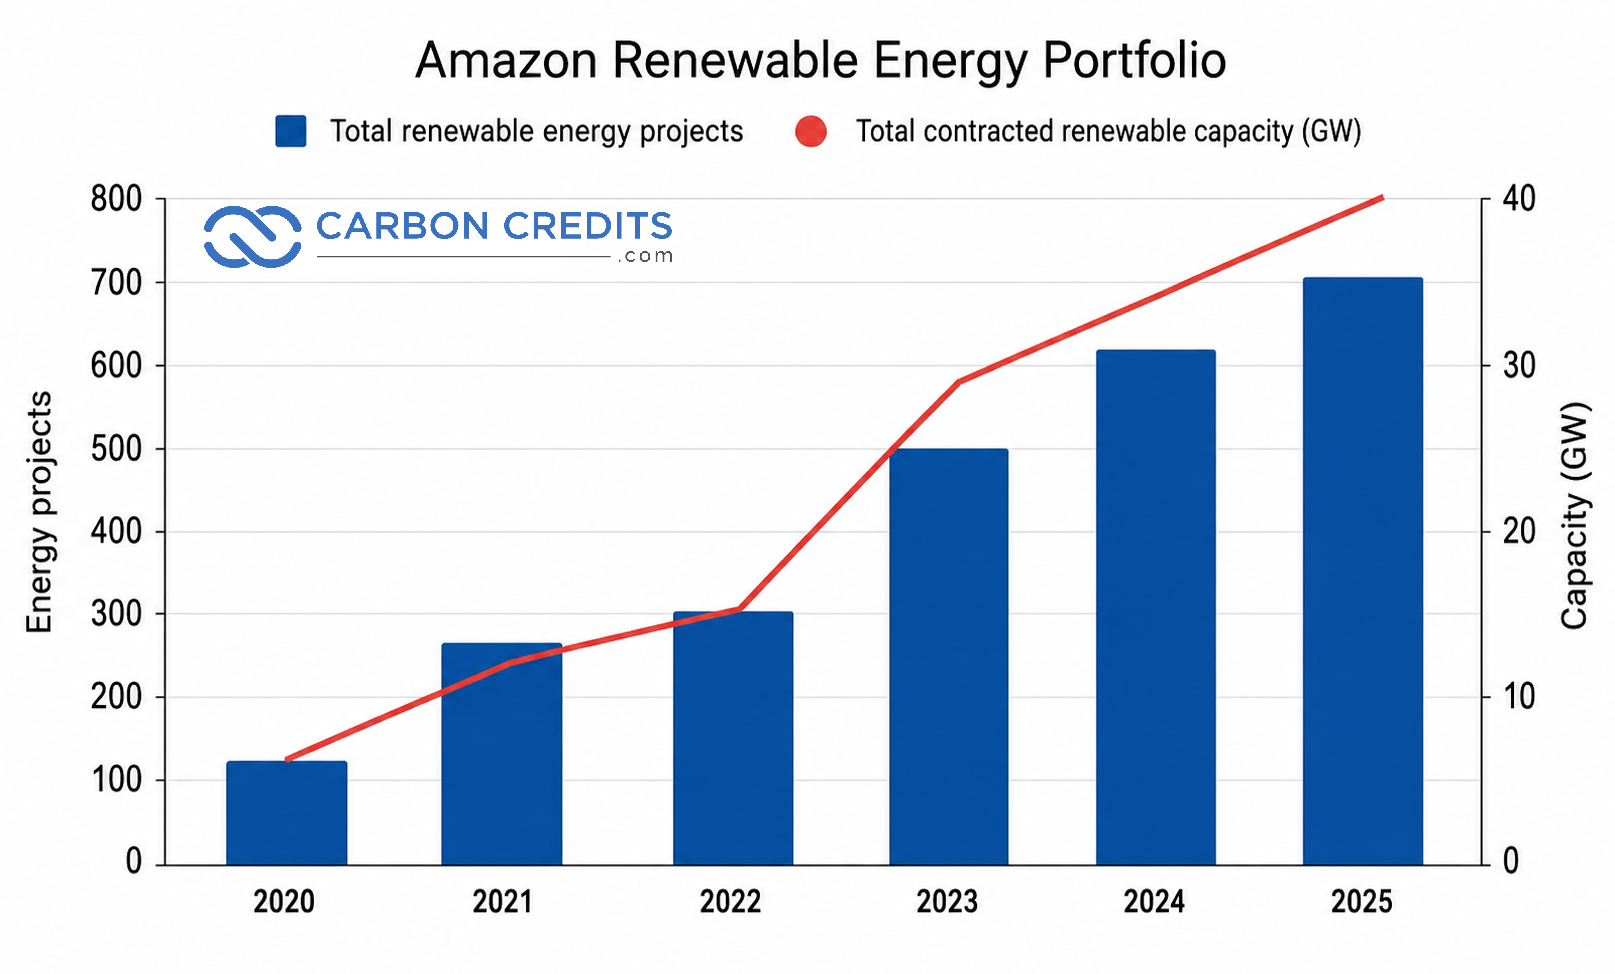
Amazon has also set a net-zero target for 2040 under its Climate Pledge. The company is one of the world’s largest corporate buyers of renewable energy and continues to invest heavily in clean power, logistics electrification, and low-carbon infrastructure.
Both companies argue that flexible accounting frameworks have supported these investments at scale.
The Bigger Challenge: Scope 3 and Digital Emissions
The debate over Scope 2 reporting is only part of a larger issue. For most large companies, Scope 3 emissions account for more than 70% of total emissions. These include supply chains, product use, and outsourced services.
In the technology sector, emissions are rising due to:
- Data centers,
- Cloud computing, and
- Artificial intelligence workloads.
Global data centers already consume about 415–460 terawatt-hours (TWh) of electricity per year, equal to roughly 1.5%–2% of global power demand. This figure is expected to increase sharply. The International Energy Agency estimates that data center electricity demand could double by 2030, driven largely by AI.
This creates a major reporting challenge. Even with cleaner electricity, total emissions can rise as digital demand grows.
Climate Reporting Rules Are Tightening Globally
The pushback comes as climate disclosure requirements are expanding and becoming more standardized across major economies. What was once voluntary ESG reporting is steadily shifting toward mandatory, audit-ready climate transparency.
In the European Union, the Corporate Sustainability Reporting Directive (CSRD) is now active. It requires large companies and, later, listed SMEs, to share detailed sustainability data. This data must match the European Sustainability Reporting Standards (ESRS). This includes granular reporting on emissions across Scope 1, 2, and increasingly Scope 3 value chains.
In the United States, the Securities and Exchange Commission (SEC) aims for mandatory climate-related disclosures for public companies. This includes governance, risk exposure, and emissions reporting. However, some parts of the rule face legal and political scrutiny.
The United Kingdom has included climate disclosure through TCFD requirements. Now, it is moving toward ISSB-based global standards to make comparisons easier. Similarly, Canada is progressing with ISSB-aligned mandatory reporting frameworks for large public issuers.
In Asia, momentum is also accelerating. Japan is introducing the Sustainability Standards Board of Japan (SSBJ) rules that match ISSB standards. Meanwhile, China is tightening ESG disclosure rules for listed companies through updates from its securities regulators. Singapore has also mandated climate reporting for listed companies, with phased Scope 3 expansion.
A clear trend is forming across jurisdictions: climate disclosure is aligning with ISSB global standards. There’s a growing focus on assurance, comparability, and transparency in value-chain emissions.
This regulatory tightening raises the bar significantly for corporations. The challenge is clear. Companies must:
- Align with multiple evolving disclosure regimes,
- Ensure emissions data is verifiable and auditable, and
- Expand reporting across complex global supply chains.
Balancing operational growth with compliance is becoming increasingly complex as climate regulation converges and intensifies worldwide.
A Turning Point for Global Carbon Accounting
The outcome of this debate could shape global carbon accounting standards for years.
If stricter rules are adopted, emissions reporting will become more precise. This could improve transparency and reduce greenwashing risks. However, it may also increase compliance costs and limit flexibility.
If the proposed changes remain optional, companies may continue using current accounting methods. This could support faster clean energy investment, but may leave gaps in reporting accuracy.
The new rules could take effect as early as next year, making this a near-term decision for global companies.
The push by Apple, Amazon, and other companies highlights a key tension in climate strategy. On one side is the need for accurate, real-time emissions reporting. On the other is the need for flexible systems that support large-scale clean energy investment.
As digital infrastructure expands and energy demand rises, how emissions are measured will matter as much as how they are reduced. The next phase of climate action will depend not just on targets—but on the systems used to track them.
The post Apple, Amazon Lead 60+ Firms to Ease Global Carbon Reporting Rules appeared first on Carbon Credits.
Carbon Footprint
Mastercard Beats 2025 Emissions Targets as Revenue Rises 16%, Breaking the Growth vs Carbon Trade-Off

Mastercard says it has exceeded its 2025 emissions reduction targets while continuing to grow its global business. The company reduced emissions across its operations even as revenue increased strongly in 2025.
The update comes from Mastercard’s official sustainability and technology disclosure published in 2026. It confirms progress toward its long-term goal of net-zero emissions by 2040, covering its full value chain.
The results are important for the financial technology sector. Digital payments depend heavily on data centers and cloud systems, which are energy-intensive and linked to rising global emissions.
Breaking the Pattern: Emissions Fall While Revenue Rises
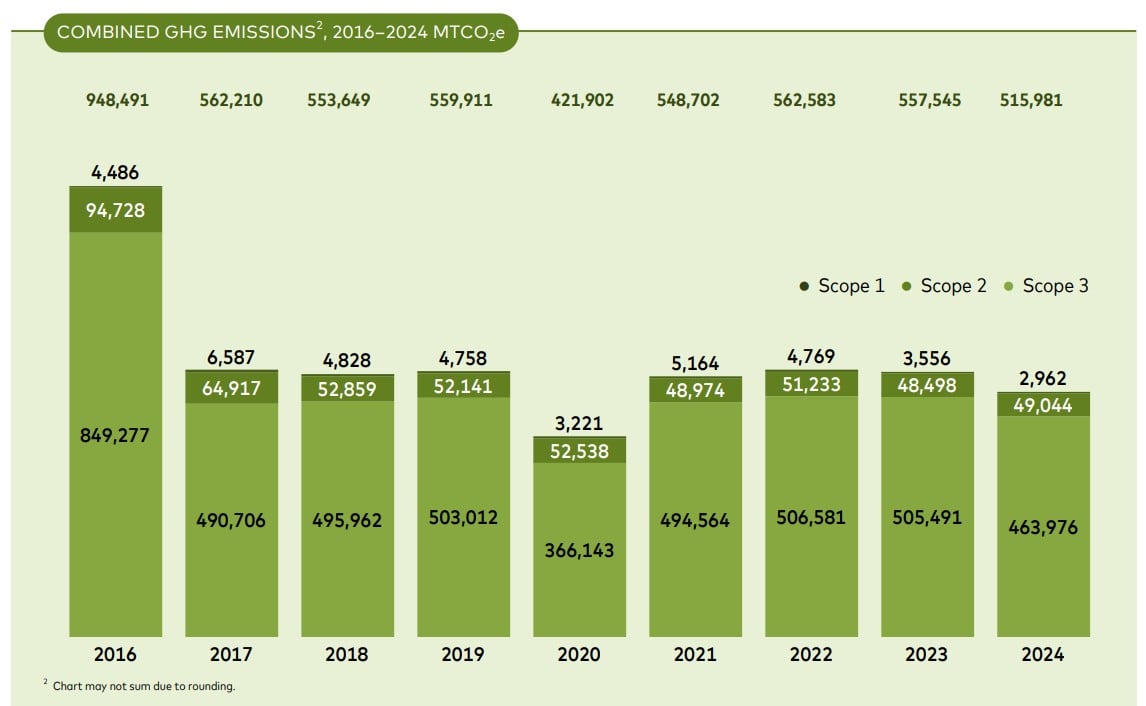
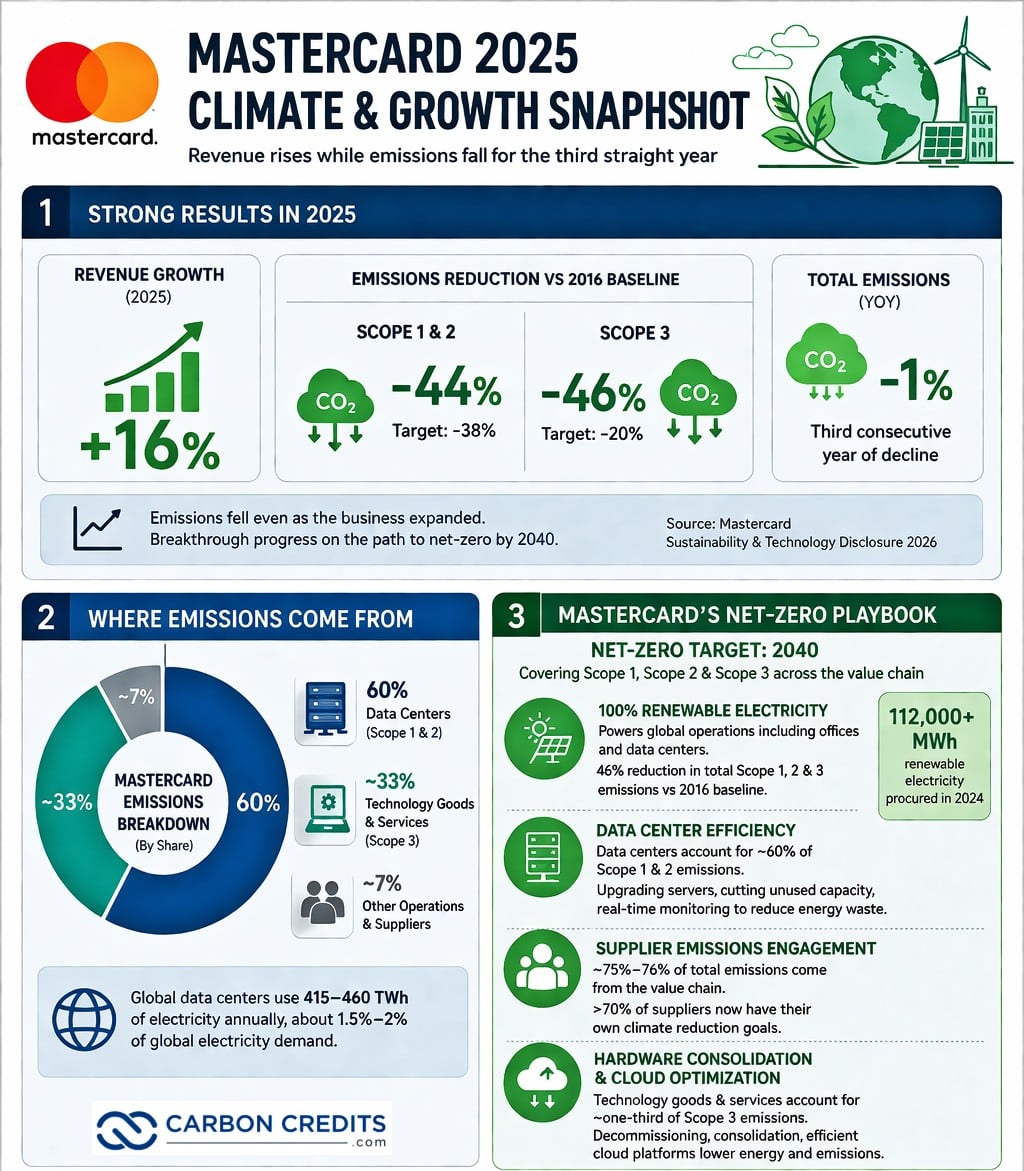
In 2025, Mastercard surpassed its interim climate targets compared with a 2016 baseline. The company reported a 44% reduction in Scope 1 and Scope 2 emissions, beating its target of 38%. It also achieved a 46% reduction in Scope 3 emissions, far exceeding its 20% target.
At the same time, Mastercard recorded 16% revenue growth in 2025. This shows that emissions reductions continued even as the business expanded. Mastercard Chief Sustainability Officer Ellen Jackowski and Senior Vice President of Data and Governance Adam Tenzer wrote:
“These results reflect a comprehensive approach built on renewable energy investment and procurement, supply chain engagement, and embedding environmental sustainability into everyday business decisions.”
The company also reported a 1% year-on-year decline in total emissions, marking the third consecutive year of emissions reduction. This is important because digital payment networks usually grow with higher computing demand.
Mastercard says this trend reflects improved efficiency across its operations, better infrastructure use, and increased reliance on cleaner energy sources.
The Hidden Footprint: Why Data Centers Drive Mastercard’s Emissions
A large share of Mastercard’s emissions comes from its digital infrastructure. According to the company’s sustainability report, data centers account for about 60% of Scope 1 and Scope 2 emissions. Technology-related goods and services make up roughly one-third of Scope 3 emissions.
This reflects how modern financial systems operate. Digital payments, fraud detection, and AI-based analytics require a large-scale computing infrastructure.
Global data centers already consume about 415–460 TWh of electricity per year, equal to roughly 1.5%–2% of global electricity demand. This number is expected to rise as AI usage expands.
Mastercard’s challenge is similar to that of other digital companies. Higher transaction volume usually leads to greater computing needs. This can raise emissions unless we improve efficiency.
To manage this, the company is focusing on renewable energy procurement, hardware consolidation, and more efficient software systems.
Carbon-Aware Technology Becomes Core to Operations
Mastercard is integrating sustainability directly into its technology systems rather than treating it as a separate reporting function. Since 2023, the company has developed a patent-pending system that assigns a Sustainability Score to its technology infrastructure. This system measures environmental impact in real time.
It tracks factors such as:
- Energy use in kilowatt-hours,
- Regional carbon intensity of electricity,
- Server utilization rates,
- Hardware lifecycle efficiency, and
- Data processing location.
This allows engineers to design systems with lower carbon impact.
The company also uses carbon-aware software design. This means computing workloads can be adjusted to reduce energy use when carbon intensity is high in certain regions.
This approach reflects a wider trend in the technology and financial sectors. More companies are now including carbon tracking in their main infrastructure choices. They no longer see it just as a reporting task.
Powering Payments: Mastercard’s Net-Zero Playbook
Mastercard has committed to reaching net-zero emissions by 2040, covering Scope 1, Scope 2, and Scope 3 emissions across its value chain. The target is aligned with science-based climate pathways and includes operations, suppliers, and technology infrastructure.
To achieve this, the company is focusing on four main areas.
-
Increasing renewable energy use in operations
Mastercard already powers its global operations with 100% renewable electricity. This covers offices and data centers in multiple regions.
The company has also achieved a 46% reduction in total Scope 1, 2, and 3 emissions compared to its 2016 baseline. It continues to use renewable energy purchasing to maintain this progress.
In 2024, Mastercard procured over 112,000 MWh of renewable electricity, supporting lower emissions from its global operations.
-
Improving energy efficiency in data centers
Data centers account for about 60% of Mastercard’s Scope 1 and 2 emissions. To reduce this, Mastercard is upgrading servers, cutting unused computing capacity, and improving workload efficiency. It also uses real-time monitoring to reduce energy waste.
These improvements helped keep operational emissions stable in 2024, even as computing demand increased. Efficiency gains combined with renewable energy use supported this outcome.
-
Working with suppliers to reduce emissions
Around 75%–76% of Mastercard’s total emissions come from its value chain. This includes cloud providers, technology partners, and hardware suppliers.
To address this, Mastercard works with suppliers to set emissions targets and improve reporting. More than 70% of its suppliers now have their own climate reduction goals.
-
Upgrading and consolidating hardware systems
Mastercard is reducing emissions by improving its hardware systems. It decommissions unused servers, consolidates infrastructure, and shifts to more efficient cloud platforms.
Technology goods and services account for about one-third of Scope 3 emissions. By reducing unnecessary hardware and extending equipment life, Mastercard lowers both energy use and manufacturing-related emissions while maintaining system performance.
Renewable energy procurement is central to its strategy. It’s crucial for powering data centers, as they account for most of their operational emissions.
Mastercard works with suppliers because a large part of emissions comes from the value chain. This includes technology manufacturing and cloud services. By 2025, the company exceeded several short-term climate goals. This shows early progress on its long-term net-zero path.
ESG Pressure Hits Fintech: The New Rules of Digital Finance
Mastercard’s results come during a period of rising ESG pressure across the financial sector. Banks, payment networks, and fintech companies must now disclose emissions. This is especially true for Scope 3 emissions, which cover supply chain and digital infrastructure impacts.
Several global trends are shaping the industry:
- Growing regulatory focus on climate disclosure,
- Rising investor demand for ESG transparency,
- Expansion of digital payments and cloud computing, and
- Increased energy use from AI and data processing.
Data centers are becoming a major focus area because they link financial services to energy consumption. In Mastercard’s case, they are the largest source of operational emissions.
At the same time, financial institutions are expected to align with net-zero targets between 2040 and 2050. This depends on regional regulations and climate frameworks. Mastercard’s early progress places it ahead of many peers in meeting short-term emissions goals.
Decoupling Growth From Emissions
One of the most important signals from Mastercard’s 2025 results is the separation of business growth from emissions.
The company achieved 16% revenue growth while reducing total emissions by 1% year-on-year. This marks a continued pattern of emissions decline alongside business expansion.
Mastercard attributes this to improved system efficiency, renewable energy use, and better infrastructure management. In simple terms, the company is processing more transactions without a matching rise in emissions.
This trend is important because digital payment systems normally scale with computing demand. Without efficiency gains, emissions would typically rise with business growth.
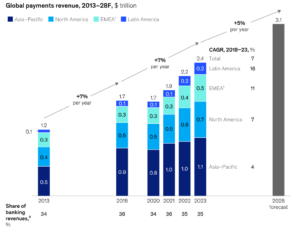
Looking ahead, demand will continue to grow. Global payments revenue is projected to reach around $3.1 trillion by 2028, according to McKinsey & Company, growing at close to 10% annually.
Global data center electricity demand might double by 2030. This rise is mainly due to AI workloads, says the International Energy Agency. Mastercard’s results show that tech upgrades can lower the carbon impact of digital finance. This is true even as global usage rises.
The Takeaway: Fintech’s Proof That Growth and Emissions Can Split
Mastercard’s 2025 sustainability performance shows measurable progress toward its net-zero goal. At the same time, major challenges remain. Data centers continue to be the largest emissions source, and global digital activity is still expanding rapidly due to AI and cloud computing.
Mastercard’s approach shows how financial technology companies are adapting. Sustainability is no longer a separate goal. It is becoming part of how digital systems are designed and operated.
The next test will be whether these efficiency gains can continue to outpace the rapid growth of global digital payments and AI-driven financial systems.
The post Mastercard Beats 2025 Emissions Targets as Revenue Rises 16%, Breaking the Growth vs Carbon Trade-Off appeared first on Carbon Credits.

China is backing a Beijing-based startup called Orbital Chenguang with about 57.7 billion yuan ($8.4 billion) in credit lines to build space-based data centers, according to media reports. The funding comes from major state-linked banks and signals one of the largest known investments in orbital computing infrastructure.
The move highlights a growing global race to build computing systems in space. It also puts China in direct competition with companies like SpaceX, which is exploring space-based data infrastructure, too.
Orbital Chenguang Builds State-Backed Space Computing System
Orbital Chenguang is a startup in Beijing supported by the Beijing Astro-future Institute of Space Technology. This institute works with the city’s science and technology authorities.
The company has received credit line support from major Chinese financial institutions, including:
- Bank of China,
- Agricultural Bank of China,
- Bank of Communications,
- Shanghai Pudong Development Bank, and
- CITIC Bank.
These are credit lines, not fully deployed cash. But the scale shows strong institutional backing.
The project is part of a wider national strategy focused on commercial space, AI infrastructure, and advanced computing systems.
China’s state space contractor, CASC (China Aerospace Science and Technology Corporation), has shared plans under its 15th Five-Year Plan. These include ideas for large-scale space computing systems, aiming for gigawatt power.
Space Data Center Plan Targets 2035 Gigawatt Capacity
According to Chinese media reports, Orbital Chenguang plans to build a constellation in a dawn-dusk sun-synchronous orbit at 700–800 km altitude. The long-term target is a gigawatt-scale space data center by 2035.
The development plan is divided into phases:
- 2025–2027: Launch early computing satellites and solve technical barriers.
- 2028–2030: Link space-based systems with Earth-based data centers.
- 2030–2035: Scale toward large orbital computing infrastructure.
The design relies on continuous solar energy and natural cooling in space. These features could reduce reliance on land-based power grids and cooling systems.
China has proposed two satellite constellations to the International Telecommunication Union (ITU). These plans include a total of 96,714 satellites. This shows China’s long-term goals for space infrastructure and spectrum control.
The AI Energy Crunch Pushing Computing Into Orbit
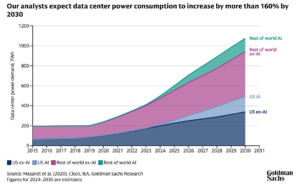
The push into orbital data centers is closely linked to rising AI demand. Global data centers consumed about 415–460 terawatt-hours (TWh) of electricity in 2024, equal to roughly 1.5%–2% of global power use. This figure is rising quickly due to AI workloads.
Some industry projections show demand could exceed 1,000 TWh by 2026, nearly equal to Japan’s total electricity consumption.
AI systems require massive computing power, which increases energy use and cooling needs. In many regions, electricity supply—not hardware—is now the main constraint on AI expansion.
China’s strategy aims to address this by moving part of the computing load into space, where solar energy is more stable and continuous.
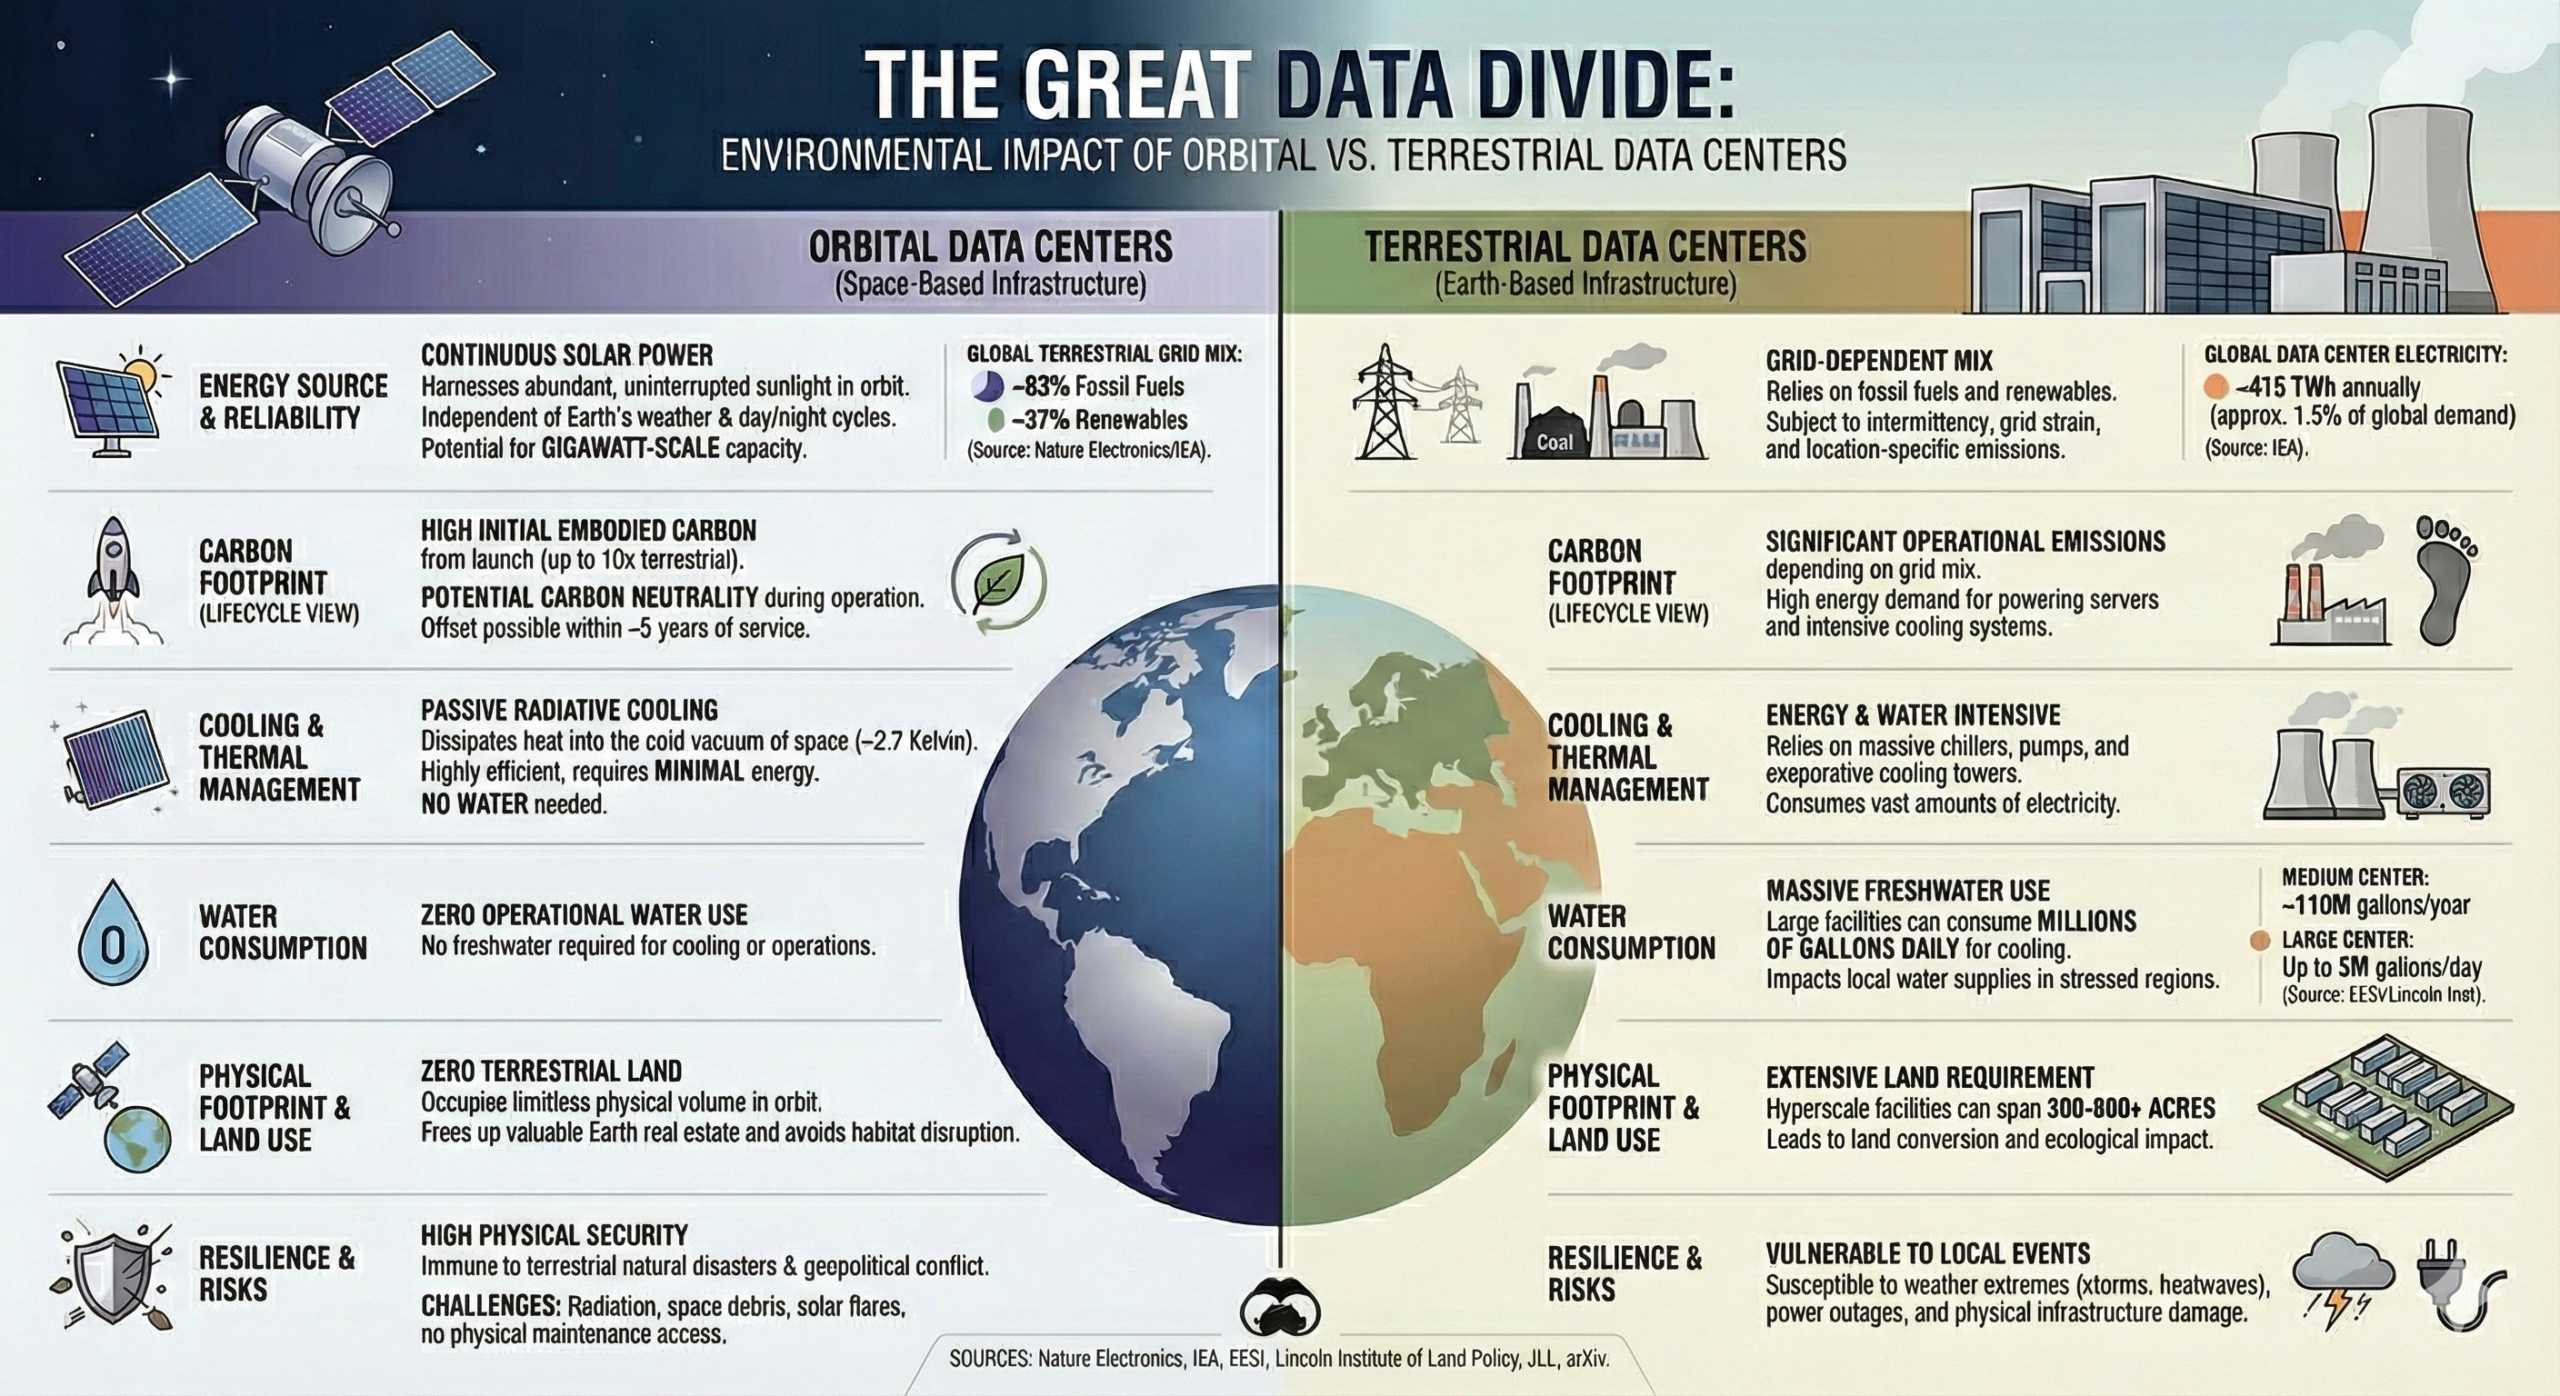
Carbon Impact: Earth vs Space Computing Trade-Off
Data centers already create a large carbon footprint. In 2024, they emitted about 182 million tonnes of CO₂, based on global electricity use of roughly 460 TWh and an average carbon intensity of 396 grams of CO₂ per kWh. This is according to the International Energy Agency report, as shown in the chart below.
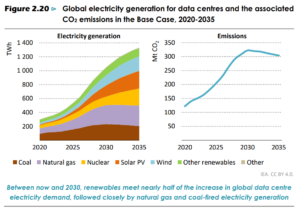
Future projections show even faster growth. The sector could generate up to 2.5 billion tonnes of CO₂ emissions by 2030, driven by AI expansion. This is where orbital systems come in. They aim to reduce emissions during operation by using:
- Continuous solar energy,
- Passive cooling in vacuum conditions, and
- Reduced dependence on fossil-fuel grids.
However, space systems also introduce new emissions. Rocket launches used about 63,000 tonnes of propellant in 2022, producing CO₂ and atmospheric pollutants. Lifecycle studies suggest that over 70% of emissions from space systems typically come from manufacturing and launch activities.
In addition, hardware in orbit often has a lifespan of only 5–6 years, which increases replacement cycles and launch frequency. This creates a key trade-off:
- Lower operational emissions in space, and
- Higher lifecycle emissions from launches and manufacturing.
Research suggests that, in some scenarios, orbital computing could produce up to 10 times higher total carbon emissions than terrestrial systems when full lifecycle impacts are included.
China’s Expanding Space-Tech Ecosystem
Orbital Chenguang is not operating alone. Several Chinese companies are working on similar in-orbit computing systems, including ADA Space, Zhejiang Lab, Shanghai Bailing Aerospace, and Zhongke Tiansuan.
These firms are developing satellite-based computing and AI processing systems. This shows that orbital computing is not a single project. It is part of a broader national push across government, industry, and research institutions.
China’s space strategy combines commercial space growth with national technology planning. It aims to build integrated systems that connect satellites, cloud computing, and terrestrial networks.
The Space-AI Arms Race: China vs SpaceX vs Google
China is not alone in exploring space-based computing. Companies in the United States are also developing orbital data infrastructure concepts. These include early-stage research and private sector projects by firms such as SpaceX and Google.
However, these systems face major challenges:
- High launch costs,
- Heat and thermal control issues,
- Limited data transmission bandwidth, and
- Hardware durability in space.
Despite these challenges, interest is growing because AI demand is rising faster than Earth-based infrastructure can scale. The competition is now moving toward who can solve energy and computing limits first—on Earth or in space.
Market Outlook: AI, Energy, and Space Infrastructure Converge
The global data center industry is entering a period of rapid expansion. Electricity demand from data centers could double by 2030, driven mainly by AI workloads and cloud computing growth. Power supply is becoming a limiting factor in many regions.
At the same time, the global space economy is expanding into a multi-hundred-billion-dollar industry, supported by satellites, communications, and emerging technologies like orbital computing.
- Orbital data centers sit at the intersection of three major trends: rapid AI growth, rising energy constraints, and expansion of space infrastructure.
China’s $8.4 billion credit-backed push through Orbital Chenguang signals confidence in this convergence. However, key barriers remain, such as high cost of launches, engineering complexity, short satellite lifespans (5-6 years), and regulatory uncertainty in orbital systems.
Because of these limits, orbital data centers are unlikely to replace Earth-based systems in the near term. Instead, they may form a hybrid system where some workloads move to space while most remain on Earth.
Space Is Becoming the Next Data Center Frontier
China’s investment in Orbital Chenguang marks one of the most significant moves yet in the emerging field of space-based computing. Backed by major Chinese banks, municipal science institutions, and national space contractors like CASC, the project shows how seriously China is treating orbital infrastructure.
The strategy connects AI growth, energy demand, and climate pressures into a single long-term vision. But the trade-offs are complex. Orbital data centers may reduce operational emissions, but they also introduce high lifecycle carbon costs and major technical challenges.
The global race is now underway. With companies like SpaceX, Google, and Chinese tech firms exploring similar ideas, space is becoming a new frontier for digital infrastructure. The outcome will depend on whether orbital systems can scale efficiently—and whether their carbon benefits can outweigh the emissions cost of building them.
The post China’s $8.4B Orbital Data Center Push Sets Up Space-Based AI Showdown With SpaceX appeared first on Carbon Credits.


-
Greenhouse Gases9 months ago
Guest post: Why China is still building new coal – and when it might stop
-
Climate Change9 months ago
Guest post: Why China is still building new coal – and when it might stop
-

 Greenhouse Gases2 years ago
嘉宾来稿:满足中国增长的用电需求 光伏加储能“比新建煤电更实惠”
-
Climate Change2 years ago
Bill Discounting Climate Change in Florida’s Energy Policy Awaits DeSantis’ Approval
-

 Climate Change2 years ago
嘉宾来稿:满足中国增长的用电需求 光伏加储能“比新建煤电更实惠”
-

 Renewable Energy6 months ago
Sending Progressive Philanthropist George Soros to Prison?
-

 Carbon Footprint2 years ago
US SEC’s Climate Disclosure Rules Spur Renewed Interest in Carbon Credits
-
Renewable Energy2 years ago
GAF Energy Completes Construction of Second Manufacturing Facility