

A study by KnowHost revealed that Virginia’s data centers are under scrutiny for their significant environmental impact. With over 400 data centers in the state, these facilities emit nearly 200 tons of CO2 equivalent per megawatt-hour (MWh) of energy produced. As the demand for data centers continues to grow, especially with the rise of AI and cloud computing, concerns about their carbon footprint have intensified. This issue is particularly pressing in Virginia, where data center investments continue to rise. The increase in carbon emissions has raised questions about sustainability and the ability of the energy grid to handle this growth.
AI Boom Could Triple Data Center CO2 Emissions
Data centers are essential for powering the tech industry, processing, storing, and distributing vast amounts of information. As companies increasingly rely on AI and other advanced technologies, the need for more data centers is expected to soar. According to research from Goldman Sachs, demand for these facilities could jump by 160% by 2030. However, this rise also means an increase in power and environmental impact.
 The report warns that as generative AI becomes more popular, data centers may produce three times their current CO2 emissions. In addition to high carbon output, data centers consume large amounts of water for cooling, escalating environmental concerns. Water usage has risen by two-thirds since 2019 in areas heavily populated with data centers.
Virginia Tops the List for Data Center Carbon Emissions in the US
Research from KnownHost has identified Virginia as the state with the highest carbon intensity for its data centers.
-
The state houses 473 data centers, including 24 hyperscale centers and 449 colocation centers, which host servers for multiple companies.
With 70% of the world’s data centers located in Virginia, the state has seen a surge in investment. Yet, this growth comes at a cost. The study found that these centers emit nearly 200 tons of CO2 equivalent per MWh, making Virginia the worst in the U.S. for carbon intensity in data centers.
To understand the scale of these emissions, one MWh of energy produced by Virginia’s data centers releases the same amount of CO2 as 43 cars driven for an entire year. Despite the environmental concerns, investments continue to flood in. Recently, Google announced a $1 billion expansion of its data center in Reston, Virginia, further fueling the state’s data center boom.

Other High-Emission States
Following Virginia, Texas ranks second in carbon emissions from its data centers. The state operates 278 data centers, including four internal centers, 266 colocation centers, and eight hyperscale facilities. These data centers collectively emit 117 tons of CO2 equivalent per MWh. Investment in Texas’ data centers is expected to continue, with companies like Microsoft and DataBank planning significant expansions.
California, with 277 data centers, takes third place, emitting 116 tons of CO2 equivalent per MWh. Although California has one fewer data center than Texas, its emissions per workload are slightly higher. The massive energy consumption by data centers in California has raised concerns about the state’s power grid. In Santa Clara, 60% of the city’s energy is consumed by data centers, sparking fears of potential blackouts.
Ohio and Illinois round out the top five states for data center emissions, with Ohio emitting 65 tons of CO2 equivalent per MWh from its 156 data centers, and Illinois emitting 63 tons from 151 centers. These states have a high concentration of tech industry operations, further intensifying their environmental impact.
Check out the complete list here: Which Data Centers Produce the Most CO2 per MWh
States with Lower Carbon Emissions
States like Alaska, Montana, and Vermont are on the opposite end of the spectrum. These states have far fewer data centers and a lower-tech industry presence. Alaska, for example, has only two colocation centers, emitting just 0.84 tons of CO2 equivalent per MWh. A focus on renewable energy has helped mitigate Alaska’s emissions. One new data center in the state operates entirely on hydropower, offering a less carbon-intensive model for the industry.
Montana and Vermont follow closely, each with three colocation data centers and 1.26 tons of CO2 equivalent emissions per MWh. While the number of data centers is small in these states, there is growing concern that data center capacity in the Northwest, which includes Montana, Idaho, Oregon, and Washington, could surpass 4,000 MW by 2030. This projection highlights the need for increased investment in renewable energy to avoid energy shortages and reduce emissions.
As the tech industry continues to expand, the environmental impact of data centers is becoming more significant. Addressing carbon emissions and energy consumption will be critical to ensuring that the growth of data centers does not come at the expense of sustainability.
Disclaimer: Content disseminated for KnowHost
- FURTHER READING: The Carbon Countdown: AI and Its 10 Billion Rise in Power Use
The post Top 5 US States with Most Data Center Emissions: Reveals KnownHost Research appeared first on Carbon Credits.
Carbon Footprint
Microsoft Hits Pause on All Carbon Removal Purchases: A Major Shift in Corporate Climate Strategy

Microsoft has temporarily halted all new carbon removal purchases as it reviews its broader climate strategy. The move affects direct air capture, biochar, and other engineered carbon removal solutions supported by its $1 billion Climate Innovation Fund, launched in 2020. It could delay hundreds of millions of dollars in planned investments across the carbon removal sector.
The pause was first reported by Heatmap News, in which a company spokesperson said that Microsoft is not indefinitely halting all of its purchases. Rather, she stated:
“We continually review and assess our carbon removal portfolio along with market conditions for the optimal balance on our path to carbon negative.”
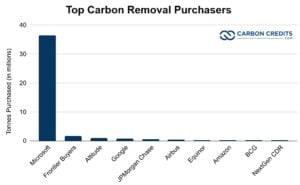
Microsoft has been one of the largest corporate buyers of high-quality carbon removal credits. Its decision signals a shift in how major companies evaluate carbon offsets and removal technologies.
The review focuses on whether current solutions can deliver reliable, long-term emissions reductions at scale. It also reflects growing scrutiny of corporate net-zero claims from regulators, investors, and climate groups.
Impact on Carbon Removal Market Pricing
Microsoft’s pause is expected to have an immediate impact on the voluntary carbon market (VCM). The company has played a leading role in scaling demand for engineered carbon removal credits.
These credits are more expensive than traditional offsets. Microsoft has typically paid between $100 and $600 per metric ton of CO₂ removed, compared with $5 to $15 per ton for many nature-based or avoidance credits.
Industry estimates suggest that Microsoft’s pause could significantly reduce demand in the engineered carbon removal market. The tech giant has accounted for as much as 80% to 90% of global purchases of carbon removals, as data from CDR.fyi shows below.
Several suppliers are directly exposed. Companies such as Climeworks and Carbon Engineering have signed multi-year agreements with Microsoft worth a combined $200 million to $300 million. These deals helped fund the early deployment of direct air capture facilities.
The broader voluntary carbon market has already seen price pressure. According to the Ecosystem Marketplace, average prices for carbon credits vary widely depending on quality. Premium removal credits trade at a steep premium due to limited supply and higher verification standards.
Microsoft’s exit, even if temporary, may accelerate a correction in these high prices. It may also reduce near-term funding for early-stage carbon removal technologies.
Microsoft’s Net-Zero Targets Face a Reality Check
Microsoft has some of the most ambitious climate goals in the corporate sector. The company aims to become carbon negative by 2030 and remove all the carbon it has emitted since its founding by 2050.
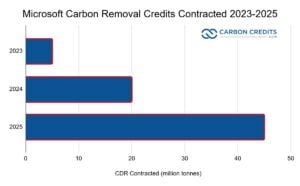
To support this, the tech giant has committed significant capital to carbon removal. By 2025, it had invested more than $750 million in carbon removal projects and contracted roughly 45 million tonnes of removals.
The current review is examining whether these investments can scale fast enough to meet long-term targets. Key concerns include:
- The permanence of carbon storage, especially for geological projects
- The high cost of engineered removal compared to direct emissions cuts
- The limited capacity of current technologies to deliver millions of tons annually
Many removal methods are still in early stages. Direct air capture, for example, currently removes only a small fraction of global emissions. The International Energy Agency estimates that global carbon removal capacity remains well below what is needed to meet net-zero scenarios by mid-century.
Microsoft is also reviewing how carbon removal fits into its broader decarbonization strategy. This includes aligning removal purchases with renewable energy investments and operational emissions reductions
SEE MORE:
- Microsoft Inks Biggest-Ever U.S. Biochar Deal with Liferaft
- Microsoft Buys 60,000 Soil Carbon Credits from Indigo’s Largest Carbon Crop
- Microsoft Strikes 2 Record-Breaking Carbon Credit Deals
Broader Big Tech Climate Strategy Shifts
Microsoft’s move reflects a broader shift across the technology sector. Other major companies, including Amazon, Meta, and Google, have slowed their carbon removal purchases in recent quarters.
Instead, many are focusing more on reducing emissions directly. This includes expanding renewable energy use, improving energy efficiency, and redesigning supply chains.
This trend aligns with updated guidance from the Science Based Targets initiative (SBTi). The SBTi emphasizes that companies should prioritize emissions reductions across Scope 1, 2, and 3 before relying on carbon removal.
Under this framework, carbon removal is treated as a solution for residual emissions that cannot be eliminated. This approach reduces reliance on offsets and increases pressure on companies to decarbonize core operations.
At the same time, regulatory scrutiny is increasing. In the United States, the U.S. Securities and Exchange Commission has proposed new climate disclosure rules. These rules would require companies to provide more detailed reporting on emissions and climate-related risks.
This is pushing companies to strengthen verification standards for carbon credits and avoid reputational risks linked to low-quality offsets.
A Turning Point for Carbon Removal Investment Models
Microsoft’s decision may signal a broader shift in how companies support carbon removal technologies. Instead of buying credits directly, some firms are exploring new funding models.
These include advance market commitments, where companies guarantee future demand, and direct investments in technology development. These approaches can provide more stable funding while reducing reliance on spot market purchases.
The technology sector has been a major driver of carbon removal demand. Since 2022, it has accounted for about 40% of high-quality removal credit purchases. Between 2020 and 2025, major tech companies committed billions of dollars to carbon removal initiatives.

If large buyers step back, developers may face funding gaps in the short term. However, this could also push the industry to improve cost efficiency and scalability.
Current removal costs remain high. Direct air capture can exceed $500 per ton, though companies aim to reduce this below $100 per ton over time. Achieving this will require technological advances, economies of scale, and supportive policy frameworks.
What It Means for Carbon Markets and Climate Goals
Microsoft’s pause marks a key moment for the VCM. It highlights the growing demand for higher standards, better verification, and clearer climate impact.
In the short term, the decision may slow growth in the premium carbon removal segment. Prices could soften, and some projects may face delays or funding challenges.
However, the long-term impact could be positive. Stronger scrutiny may lead to more reliable and transparent carbon removal solutions. This would help build trust in the market and attract new investment.
For companies, the message is clear. Net-zero strategies must focus first on reducing emissions. Carbon removal remains important, but it must be credible, scalable, and cost-effective.
For the carbon removal sector, the challenge is to prove that its technologies can deliver on these expectations. If successful, it will play a critical role in global climate efforts.
The International Energy Agency and other bodies have made it clear that carbon removal will be essential to achieving net-zero emissions by 2050. The question is not whether it is needed, but how fast it can scale.
As the sector evolves, companies that can deliver verified, permanent, and affordable carbon removal solutions are likely to lead the next phase of expansion.
The post Microsoft Hits Pause on All Carbon Removal Purchases: A Major Shift in Corporate Climate Strategy appeared first on Carbon Credits.
Carbon Footprint
Radisson Hotel Group Ramps Up Net Zero Push by 2030: How Does it Compare with Marriott and Accor?
Radisson Hotel Group has raised its climate ambition in the hospitality sector. The group now targets 100 verified net-zero hotels by 2030 across its global portfolio. This move builds on its existing science-based net zero commitment by 2050, approved under the Science Based Targets initiative (SBTi).
Radisson defines verified net-zero hotels as properties that cut operational emissions completely. This is done through energy transition and efficiency upgrades. while using limited offsets only for any remaining emissions.
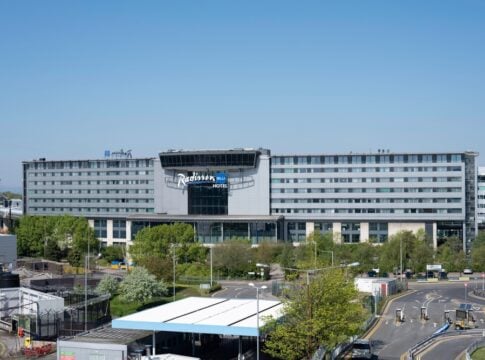
The company has already launched early examples of this model in Manchester (UK) and Oslo (Norway). These hotels were upgraded through full operational redesigns instead of new construction. The goal is to scale this approach across multiple regions and hotel types.
Radisson Hotel Group CEO Federico J. González Tejera remarked during the release:
“At Radisson Hotel Group, sustainability ultimately starts with people. It is about delivering for our guests, creating value for our owners, and supporting the communities where we operate. Verified Net Zero Hotels are an important step in our net zero transformation, setting a new standard for how hospitality can reduce its environmental impact while continuing to support people, destinations, and economic activity.”
How Net Zero Hotels Work in Practice
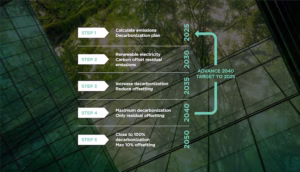
Radisson’s net zero model follows a structured decarbonization system developed with industry partners. It is designed to measure, reduce, and gradually eliminate emissions across hotel operations.
The process involves several steps:
- measuring carbon fully,
- switching to renewable electricity,
- electrifying heating and cooking, and
- upgrading efficiency in water, waste, and energy use.
Over time, the goal is to reduce reliance on carbon offsets and focus on real emissions cuts.
The Manchester and Oslo hotels show how this works in practice. Both properties switched to renewable electricity, removed fossil fuel systems, and added low-carbon changes. These include electrified kitchens and waste reduction programs.
Radisson says these pilot hotels cut emissions by about 60%. This shows that significant reductions are possible in existing buildings.
Big Targets, Real Progress: Radisson’s Carbon Cuts
Radisson has set measurable climate targets aligned with global climate frameworks. The company aims to reduce Scope 1 and Scope 2 emissions by 46% by 2030, compared with a 2019 baseline. It also targets a 28% reduction in Scope 3 emissions by 2030, which includes supply chain and outsourced activities.
The group has already made measurable progress. By 2023, Radisson achieved a 35% reduction in carbon footprint per square metre compared to 2019 levels. Over the past decade, it has also improved energy and water efficiency by around 30% across operations.
The company works in over 100 countries and manages more than 1,500 hotels. This makes its decarbonization effort one of the biggest in the global hospitality sector.
Industry Shift: Hotels Move Toward Low-Carbon Operations
The hotel industry is increasingly under pressure to reduce emissions. Hospitality is energy-intensive because of heating, cooling, laundry, food services, and continuous building operations.
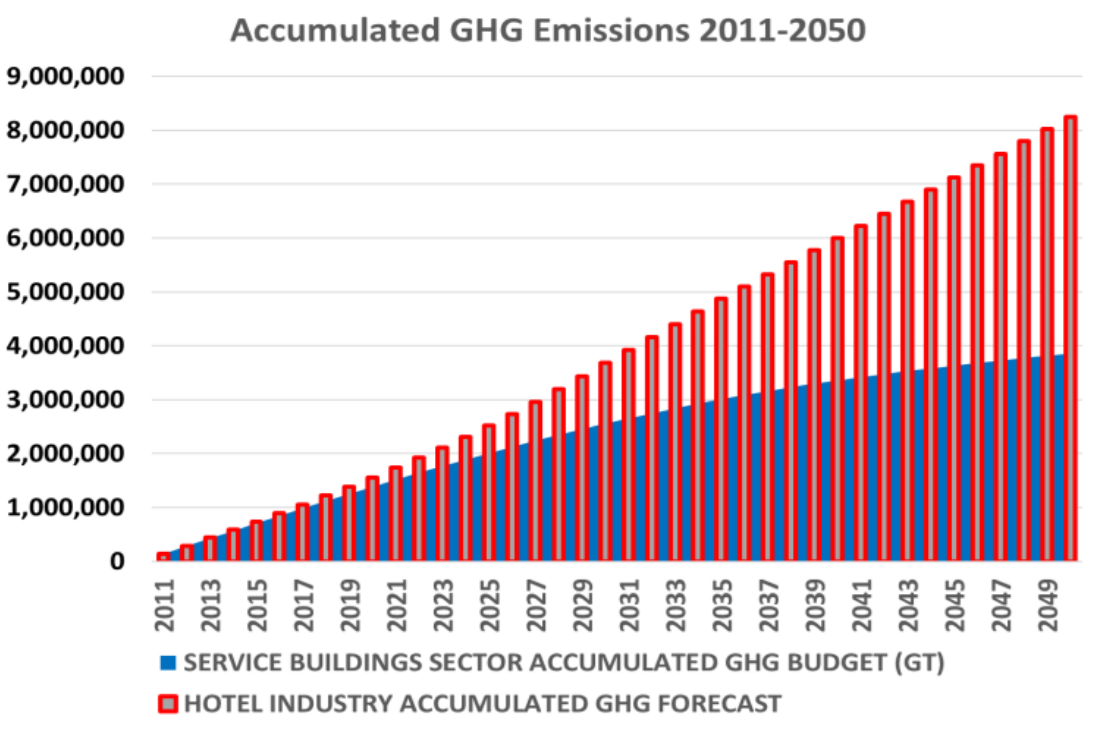
Hospitality accounts for ~1% of global carbon emissions and ~7.8% of water use worldwide. The sector’s energy intensity averages 200-800 kBtu/sq ft annually, with heating/cooling consuming 50-60% of total energy.
Emissions breakdown by source:
- Building energy: 60-70% (HVAC, lighting, hot water)
- Food/beverage supply chains: 20-25%
- Waste management: 10-15%
Hotels are now focusing on electrification and using renewable energy. They are also upgrading efficiency to cut their carbon footprint and journey toward net positive hospitality.
Radisson is joining a trend toward verified net-zero hotels. These hotels need to cut emissions and get third-party checks. This approach reduces uncertainty in sustainability claims and improves transparency for investors and customers.
Independent verification systems are now widely used to confirm emissions reductions. They help make sure that net zero claims are credible and comparable across the industry.
The standard third-party verification:
- Green Key/SGS: Verify WTTC Hotel Sustainability Basics (12 criteria)
- TÜV Rheinland: Certifies Radisson’s net zero hotels
- Cornell Hotel Sustainability Index: Benchmarks 1,307 global markets
The Net Zero Race in Hospitality: Radisson vs Marriott vs Accor
Radisson Hotel Group, Marriott International, and Accor Hotels all follow long-term net-zero goals. However, their timelines and strategies differ.
-
Radisson Hotel Group
Radisson Hotel Group aims for net zero across Scope 1, 2, and 3 emissions by 2050. It has a near-term target to cut Scope 1 and 2 emissions by 46.2% by 2030 (2019 base year) and reduce Scope 3 emissions by 27.5%.
Radisson has also launched “Verified Net Zero” hotels powered by 100% renewable electricity and low-waste operations. It is adding energy-saving upgrades. This includes LED lighting, smart heating and cooling systems, and building retrofits throughout its portfolio. It also pushes waste reduction programs, including food waste tracking and recycling systems in many hotels.
-
Marriott International
Marriott International also targets net zero across its value chain by 2050, with science-based approval. It plans to reduce Scope 1 and 2 emissions by 46.2% and Scope 3 emissions by 27.5% by 2030 (2019 baseline). It is investing in large-scale renewable electricity procurement through long-term power purchase agreements.
Marriott is also improving building efficiency with smart energy management systems across thousands of properties. Marriott is also promoting low-carbon supply chains. They are working with suppliers to reduce packaging and use more sustainable materials.
-
Accor
Accor also targets net zero by 2050, with a strong focus on operational efficiency and procurement reform. It is upgrading hotels with energy-efficient systems and expanding renewable electricity use across its brands.
Accor is also reducing food-related emissions by increasing plant-based menu options and cutting food waste. However, it provides less detailed interim emission reduction percentages than Radisson and Marriott. It focuses more on operational efficiency and engaging suppliers to make progress.
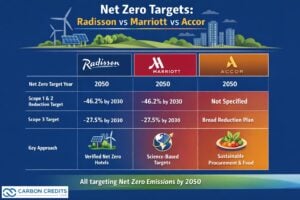
Overall, all three groups are moving toward net zero, but Radisson and Marriott show more defined short-term emissions targets. In contrast, Accor focuses more on operational changes and supply chain improvements.
ESG and Sustainable Hospitality: Green Travel Is No Longer Optional
Sustainability is becoming a stronger factor in travel decisions. More guests now prefer hotels that show clear environmental performance and use verified sustainability systems.
Corporate travel buyers are also adding ESG requirements to hotel contracts. This includes emissions reporting, renewable energy use, and waste reduction commitments. As a result, sustainability is becoming a competitive factor in hotel selection.
The global hospitality sector is adopting structured plans for decarbonization. This includes energy efficiency upgrades and using renewable electricity. Digital tracking of emissions is also becoming more common, especially for large hotel groups.
Radisson’s net-zero hotels are part of this shift. Sustainability-focused hotels can boost guest engagement and enhance brand positioning. This is backed by industry case studies. These strategies help hotels stand out in competitive markets.
The Hard Truth About Scaling Net Zero Hotels
Scaling net-zero hotels globally is complex. One major challenge is the cost of retrofitting existing buildings. Many hotels require major upgrades to heating, cooling, and kitchen systems to reduce emissions.
Another challenge is uneven access to renewable electricity across regions. Some markets still rely heavily on fossil fuels. This limits emissions reductions, even when hotels switch to cleaner operations.
Supply chain emissions also remain difficult to control. These include food sourcing, construction materials, and outsourced services. Tracking and reducing Scope 3 emissions requires coordination across many suppliers.
Finally, implementation varies by country due to differences in regulation, infrastructure, and energy systems. This creates uneven progress across global hotel portfolios.
Can Net Zero Become the New Hotel Standard?
Radisson’s plan to reach 100 net-zero hotels by 2030 marks a significant step in hospitality decarbonization. If achieved, it would create one of the largest verified net-zero hotel networks globally.
The strategy also supports its long-term goal of achieving net zero emissions across its entire value chain by 2050, aligned with global climate targets.
Future progress relies on quicker electrification of hotel operations, broader access to renewable energy, better ESG reporting, and ongoing investment in low-carbon technologies.
If done right, net-zero hotels could be the norm in global hospitality within the decade. This would change how hotels run and compete in international travel.
- READ MORE: The Net Zero Game: Are Hotels and Restaurants Truly Committed to Reducing Carbon Emissions?
The post Radisson Hotel Group Ramps Up Net Zero Push by 2030: How Does it Compare with Marriott and Accor? appeared first on Carbon Credits.
Carbon Footprint
Philippines Taps Blue Carbon and Biodiversity Credits to Protect Coasts and Climate

The Philippines is stepping up efforts to protect its coastal ecosystems. The government recently advanced its National Blue Carbon Action Partnership (NBCAP) Roadmap. This plan aims to conserve and restore mangroves, seagrass beds, and tidal marshes. It also explores biodiversity credits — a new market linked to nature conservation.
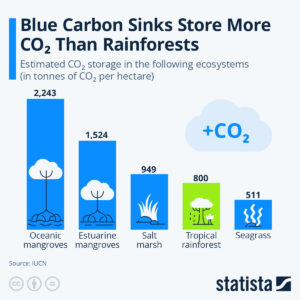
Blue carbon refers to the carbon stored in coastal and marine ecosystems. These habitats can hold large amounts of carbon in plants and soil. Mangroves, for example, store carbon at much higher rates than many land forests. Protecting them reduces greenhouse gases in the atmosphere.
Biodiversity credits are a related concept. They reward actions that protect or restore species and ecosystems. They work alongside carbon credits but focus more on ecosystem health and species diversity. Markets for biodiversity credits are being discussed globally as a complement to carbon markets.
Why the Philippines Is Targeting Blue Carbon
The Philippines is rich in coastal ecosystems. It has more than 327,000 hectares of mangroves along its shores. These areas protect coastlines from storms, support fisheries, and store carbon.
Mangroves and seagrasses also support high levels of biodiversity. Many fish, birds, and marine species depend on these habitats. Restoring these ecosystems helps conserve species and supports local food systems.
The NBCAP Roadmap was handed over to the Department of Environment and Natural Resources (DENR) during the Philippine Mangrove Conference 2026. The roadmap is a strategy to protect blue carbon ecosystems while linking them to climate goals and local livelihoods.
DENR Undersecretary, Atty. Analiza Rebuelta-Teh, remarked during the turnover:
“This Roadmap reflects the Philippines’ strong commitment to advancing blue carbon accounting and delivering tangible impact for coastal communities.”
Edwina Garchitorena, country director of ZSL Philippines, which will oversee its implementation, also commented:
“The handover of the NBCAP Roadmap to the DENR represents a turning point in advancing blue carbon action and strengthening the Philippines’ leadership in coastal conservation in the region.”
The plan highlights four main pillars:
- Science, technology, and innovation.
- Policy and governance.
- Communication and community engagement.
- Finance and sustainable livelihoods.
These pillars aim to strengthen coastal resilience, support community well‑being, and align blue carbon action with national climate commitments.
What Blue Carbon Credits Could Mean for Markets
Globally, blue carbon markets are growing. These markets allow coastal restoration projects to sell carbon credits. Projects that preserve or restore mangroves, seagrass meadows, and tidal marshes can generate credits. Buyers pay for these credits to offset emissions.
According to Grand View Research, the global blue carbon market was valued at US$2.42 million in 2025. It is projected to reach US$14.79 million by 2033, growing at a compound annual growth rate (CAGR) of almost 25%.
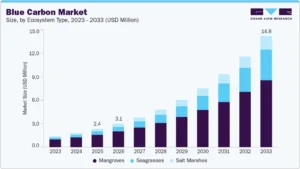
The Asia Pacific region led the market in 2025, with 39% of global revenue, due to its extensive coastal ecosystems and government support. Within the market, mangroves accounted for 68% of revenue, reflecting their high carbon storage capacity.
Blue carbon credits belong to the voluntary carbon market. Companies purchase these credits to offset emissions they can’t eliminate right now. Buyers are often motivated by sustainability goals and environmental, social, and corporate governance (ESG) standards.
Experts at the UN Environment Programme say these blue habitats can capture carbon 4x faster than forests:
Why Biodiversity Credits Matter: Rewarding Species, Strengthening Ecosystems
Carbon credits aim to cut greenhouse gases. In contrast, biodiversity credits focus on saving species and habitats. These credits reward projects that improve ecosystem health and may be used alongside carbon markets to attract finance for nature.
Biodiversity credits are particularly relevant in the Philippines, one of 17 megadiverse countries. The nation is home to thousands of unique plant and animal species. Supporting biodiversity through market mechanisms can strengthen conservation efforts while also supporting local communities.
Globally, biodiversity credit markets are still developing. Organizations such as the Biodiversity Credit Alliance are creating standards to ensure transparency, equity, and measurable outcomes. They want to link private investment to good environmental outcomes. They also respect the rights of local communities and indigenous peoples.
These markets complement carbon markets. They can support conservation efforts. This boosts ecosystem resilience and protects species while also capturing carbon.
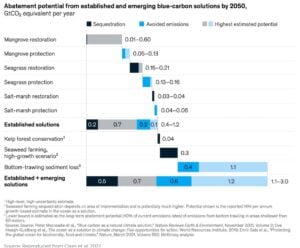
Together with blue carbon credits, they form part of a broader nature-based solution to climate change and biodiversity loss. A report by the Ecosystem Marketplace estimates the potential carbon abatement for every type of blue carbon solution by 2050.
Science, Policy, and Funding: The Roadblocks Ahead
Building blue carbon and biodiversity credit markets is not easy. There are several challenges ahead for the Philippines.
One key challenge is measurement and verification. To sell carbon or biodiversity credits, projects must prove they deliver real and measurable benefits. This requires science‑based methods and monitoring systems.
Another challenge is finance. Case studies reveal that creating a blue carbon action roadmap in the Philippines may need around US$1 million. This funding will help set up essential systems and support initial actions.
Policy frameworks are also needed. Laws and rules must support credit issuance, protect local rights, and ensure fair sharing of benefits. Coordination across government agencies, local communities, and investors will be important.
Stakeholder engagement is key. The NBCAP Roadmap and related forums involve scientists, policymakers, civil society, and private sector partners. This teamwork approach makes sure actions are based on science, inclusive, and fair in the long run.
Looking Ahead: Coastal Conservation as Climate Strategy
Blue carbon and biodiversity credits could provide multiple benefits for the Philippines. Protecting and restoring coastal habitats reduces greenhouse gases, conserves species, and supports local economies. Coastal ecosystems also provide natural defenses against storms and rising seas.
If blue carbon and biodiversity credit markets grow, they could fund coastal conservation at scale while supporting global climate targets. Biodiversity credits could further enhance ecosystem protection by linking nature’s intrinsic value to market mechanisms.
The market also involves climate finance and corporate buyers looking for quality credits. Additionally, international development partners focused on coastal resilience may join in.
For the Philippines, the next few years will be critical. Implementing the NBCAP roadmap, establishing credit systems, and strengthening governance could unlock new opportunities for climate action, sustainable development, and regional leadership in blue carbon finance.
The post Philippines Taps Blue Carbon and Biodiversity Credits to Protect Coasts and Climate appeared first on Carbon Credits.


-
Climate Change8 months ago
Guest post: Why China is still building new coal – and when it might stop
-
Greenhouse Gases8 months ago
Guest post: Why China is still building new coal – and when it might stop
-

 Greenhouse Gases2 years ago
嘉宾来稿:满足中国增长的用电需求 光伏加储能“比新建煤电更实惠”
-
Climate Change2 years ago
Bill Discounting Climate Change in Florida’s Energy Policy Awaits DeSantis’ Approval
-

 Climate Change2 years ago
嘉宾来稿:满足中国增长的用电需求 光伏加储能“比新建煤电更实惠”
-
Climate Change Videos2 years ago
The toxic gas flares fuelling Nigeria’s climate change – BBC News
-

 Renewable Energy6 months ago
Sending Progressive Philanthropist George Soros to Prison?
-

 Carbon Footprint2 years ago
US SEC’s Climate Disclosure Rules Spur Renewed Interest in Carbon Credits