

Tesla, Inc. continues to show strong performance in 2025. In the third quarter alone, the company delivered 497,099 vehicles, close to half a million units. This figure is one of Tesla’s highest quarterly delivery totals on record. At the same time, its Austin Gigafactory reached a key production milestone — more than 500,000 vehicles built since opening in 2022.
These achievements confirm Tesla’s steady expansion of its manufacturing network. The company now runs major factories in California, Texas, Nevada, Germany, and China. Each plant contributes to a growing global supply chain that supports its Model Y, Model 3, and the new Cybertruck.
Tesla’s steady ramp-up shows how far it has come since its early production struggles. The company aims to reach 20 million vehicles a year by 2030. This plan is ambitious, but this quarter’s numbers show steady progress toward that goal.
Gigafactory Texas Reaches a Key Milestone
Gigafactory Texas, near Austin, is Tesla’s biggest and most advanced U.S. facility. It makes the Model Y and is ramping up Cybertruck production. Hitting 500,000 vehicles in roughly three and a half years shows faster growth compared to Tesla’s earlier plants.
Reports say around 100,000 vehicles were made from April to mid-October 2025. This strong pace helps meet annual growth targets. The plant uses Giga Presses, which are massive casting machines that replace dozens of smaller parts. This automation speeds up production, reduces costs, and minimizes material waste.
The Texas facility also plays a central role in Tesla’s sustainability strategy. Much of its electricity comes from renewable energy, and its design reduces water use and waste. Over time, Tesla aims for all Gigafactories to operate with 100% clean energy.
Q3 Earnings Outlook: Revenue Growth, Margin Pressure
Analysts expect Tesla to post around $26.3 billion in revenue for Q3 2025, up about 4–5% year-over-year. However, earnings per share (EPS) are projected to fall about 24%, to roughly $0.55 per share from $0.72 in the same quarter last year.
The decline is mainly due to lower vehicle prices and smaller contributions from carbon redit sales. These credits have been providing a huge revenue stream to the EV giant by selling it to its peers that don’t meet regulatory emission reductions.
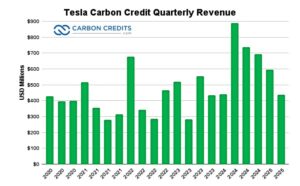
Also, Tesla has cut prices on its main models in several markets to stay competitive, especially against Chinese EV makers. Those price cuts attract new buyers but reduce profit margins.
Tesla’s operating margin averaged 9.2% in Q2 2025, down from 11.4% a year earlier. Automotive gross margin, excluding credits, was about 18%, compared to over 25% in 2022. Even with tighter margins, Tesla continues to benefit from software revenue through Full Self-Driving (FSD) packages and connectivity subscriptions.
The company’s results will likely depend on several key factors:
- Vehicle deliveries – nearly half a million this quarter.
- Energy storage deployments – reaching a new record of 12.5 GWh.
- Software and services – providing recurring, higher-margin income.
- Production costs – influenced by logistics and raw material expenses.
Despite margin pressure, Tesla’s growth in energy storage and software could offset some of the decline in car profits.
The Global EV Race Accelerates
The global electric vehicle (EV) market continues to expand rapidly. The International Energy Agency (IEA) reports that global EV sales rose over 30% in 2024. They reached almost 14 million units. In 2025, sales could hit 17 million. Electric cars could represent about 22% of all vehicle sales globally by the end of this year.

Tesla remains a market leader, holding around 16% of global EV market share, but it faces rising competition. Chinese brands like BYD, NIO, and XPeng are growing in Asia and Europe. At the same time, Volkswagen, Ford, GM, and Hyundai are speeding up EV production.
Elon Musk’s company defends its position by improving efficiency and cutting costs. Its 4680 battery cells are key, aiming to lower production costs by up to 50%. They also enhance range and durability.
The company also benefits from the U.S. Inflation Reduction Act (IRA), which offers tax credits for EV buyers and incentives for battery production. However, these credits will gradually phase out, which could affect demand after 2026.
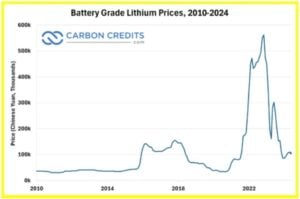
According to BloombergNEF, the average price of lithium-ion batteries dropped to $115 per kWh in 2024, down 20% from 2023. This decline helps Tesla maintain affordability while protecting margins.
Wall Street Takes the Wheel: Tesla Stock Gains on Big Deliveries
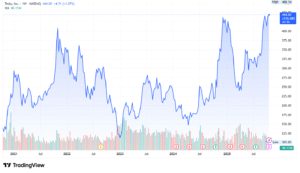
Tesla’s stock rose modestly after its Q3 delivery report. On Monday, shares gained, surpassing $444, which doubled in six months. The rise reflects investor confidence in Tesla’s production capacity and delivery strength, even with profit pressure.
Analysts remain split: some expect stronger earnings in 2026 as new models roll out, while others warn that price cuts and competition could slow growth.
Still, Tesla’s ability to maintain high output while scaling its energy business supports its long-term outlook. The company is a top choice for big investors like BlackRock and Vanguard. They both focus on sustainability in their investment strategies.
- SEE MORE: Tesla (TSLA) Stock Rises Over $450, Hits Record $1.5T Market Cap as Q3 Delivery Test Looms
Driving Clean: Tesla’s Growing Role in a Net-Zero World
Tesla’s business model directly supports global emission-reduction goals. Tesla’s 2024 Impact Report shows that customers avoided almost 32 million metric tons of CO₂e emissions. This is a 60% increase from last year. This figure includes emissions avoided by Tesla’s vehicles as well as its solar and energy storage products globally.
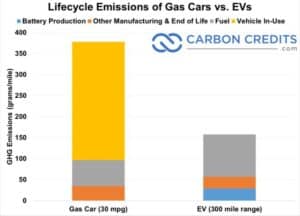
Since 2012, Tesla’s fleet has avoided many millions of metric tons of CO₂e. Each vehicle saves about 52 metric tons of CO₂e compared to similar gasoline cars over an average lifespan of 17 years.
Tesla also focuses on sustainable manufacturing:
- Gigafactory Nevada recycles more than 92% of production waste and reduces its water use intensity by 12% year-over-year.
- The company sources lithium and aluminum from suppliers following responsible mining and low-carbon standards.
- Its battery recycling program recovers up to 95% of nickel, cobalt, and lithium for reuse.
Beyond vehicles, Tesla’s energy business is expanding fast. In 2024, the company deployed 15 GWh of energy storage through its Megapack and Powerwall systems — enough to power over 4 million homes for one hour. These systems help utilities store renewable energy, stabilize grids, and reduce fossil fuel reliance.
Tesla aims to reach net-zero emissions across its value chain by 2040, covering factories, logistics, and product lifecycles. Investments in solar, wind, and carbon reduction projects are key to that goal.
Roadblocks and Roadmaps: What’s Next for Tesla
Amid its strong momentum, Tesla still faces several challenges that could affect future growth:
- Competition: Rivals are narrowing the gap in technology and cost.
- Price pressure: Discounts to boost demand reduce profitability.
- Regulatory risks: Autopilot and FSD remain under scrutiny in some markets.
- Supply chain: Securing critical minerals like lithium and nickel remains essential.
To adapt, Tesla is diversifying. The company plans to launch a low-cost compact vehicle, often referred to as the Model 2, expected to be priced under $27,000 and launched in late 2026.
It’s also developing a robotaxi platform, codenamed CyberCab, expected to begin pilot operations in 2026 with Level 4 autonomy. Plus, Tesla Energy could exceed $10 billion in annual revenue by 2026, supported by growing Megapack demand in the U.S. and Europe.
Tesla’s Q3 2025 milestones highlight both progress and pressure. Delivering nearly 500,000 vehicles and producing 500,000 at its Texas plant shows major strides in sustainable mobility. Revenue continues to grow even as profits tighten.
As Tesla prepares to announce its Q3 earnings, investors will look for signs of balance — growth, profitability, and sustainability. If the company keeps expanding responsibly and investing in cleaner technologies, it will remain a central player in the global transition toward a zero-emission economy.
The post Tesla Rides High Before Q3 Earnings With (TSLA) Stock Rising, Record Deliveries, Gigafactory Growth, and Green Goals appeared first on Carbon Credits.
For most businesses, the emissions that matter most sit outside their own walls. Scope 3 emissions, everything generated across your value chain, from the suppliers who make your inputs to the customers who use your products, typically make up the majority of a company’s total carbon footprint. Under the Corporate Sustainability Reporting Directive (CSRD), those value-chain emissions now have to be measured and disclosed with a rigour that spend-based estimates alone struggle to satisfy. This guide sets out how to improve Scope 3 data accuracy for CSRD: the calculation methods open to you, how to move from estimates to verified supplier data, and how to govern that data so it holds up to audit.
![]()
A carbon credit is a commitment that extends well into the future. The tonne of CO₂ compensated for today from a nature-based carbon project must remain out of the atmosphere for good, which means the forest behind the credit has to remain standing long after the transaction is complete. For any buyer, this raises a defining question: What ensures that the forest endures?
![]()
What replaced the cheap REDD credit on the boardroom slide deck, and why procurement is leading the rewrite.
Three years ago, a corporate slide showing a portfolio of cheap REDD+ credits could carry a board meeting. The number was big, the price was low, and the press release wrote itself. Today, that same slide gets sent back with questions. The questions are uncomfortable, the answers are unclear, and your general counsel is suddenly in the room.
Conventional carbon offsets are not dead. The voluntary carbon market retired 202 million tonnes in 2025, and the Morgan Stanley Institute for Sustainable Investing survey published in January 2026 confirmed that interest from corporate buyers remains substantial. What changed is the credibility threshold. The integrity floor has risen, the disclosure scrutiny has tightened, and the buyer profile has shifted. This article tracks what changed, what sophisticated buyers now ask before signing, and what serious corporates are putting on the board slide instead.
What boards used to buy, and why it stopped working
The 2020 to 2022 model was simple: buy a large tranche of avoidance credits at low single-digit prices, retire them against the company footprint, announce the carbon-neutral claim, and move on. Most of those credits came from REDD+ projects, renewable energy installations in countries where the renewable energy was already economic, or methane projects with thin documentation.
Several things broke that model. Academic research published in 2023, including a widely cited Science paper, found that the majority of REDD+ credits issued under the most common methodologies did not represent additional reductions when tested against rigorous counterfactuals. The Voluntary Carbon Markets Integrity Initiative published its Claims Code of Practice, which sets requirements for what companies can credibly claim from credit use. The European Union finalised its Green Claims Directive, restricting how companies can describe products as climate-neutral. France’s Décret 2022-539 already restricts carbon neutrality advertising. California’s AB 1305 imposes disclosure requirements on any company making net-zero or carbon-neutral claims while doing business in the state.
The collective effect: the cheap credit no longer buys the announcement, and the announcement now carries litigation risk.
The integrity reset: ICVCM, VCMI, and what changed
The Integrity Council for the Voluntary Carbon Market published the Core Carbon Principles in 2023 and began assessing methodologies against them in 2024. The first methodologies received the CCP label later that year. The point of the label is to give corporate buyers a defensible quality screen they can cite in disclosure.
The Voluntary Carbon Markets Integrity Initiative complements this on the demand side. Its Claims Code of Practice defines what a buyer can say (Silver, Gold, or Platinum claims, with associated requirements) based on the quality of credits used and the underlying decarbonisation strategy. Together, CCP and VCMI build a quality stack: CCP on the supply, VCMI on the claim, with the science-based target sitting underneath both.
The reset is not a ban on offsets. It is a ratchet. Credits that meet the new bar continue to clear; credits that do not, do not. The Morgan Stanley survey found that 61% of current buyers like the CCP label concept but that supply of labelled credits remains limited. That supply constraint is now visible in pricing.
What sophisticated buyers ask before they sign
The questions on the procurement scorecard have changed. A 2022 buyer might have asked about price, vintage, and project type. A 2026 buyer asks five different questions before any of those.
- What does the counterfactual look like, and who validated it.
- What is the permanence regime, and what is the buffer pool exposure.
- What is the leakage risk, and how is it mitigated.
- What rating has the project received from the independent ratings agencies (Sylvera, BeZero, Calyx Global), and what was the rationale.
- What is the documentation discipline that survives an audit four years from now when the procurement team that signed the contract has moved on.
If the vendor cannot answer those five questions on a first call, the conversation ends. Conversely, if the vendor can answer them with documented specificity, the conversation often expands beyond a single transaction toward a multi-year engagement.
Where this leaves your near-term commitments
You probably have near-term commitments that pre-date the integrity reset. Public targets to be carbon neutral by 2025 or 2030. Product-level claims that ran in last year’s marketing. Disclosed reduction trajectories that assumed continued access to cheap credits.
You have three workable paths. The first is to re-baseline your strategy, replacing the most exposed credits with higher-quality alternatives and adjusting the public language to match what you can defend. The second is to shift the underlying spend from offsetting outside your value chain to investing inside your value chain, where reductions count against Scope 3 directly and the audit trail is cleaner. The third is to keep the strategy and absorb the risk, which is increasingly the most expensive option once you price in litigation, restatement, and reputational exposure.
Most serious buyers are choosing the second path. It moves the carbon spend from a compliance cost to a procurement and resilience investment, and it removes the central failure point of the legacy model: the disconnect between where the emissions occurred and where the reductions sat. Nature-based supply chain investments, structured under the GHG Protocol Land Sector and Removals Standard and aligned to the SBTi FLAG Guidance, are the asset class that fits this brief. They generate inventory-grade reductions, they produce audit-grade documentation, and they survive the new claim restrictions because the carbon math sits inside the value chain that the disclosure already covers.
If you are reassessing a carbon strategy under the new integrity bar, or rebuilding a board narrative that has to survive a more skeptical audience, the carbon and sustainability experts at Carbon Credit Capital can help. The Dual-Value Model gives you a defensible alternative to legacy offset purchases, with the documentation and operational integration that survives the procurement scorecard and the audit. Schedule a consultation.


-
Climate Change11 months ago
Guest post: Why China is still building new coal – and when it might stop
-
Greenhouse Gases11 months ago
Guest post: Why China is still building new coal – and when it might stop
-

 Greenhouse Gases2 years ago
嘉宾来稿:满足中国增长的用电需求 光伏加储能“比新建煤电更实惠”
-

 Climate Change2 years ago
嘉宾来稿:满足中国增长的用电需求 光伏加储能“比新建煤电更实惠”
-
Climate Change2 years ago
Bill Discounting Climate Change in Florida’s Energy Policy Awaits DeSantis’ Approval
-

 Renewable Energy9 months ago
Sending Progressive Philanthropist George Soros to Prison?
-

 Carbon Footprint2 years ago
US SEC’s Climate Disclosure Rules Spur Renewed Interest in Carbon Credits
-
Greenhouse Gases1 year ago
嘉宾来稿:探究火山喷发如何影响气候预测