
The year 2025 was in the top-three warmest years on record, with average surface temperatures reaching around 1.44C above pre-industrial levels across eight independent datasets.
The different temperature records confirm that last year was either the second or third warmest since observations began in the mid-1800s, with razor-thin margins between 2025 and 2023.
Last year also set a new record for ocean heat content, with the oceans absorbing more than 90% of the heat trapped by increasing greenhouse gas concentrations in the atmosphere.
Here, Carbon Brief examines the latest data across the Earth’s oceans, atmosphere, cryosphere and surface temperature. (Use the links below to navigate between sections.)
Noteworthy findings from this 2025 review include…
- Ocean heat content: It was the warmest year on record for ocean heat content and one of the largest year-over-year increases in ocean heat content. In 2025, the oceans added 35 times more heat than all annual human energy use.
- Global surface temperatures: The year 2025 is effectively tied with 2023 as the second-warmest year on record – coming in at between 1.33C and 1.53C above pre-industrial levels across different temperature datasets and 1.44C in the synthesis of all groups.
- Second warmest over land: Global temperatures over the world’s land regions – where humans live and primarily experience climate impacts – were 2C above pre-industrial levels, just below the record set in 2024.
- Third warmest over oceans: Global sea surface temperatures were 1C above pre-industrial levels, dropping from 2024 record levels due to fading El Niño conditions.
- Regional warming: It was the warmest year on record in areas where, collectively, more than 9% of the global population lives.
- Unusual warmth: The exceptionally warm, record-setting temperatures over the past three years (2023-25) were driven by continued increases in human emissions of greenhouse gases, reductions in planet-cooling sulphur dioxide aerosols, variability related to a strong El Niño event and a strong peak in the 11-year solar cycle.
- Comparison with climate models: Observations for 2025 were nearly identical to the central estimate of climate model projections in the Intergovernmental Panel on Climate Change (IPCC) sixth assessment report (AR6).
- Heating of the atmosphere: It was the second warmest year in the lower troposphere – the lowest part of the atmosphere.
- Sea level rise: Sea levels reached record highs, continuing a notable acceleration over the past three decades.
- Shrinking glaciers and ice sheets: Cumulative ice loss from the world’s glaciers and from the Greenland ice sheet reached a new record high in 2025, contributing to sea level rise.
- Greenhouse gases: Concentrations reached record levels for carbon dioxide (CO2), methane and nitrous oxide.
- Sea ice extent: Arctic sea ice saw its lowest winter peak on record as well as its 10th-lowest summer minimum extent, while Antarctic sea ice saw its third-lowest minimum extent.
- Looking ahead to 2026: Carbon Brief predicts that global average surface temperatures in 2026 are likely to be between the second and fourth warmest on record, similar to 2023 and 2025, at around 1.4C above pre-industrial levels.
Ocean heat content sets a new record
The year 2025 was the warmest on record for the heat content of the world’s oceans.
Ocean heat content (OHC) increased by around 500 zettajoules – billion trillion joules – since the 1940s.
The heat increase in 2025 alone compared to 2024 – about 23 zettajoules – is around 39 times as much as the total energy produced by all human activities on Earth in 2023 (the latest year in which global primary energy statistics are available). It was also the largest increase in ocean heat content since 2017 (following the strong El Niño event of 2016).
Human-emitted greenhouse gases trap extra heat in the atmosphere. While some of this warms the Earth’s surface, the vast majority – around of 93% – goes into the oceans. About two-thirds of this accumulates in the top 700 metres, but some also ends up in the deep oceans.
The figure below shows annual OHC estimates from the Chinese Institute for Atmospheric Physics (IAP) between 1950 and present for the upper 700 metres (light blue shading) and 700-2,000 metres (dark blue) of the ocean.
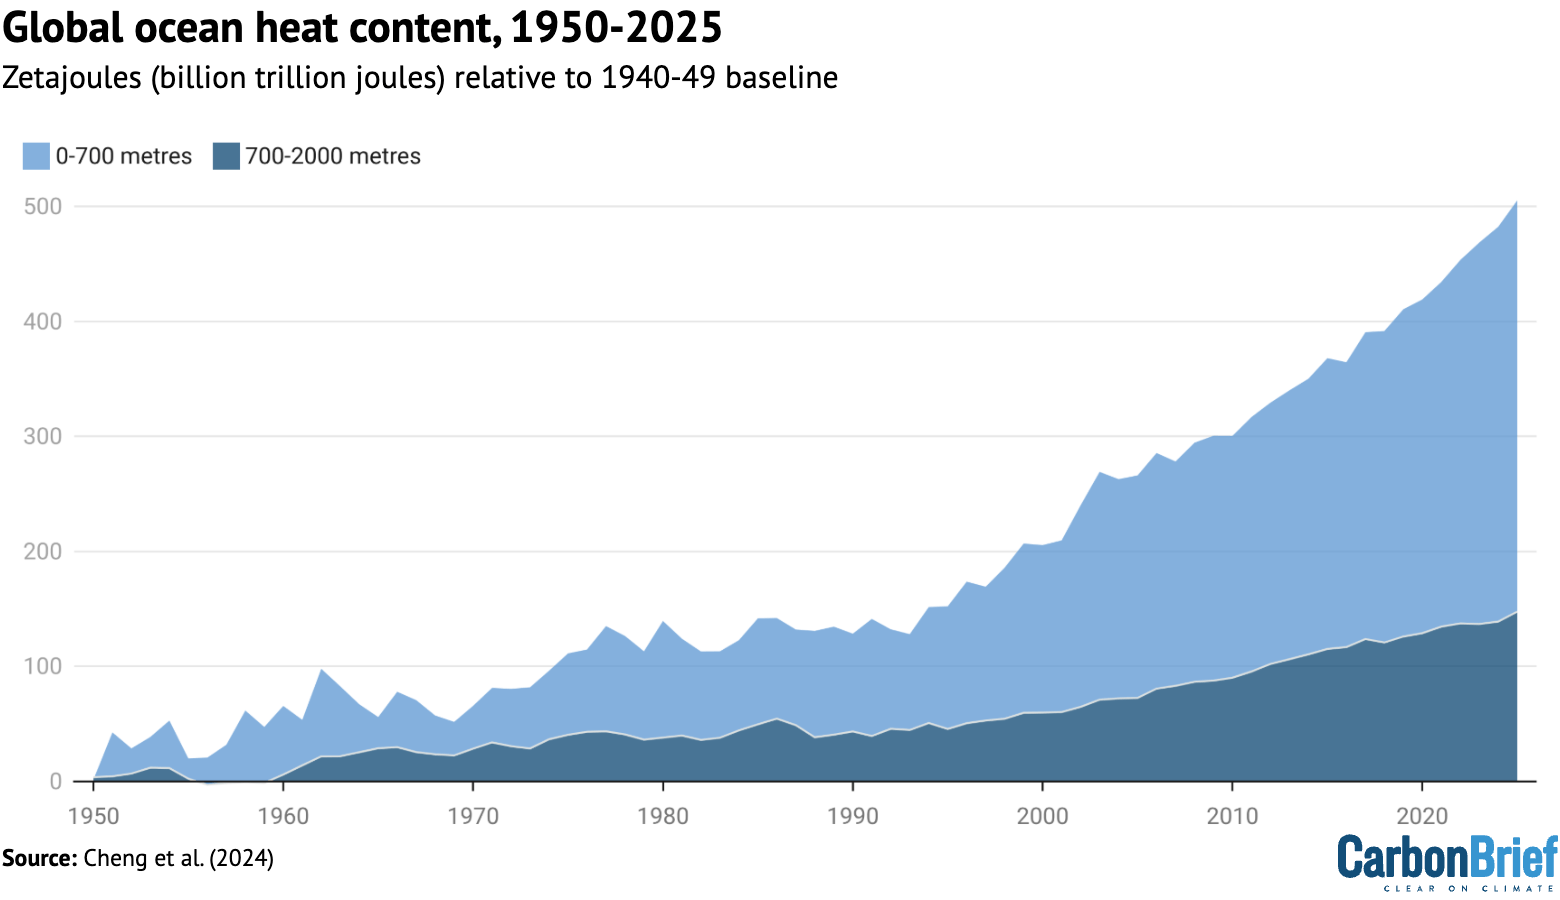
In a new paper published last week, researchers found that the rate of OHC increase over the past 15 years is unprecedented over the observational record in the IAP dataset. More broadly, there has been a distinct acceleration in OHC after 1991 – and recent OHC growth rates are generally consistent with satellite measurements of Earth energy imbalance (EEI).
(Energy imbalance is a measure of how much surplus heat there is in the Earth’s climate system. It is the difference between how much energy enters Earth’s atmosphere from the sun and how excess heat is radiated back into space as the world warms.)
In many ways, OHC represents a much better measure of climate change than global average surface temperatures, because it is where most of the extra heat ends up and is much less variable on a year-to-year basis than surface temperatures.
Surface temperatures tied at second warmest
To assess global surface temperatures in 2025, Carbon Brief uses eight independent datasets: NASA, NOAA, the Met Office Hadley Centre/University of East Anglia’s (UEA) HadCRUT5, Berkeley Earth, Copernicus ERA5, Japan’s JRA-3Q, DCENT and China-MST.
The analysis reveals that global surface temperatures were between the second and third warmest since records began in the mid-1800s. Temperatures effectively tied with 2023 within the margin of uncertainty, below the record set last year in 2024.
The figure below shows global surface temperature records from the eight datasets.

Global surface temperature records can be calculated back to 1850, though some groups such as NASA GISTEMP choose to start their records in 1880 when more data was available.
Prior to 1850, records exist for some specific regions, but are not sufficiently widespread to calculate global temperatures with high accuracy (though newly published research has attempted to extend this back to 1781).
These longer surface temperature records are created by combining ship- and buoy-based measurements of ocean sea surface temperatures with temperature readings of the surface air temperature from weather stations on land. (Copernicus ERA5 and JRA-3Q are an exception, as they use weather model-based reanalysis to combine lots of different data sources over time.)
Some differences between temperature records are apparent early in the record, particularly prior to 1900 when observations are more sparse and results are more sensitive to how different groups fill in the gaps between observations. However, there is strong agreement between the different temperature records for the period since 1970, as shown in the figure below.

Global temperatures over the past three years clearly stand out as much warmer than anything that has come before, well above the prior record set in 2016. More broadly, the 11 warmest years on record all happened in the past 11 years.
Two of the eight datasets analysed by Carbon Brief – NASA and DCENT – had 2025 as the second-warmest year behind 2024, while six of the datasets had 2025 as the third-warmest year behind both 2023 and 2024.
However, in nearly all cases the difference between 2023 and 2025 falls within each dataset’s published uncertainty range, making it effectively a tie between the two years.
The table below shows the reported 2025 global temperature anomalies (relative to each group’s 1850-1900 pre-industrial baseline), as well as a normalised 2025 value using a common pre-industrial baseline between the 1850-1900 and 1981-2010 periods across the five groups with data back to 1850 (NOAA, Hadley/UAE, Berkeley Earth, DCENT and China-MST).
| Dataset | 2025 Reported | 2025 Normalised | Ranking |
|---|---|---|---|
| NASA GISTEMP | 1.39 | 1.45 | Second |
| Hadley/UAE HadCRUT5 | 1.41 | 1.39 | Third |
| NOAA GlobalTemp | 1.33 | 1.41 | Third |
| Berkeley Earth | 1.44 | 1.44 | Third |
| Copernicus ERA5 | 1.47 | 1.47 | Third |
| JRA-3Q | 1.46 | 1.46 | Third |
| DCENT | 1.53 | 1.44 | Second |
| China-MST | 1.39 | 1.42 | Third |
Reported temperature anomalies range from as low as 1.33C (NOAA) to as high as 1.53C (DCENT), primarily reflecting differences in the early part of the record. The normalised 2025 values have a much smaller range, from 1.41C (NOAA) to 1.47C (Copernicus).
Separate land and ocean temperatures are not available yet from all of these groups. However, Berkeley Earth reports that global land temperatures in 2025 were the second warmest on record, at 2.03C above pre-industrial levels, while ocean temperatures were the third warmest at 1.03C.

Global land regions – where the global human population lives – has generally been warming around 70% faster than the oceans and 40% faster than the global average since 1970.
The year started off quite hot, with January 2025 setting a new record as the warmest January. All other months of the year ended up being either the second or third warmest on record after 2024 and 2023.
The figure below shows each month of 2025 in dark red, compared to all prior years since 1850. Each year is coloured based on the decade in which it occurred, with the clear warming over time visible, as well as the margin by which both 2023, 2024 and 2025 exceeded past years.

Extreme regional temperatures
While the globe as a whole was tied as the second warmest on record, many different regions of the planet set new records in 2025.
The figure below shows how global temperature deviated from the average in 2025 across the world. Areas shaded in red were warmer than the baseline period (1951-80) used by Berkeley Earth, whereas the few blue areas experienced cooler temperatures.
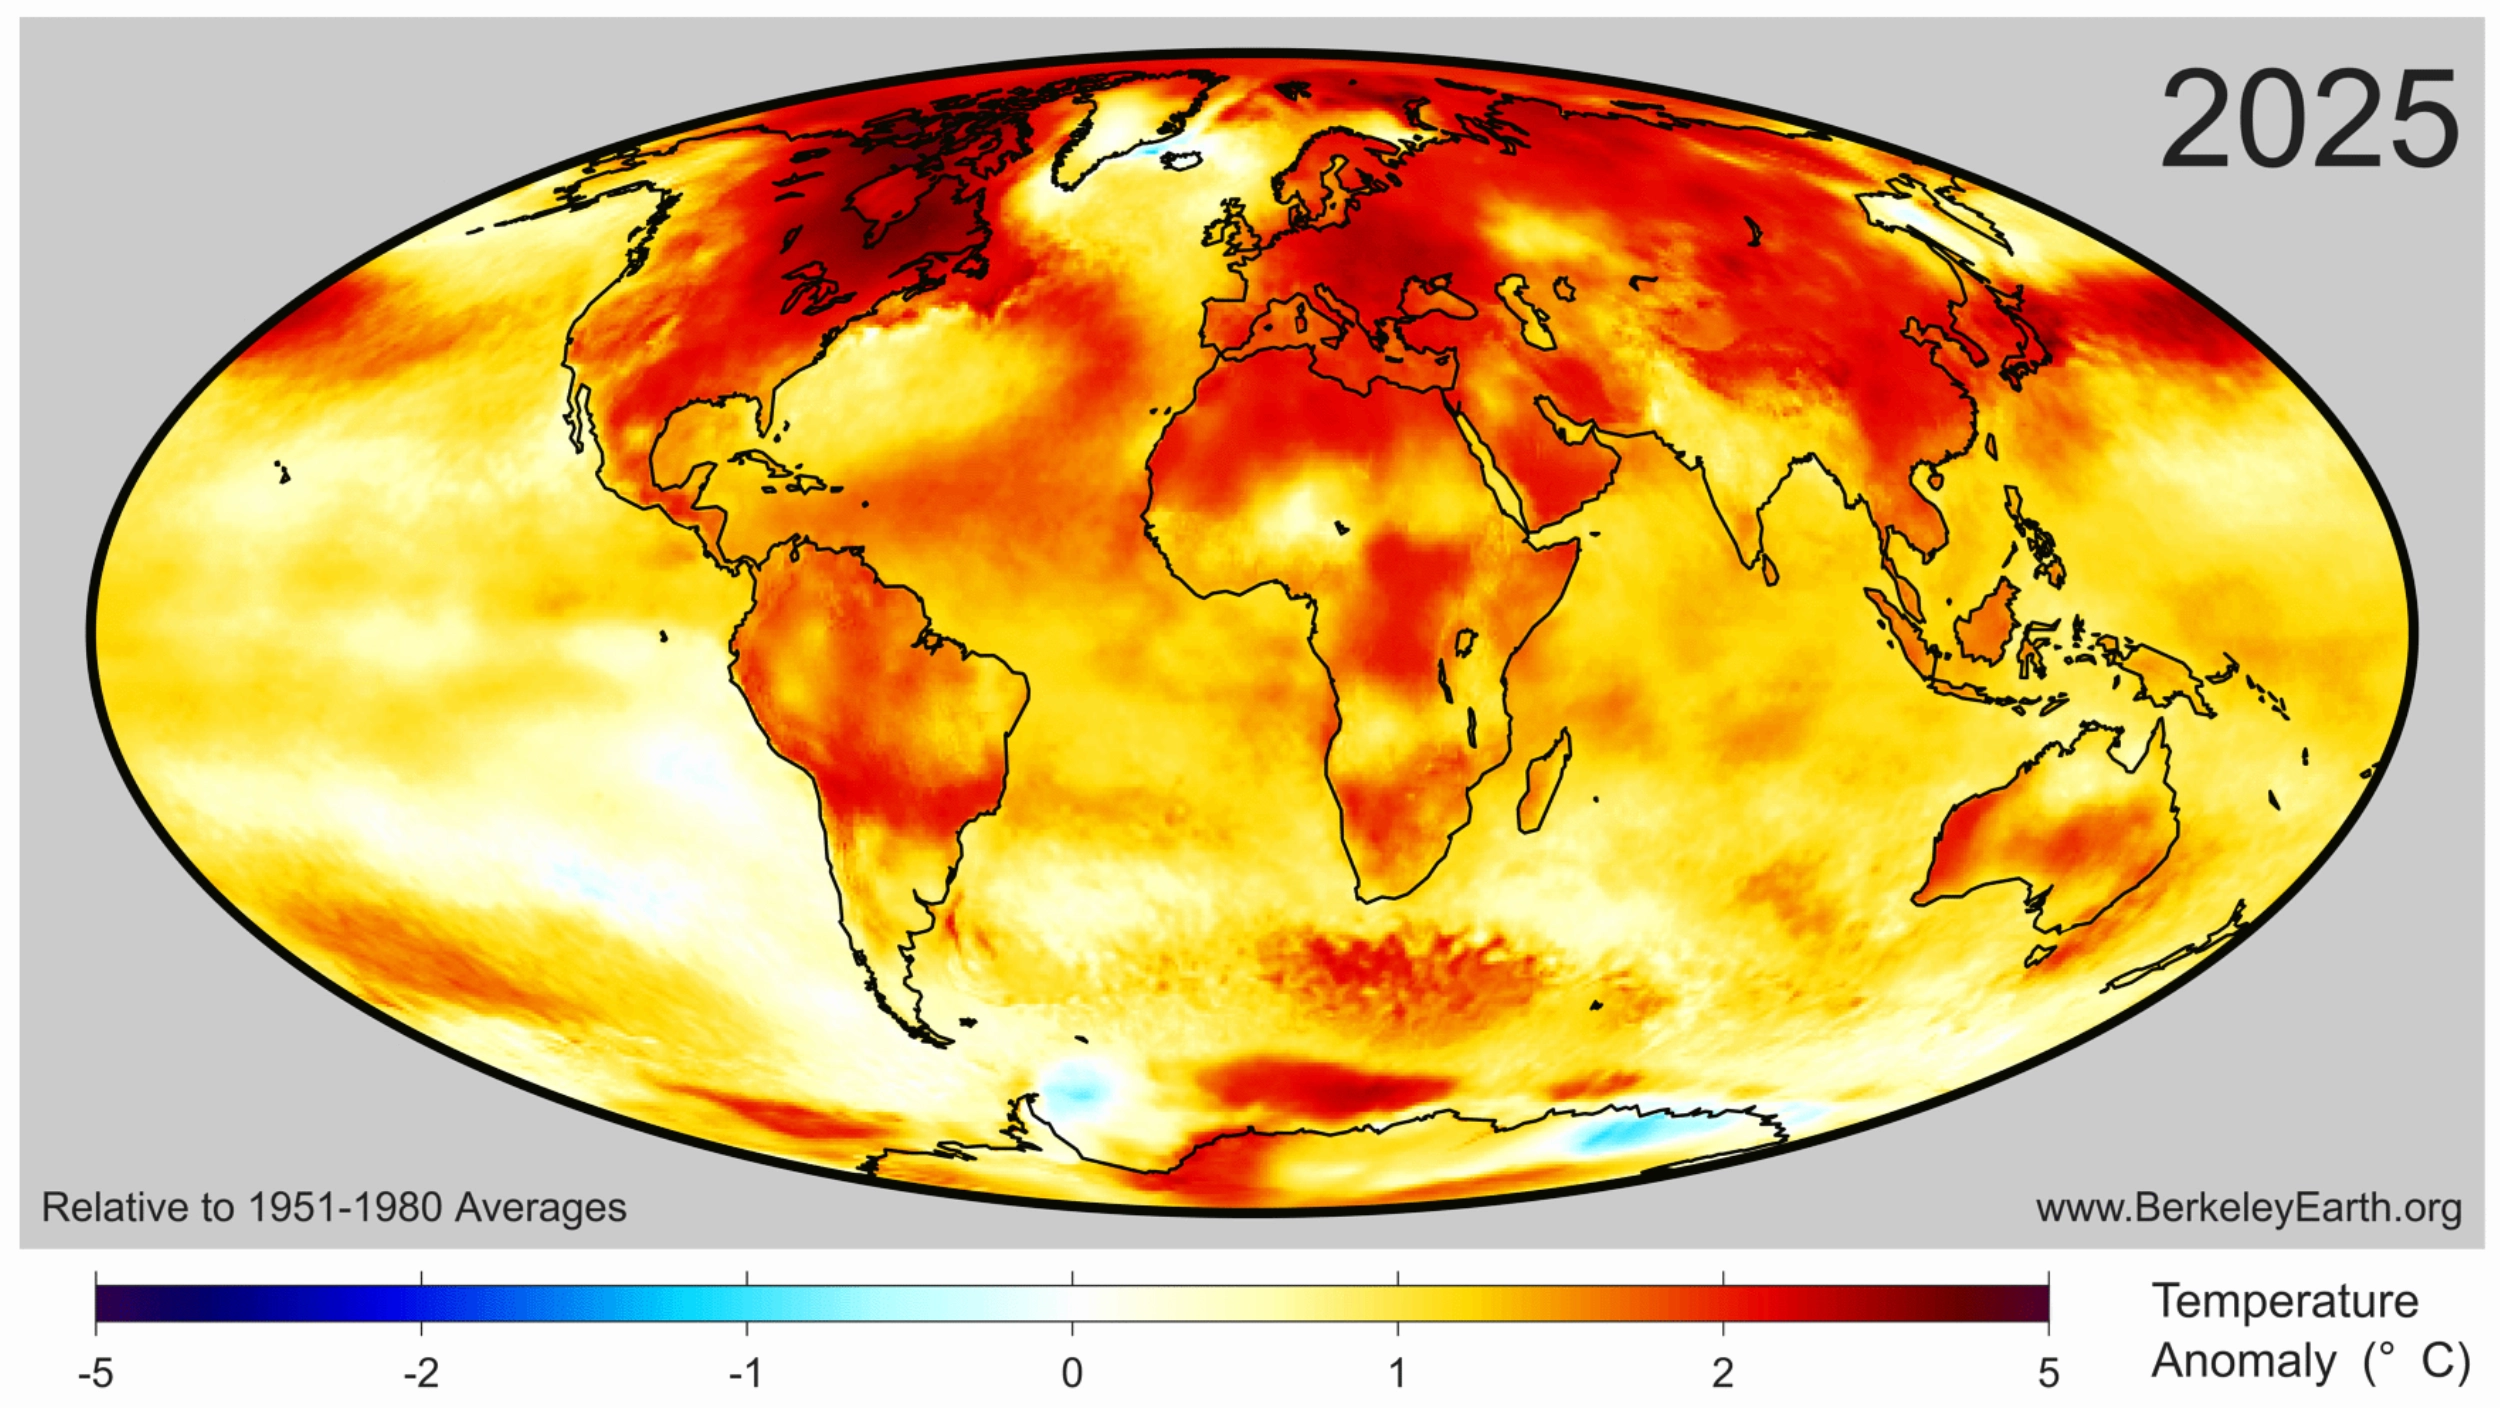
Collectively, approximately 770 million people – 9.3% of Earth’s population – live in places that experienced their warmest year on record in 2025. This was mostly concentrated in Asia, including around 450 million people in China.
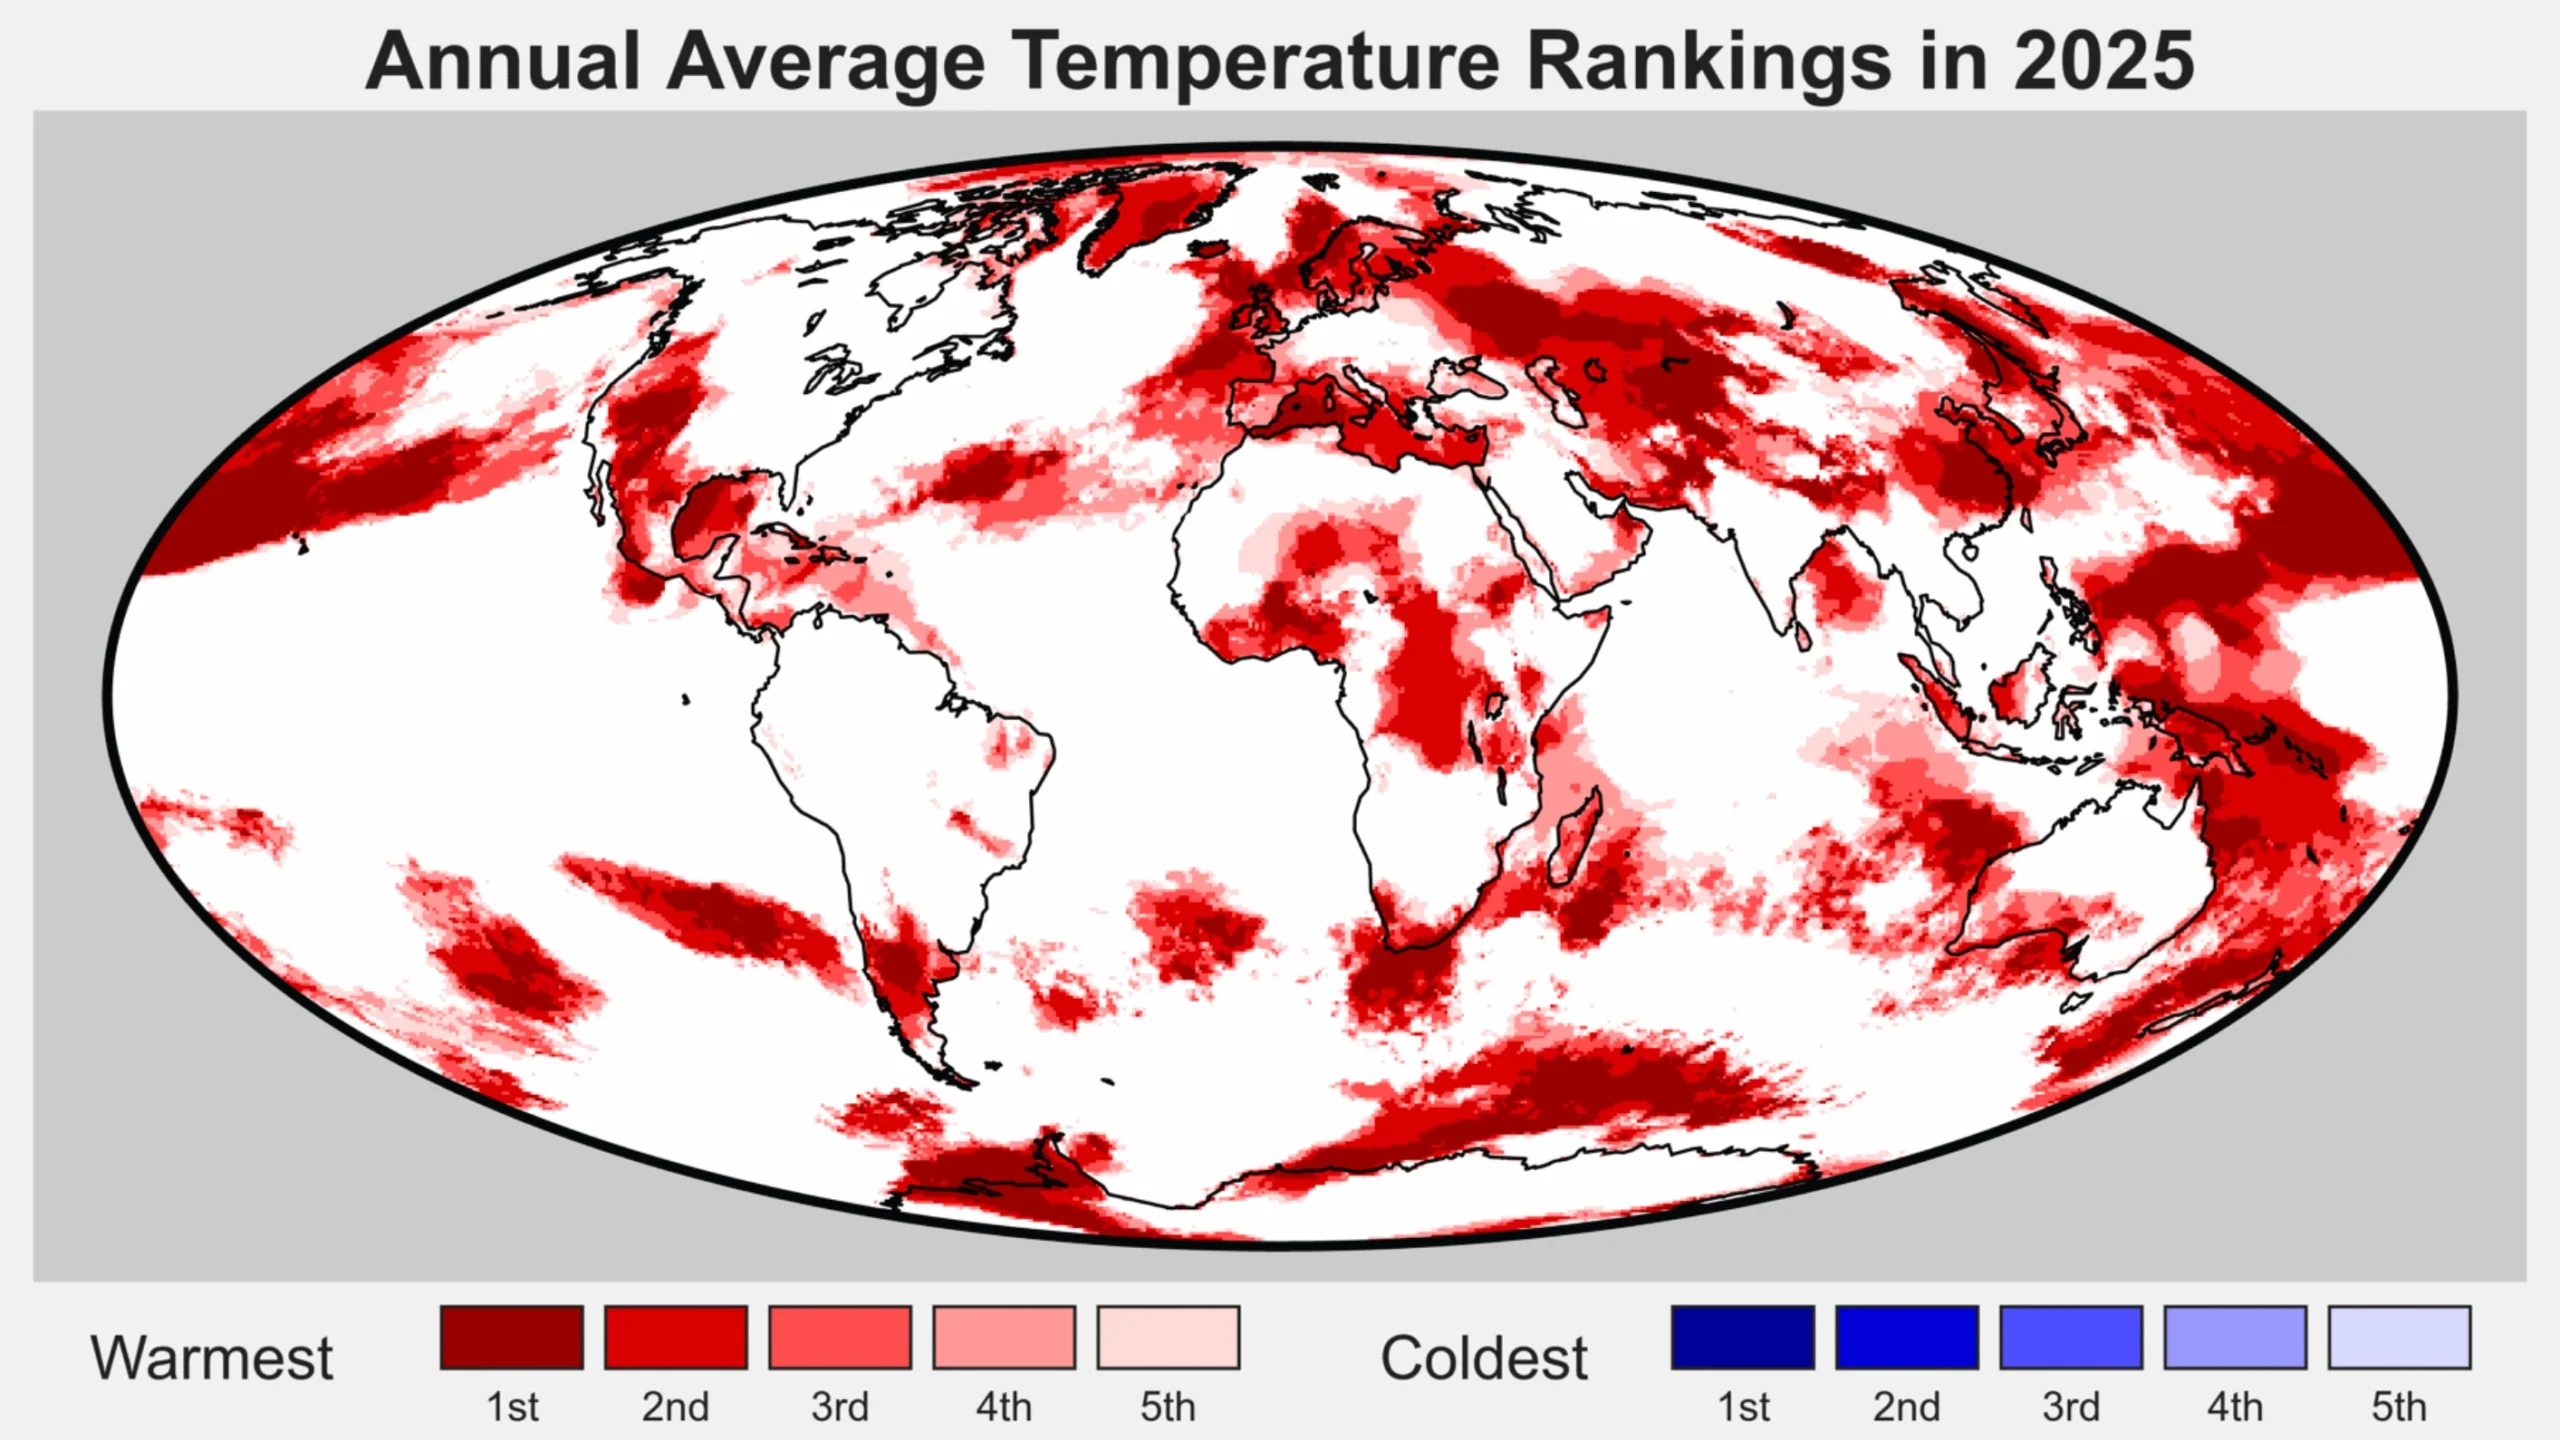
The figure below highlights regions of the planet that experienced their top-five warmest (red shading) or coldest (blue) temperatures on record in 2025. Overall, around 9% of the planet set a new record, including 11% of the land and 8% of the ocean. No location on the planet experienced record cold temperatures – or even top-five record cold temperatures – for the year as a whole.
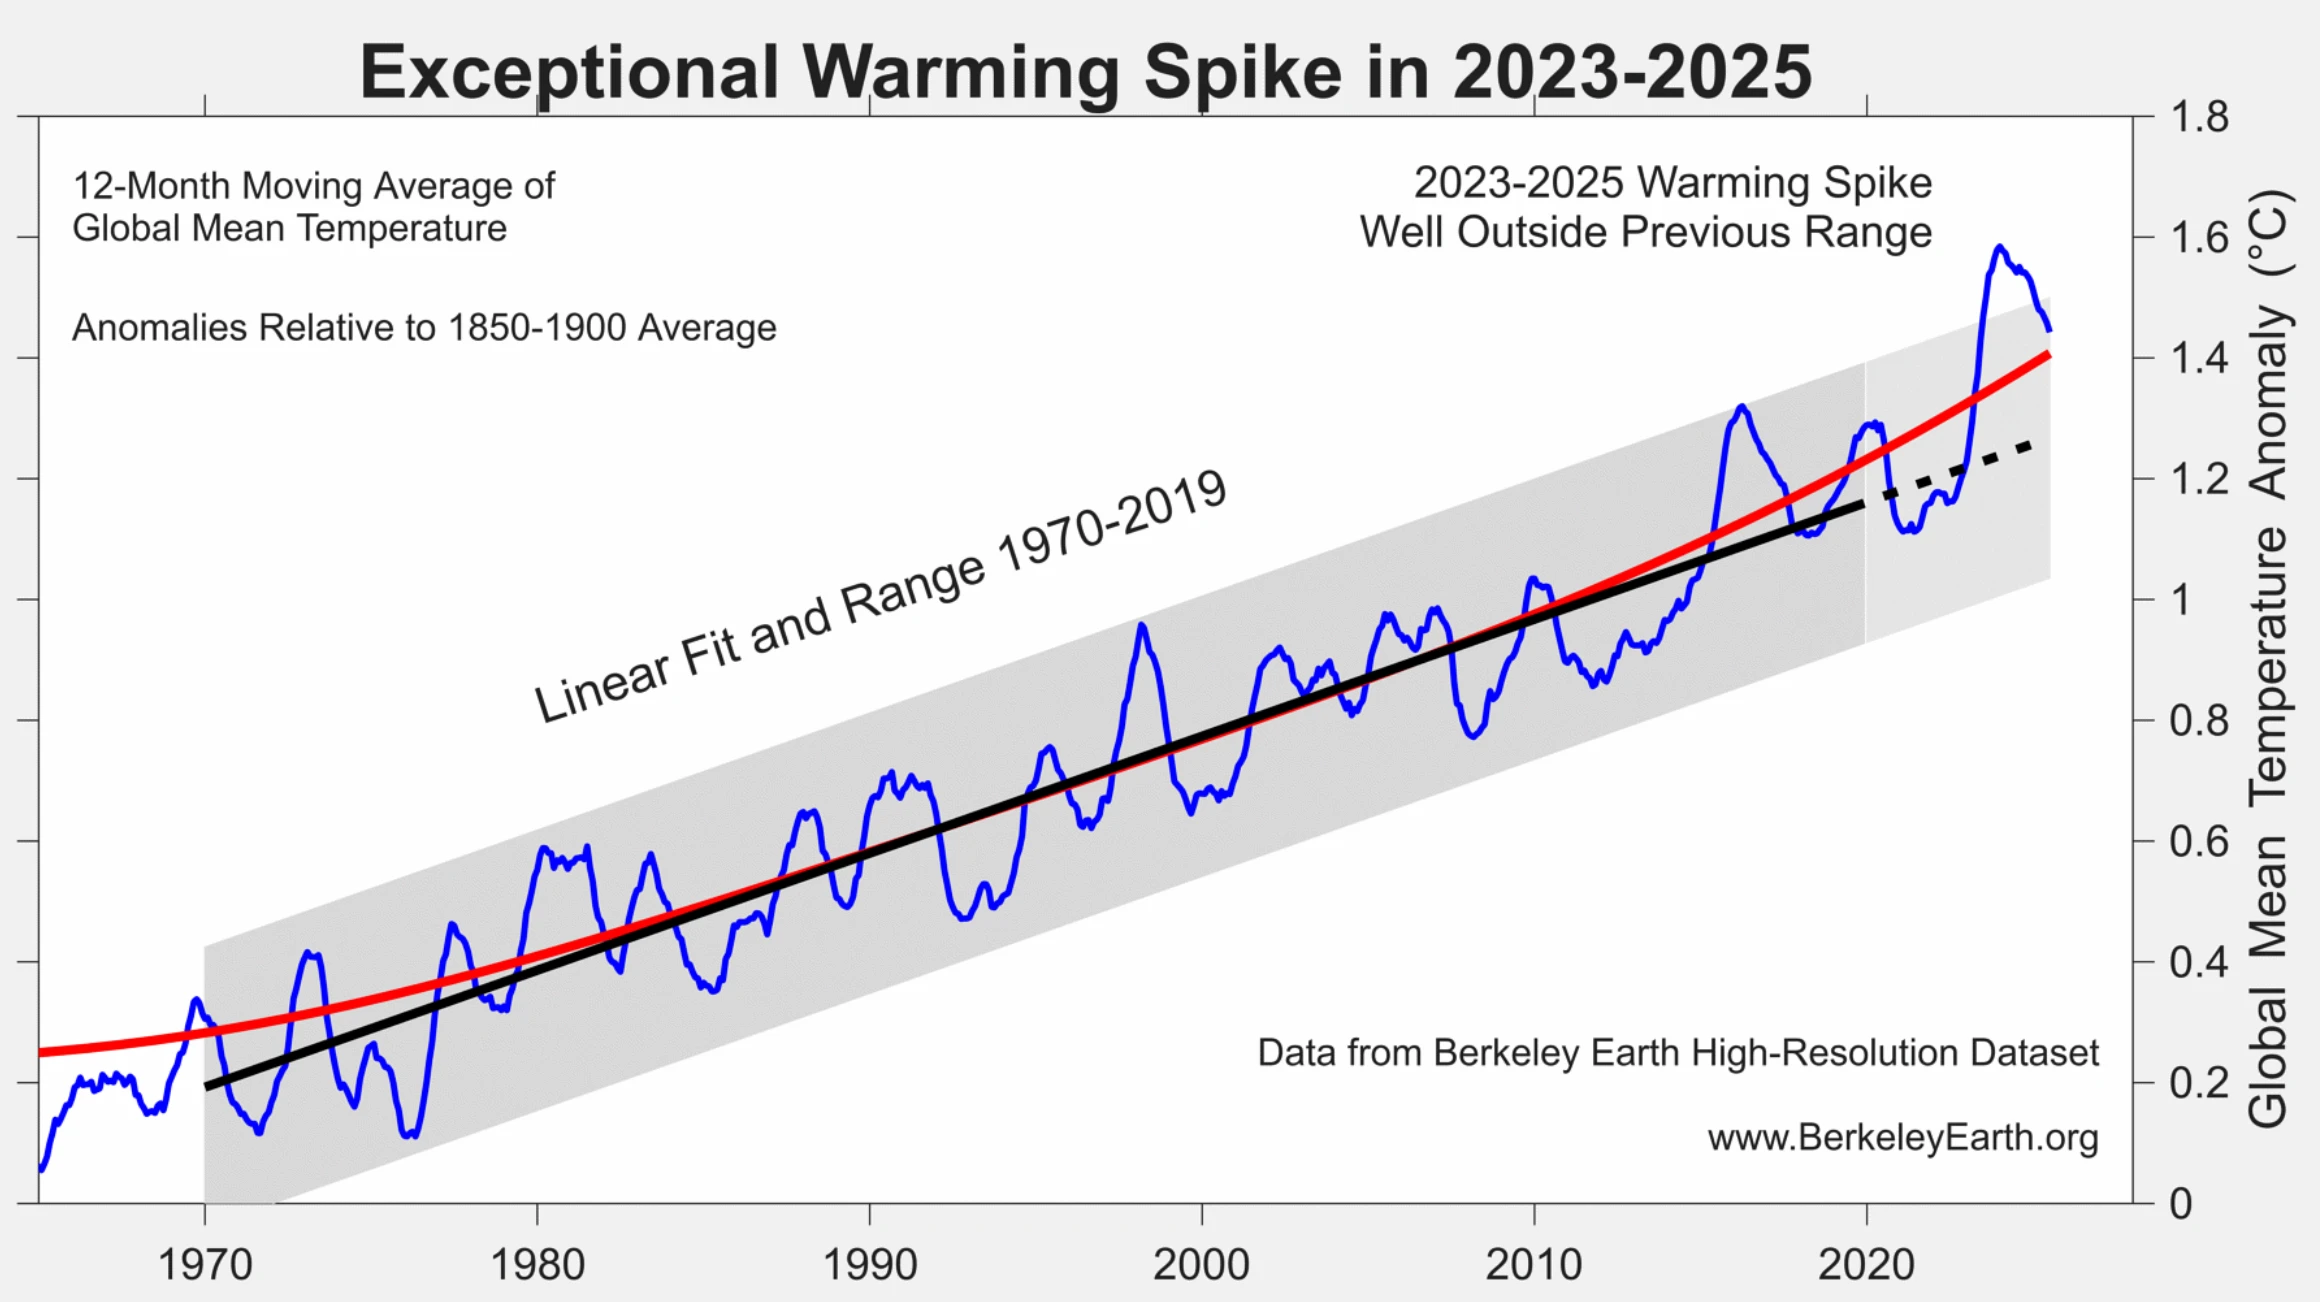
Drivers of recent record warmth
Global temperatures over the past three years have been unusually warm, well above what would be expected given the long-term warming trend of around 0.2C per decade since the 1970s.
Recent research has found that global warming has accelerated in recent years to around 0.27C per decade, though this acceleration is largely in-line with climate model projections under scenarios where greenhouse gas emissions continue to rise while emissions of planet cooling aerosols are reduced.
According to analysis from Berkeley Earth, the odds of global temperatures over 2023-25 occurring as a result of greenhouse gas emissions and natural variations in the Earth’s climate alone “is less than one-in-100” and “likely indicates that recent years have been impacted by additional warming factor(s)”.
The figure below shows how the exceptional warming spike of 2023-25 compares to the longer-term warming trend and historical climate variability.
Carbon Brief recently explored the drivers of recent warmth in more detail, finding that it is likely to have been driven by a combination of:
- A strong El Niño event that developed in the latter part of 2023.
- Rapid declines in sulphur dioxide emissions – particularly from international shipping and China.
- An unusual volcanic eruption in Tonga in 2022 that put a large amount of aerosols and water vapor into the upper atmosphere.
- A stronger-than-expected solar cycle.
This is illustrated in the figure below, which provides an estimate of the impact of each of these different factors on 2023 and 2024 temperatures, along with their respective uncertainties.
The sum of all the factors is shown in the “combined” bar, while the actual warming compared to expectations is shown in red. The upper chart shows 2023, while the lower one shows 2024.

The first bar includes both El Niño and natural year-to-year climate variability; the height of the bar reflects the best estimate of El Niño’s effects, while the uncertainty range encompasses year-to-year variability in global temperatures that may be – at least in part – unrelated to El Niño.
While a similar analysis has yet to be undertaken for 2025, the end of El Nino conditions and the development of a modest La Nina would have driven temperatures down, while the warming impact of shipping, Chinese aerosol declines would have slightly increased. The warming effect of the solar cycle would likely have remained flat or slightly declined as solar cycle 25 passed its peak.
Finally, a World Meteorological Organization (WMO) assessment of the Hunga Tonga-Hunga Ha’apai volcano found that “the record-high global surface temperatures in 2023-24 were not due to the Hunga eruption”.
The report suggested that the volcano had a small cooling effect (-0.03C) globally in 2023 and 2024. This might switch to a small warming effect (+0.03C) in 2025 and 2026 as the planet-cooling aerosols from the volcano fall back down to the surface but some of the stratospheric water vapour remains, it noted.
However, it added, these effects are “indistinguishable from background variability in the current climate”.
El Niño and La Niña are generally the largest drivers of year-to-year variability in global temperatures. The figure below shows the El Niño (red shading) and La Niña (blue) conditions over the past 40 years (collectively referred to as the El Niño-Southern Oscillation, or “ENSO”).

Carbon Brief has used the historical relationship between ENSO conditions and temperature to effectively remove the effects of El Niño and La Niña events from global temperatures, as shown in the figure below.
This analysis indicates that El Niño cooled global temperatures in 2025 around -0.05C, following a boost to global temperatures of around 0.12C in 2024, compared to the estimate of global temperatures with both El Niño and La Niña events removed.

This suggests that the shift from El Nino to La Nina conditions can fully explain the decline in global temperatures between 2024 and 2025 and that 2025 would have likely been the warmest year in the observational record if it had not been for the effects of ENSO.
Scientists provided estimates of where they expected 2025 temperatures to end up at the start of the year.
The figure below shows estimates by four different groups that provided temperature predictions for the year prior to any data being collected – the Met Office, NASA’s Dr Gavin Schmidt, Berkeley Earth and Carbon Brief’s own estimate — compared to what actually transpired.

Unlike in 2023 –and, to a lesser extent, 2024 –when start-of-year predictions were notably low, 2025 fell reasonably in-line with what was expected. The Met Office estimate was nearly exactly on target, with Berkeley Earth’s being close as well. Carbon Brief and Schmidt’s estimates were a little on the low side, but actual temperatures were well within the estimated error bars.
Observations in-line with climate model projections
Climate models provide physics-based estimates of future warming given different assumptions about future emissions, greenhouse gas concentrations and other climate-influencing factors.
Here, Carbon Brief examines a collection of climate models – known as CMIP6 – used in the 2021 science report of the IPCC’s sixth assessment.
In CMIP6, model estimates of temperatures prior to 2015 are a “hindcast” using known past climate influences, while temperatures projected from 2015 onward are a “forecast” based on an estimate of how things might change.
The figure below shows how observations compare to the full ensemble of 37 CMIP6 models under the middle-of-the-road SSP2-4.5 emissions scenario for future projections. The red line represents the average of all the models and the red areas showing the 5th to 95th percentile range. The average of the eight observational temperature datasets are plotted as dots on top of the climate model data.
The chart illustrates how observations have generally been a bit below the model average over the past two decades, were slightly above model average in 2024 and are more or less dead on in 2025.

However, the ensemble of CMIP6 models differs from the main projection of future warming in the recent IPCC AR6 report. A subset of CMIP6 models have unrealistically high climate sensitivity and they reproduce historical observations poorly.
To account for this, rather than simply averaging all the models – as had been done in prior assessments – the IPCC employed an approach that effectively weights models by their performance. As a result, the models align better with the range of climate sensitivity derived from multiple different lines of evidence.
The chart below shows the assessed warming projections from the IPCC AR6 report in red, with historical observations since 1850 as black dots.
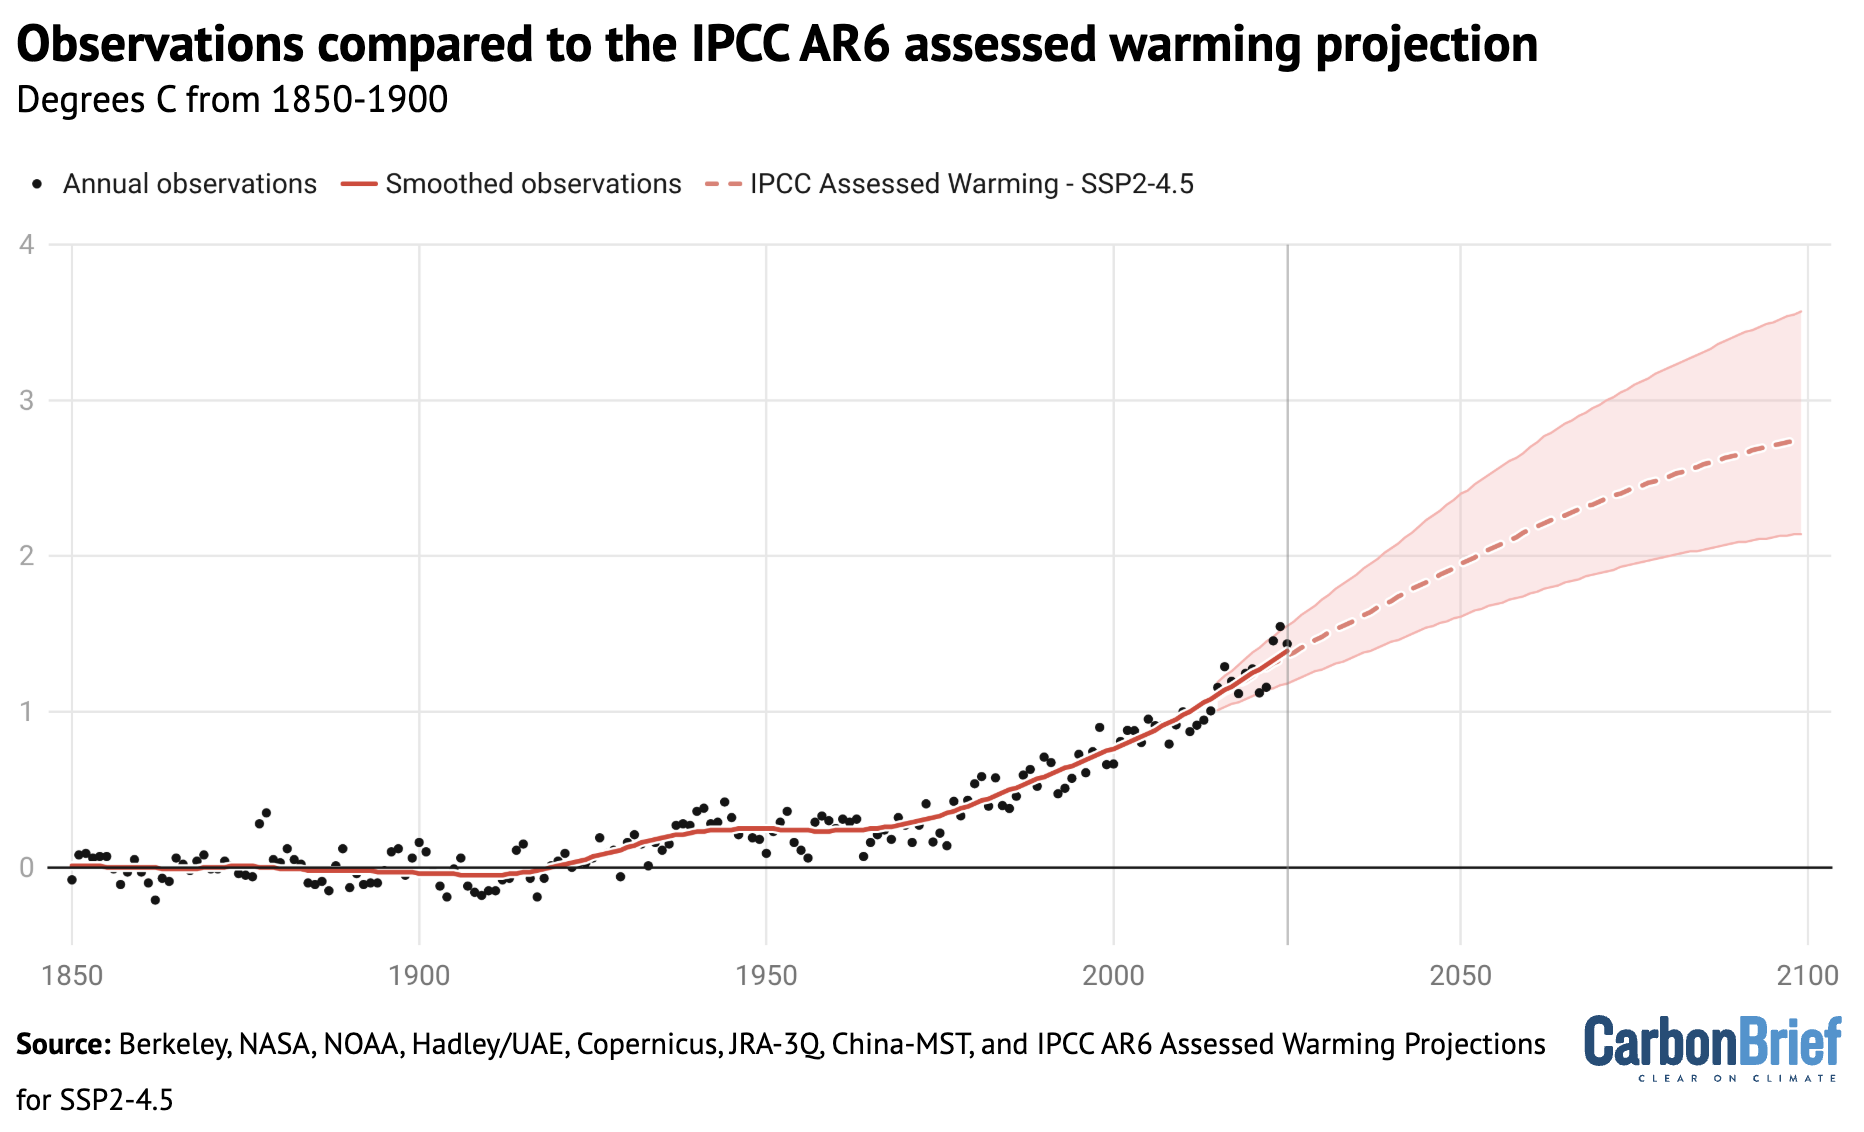
The chart reveals that observed global surface temperatures (black dots) are further above the modeled central estimate 2023-25, but generally remain within the IPCC assessed range.
Climate models broadly expect an acceleration of warming in the current period in a scenario like SSP2-4.5 where emissions of CO2 and other greenhouse gases continue to modestly increase, but emissions of planet-cooling aerosols like sulphur dioxide are rapidly reduced.
Second-warmest atmospheric temperatures
In addition to surface measurements over the world’s land and oceans, satellite microwave sounding units have been providing estimates of temperatures at various layers of the atmosphere since 1979.
The lowest layer of the atmosphere that satellite microwave units provide temperature estimates for is the lower troposphere. This data reflects temperatures a few kilometres above the Earth’s surface. It reveals a pattern of warming in the lowest troposphere that is similar – though not identical – to surface temperature changes.
The records produced by Remote Sensing Systems (RSS), the University of Alabama, Huntsville (UAH) and NOAA show 2025 as the second warmest year on record in the lower troposphere, after 2024. The chart below shows the three records for the lower troposphere, using a more recent baseline period (1981-2010) given the absence of satellite data before 1979.

The lower troposphere tends to be influenced more strongly by El Niño and La Niña events than the surface. Therefore, satellite records show correspondingly larger warming or cooling spikes during these events. This explains why there was both a bigger increase between 2023 and 2024 and a bigger decline between 2024 and 2025 in the satellite record than in surface records.
The lower-tropospheric temperature records show large differences after the early 2000s. RSS shows an overall rate of warming quite similar to surface temperature records, while UAH and NOAA show considerably slower warming in recent years than has been observed on the surface.
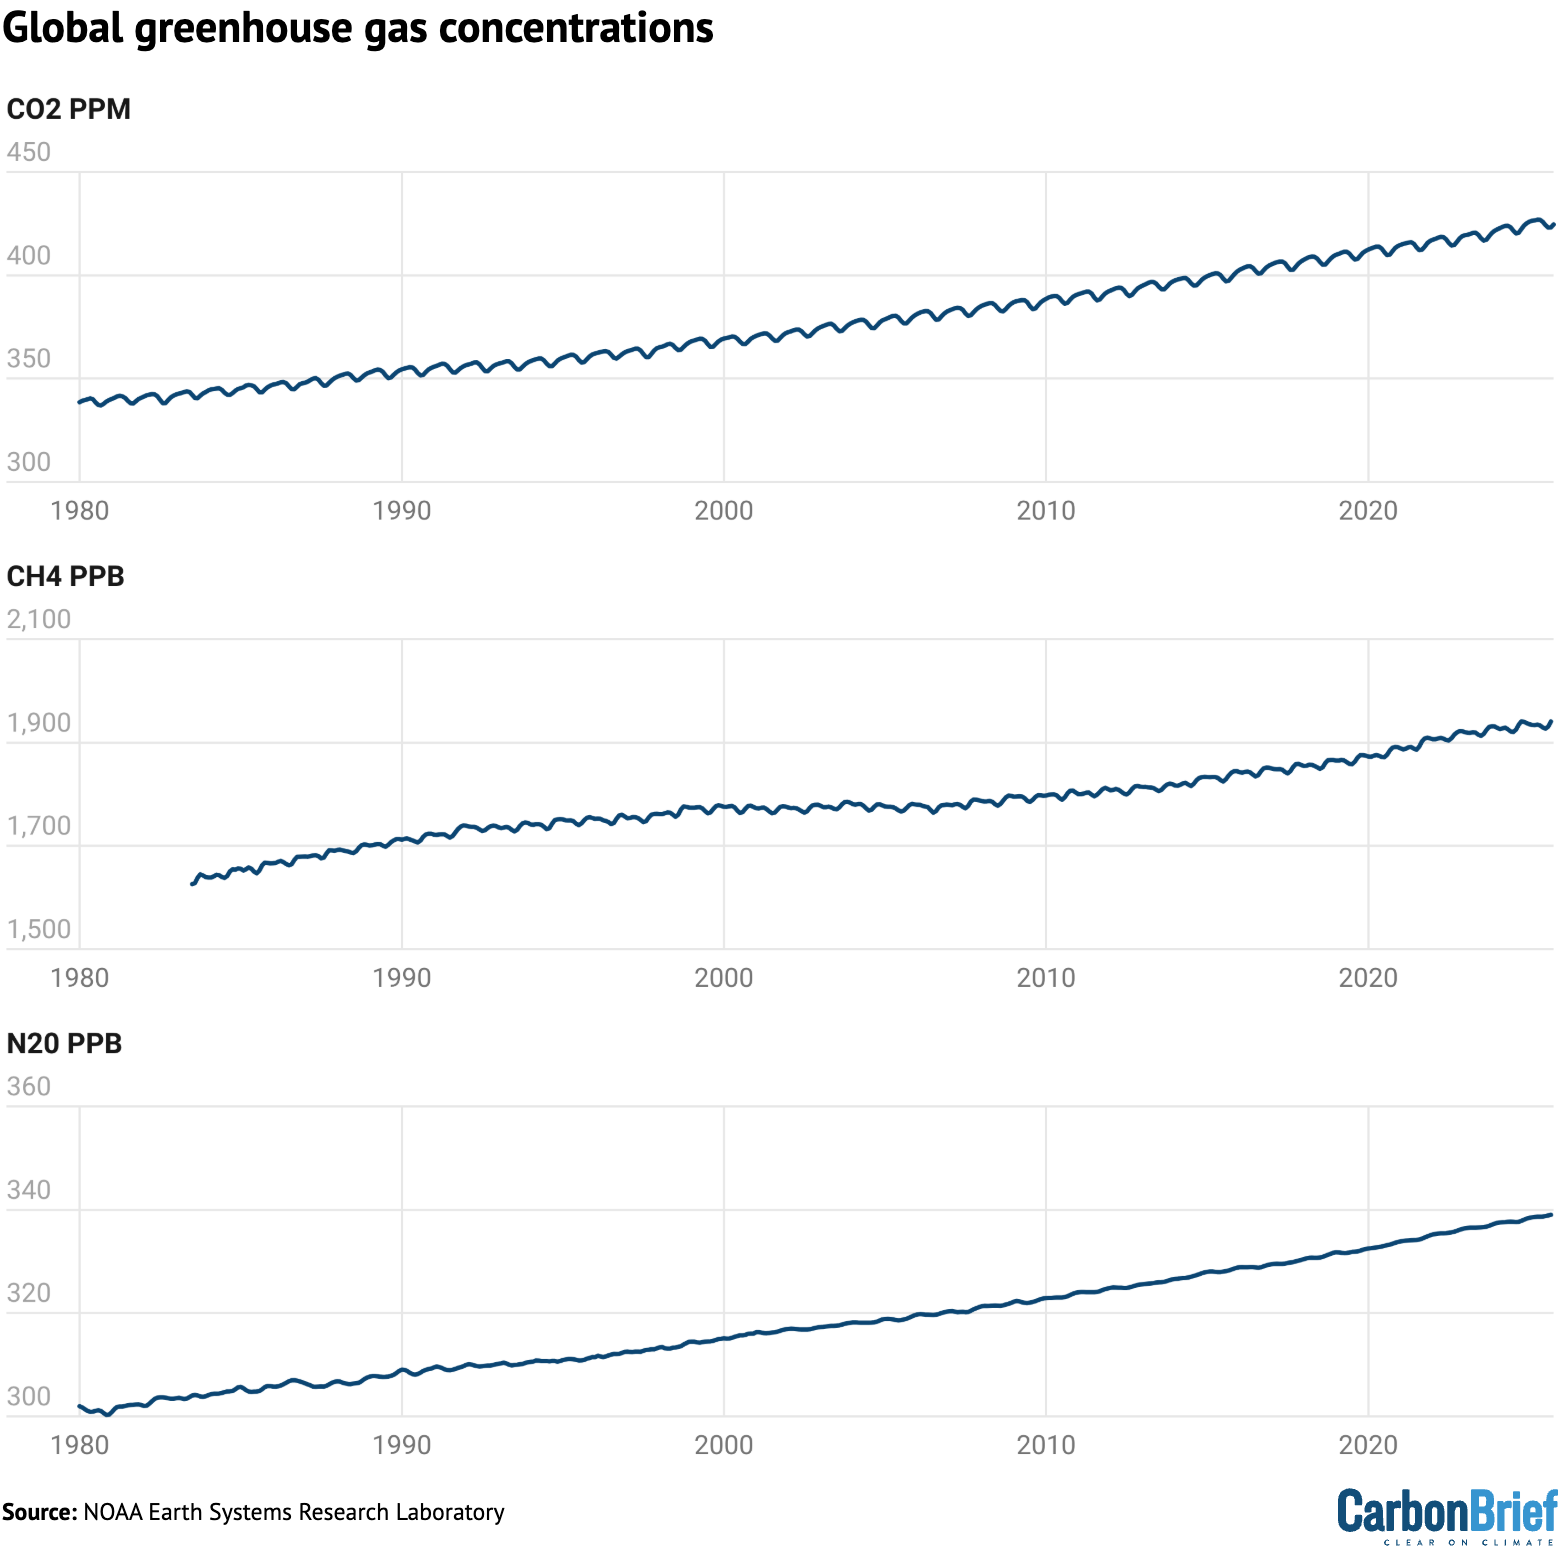
Greenhouse gas concentrations reach new highs
Greenhouse gas concentrations reached a new high in 2025, driven by human-caused emissions from fossil fuels, land use and agriculture.
Three greenhouse gases – CO2, methane (CH4) and nitrous oxide (N2O) – are responsible for the bulk of additional heat trapped by human activities. CO2 is by far the largest factor, accounting for roughly 42% of the increase in global surface temperatures since the pre-industrial era (1850-1900).
Methane accounts for 28%, while nitrous oxide accounts for around 5%. The remaining 25% comes from other factors including carbon monoxide, black carbon and halocarbons, such as chlorofluorocarbons (CFCs).
Human emissions of greenhouse gases have increased atmospheric concentrations of CO2, methane and nitrous oxide to their highest levels in at least a few million years – if not longer.
The figure below shows concentrations of these greenhouse gases – in parts per million (ppm) for CO2 and parts per billion (ppb) for methane and nitrous oxide – from the early 1980s through to October 2025 for CO2 and September 2025 for CH4 and N2O (the most recent data currently available).
Sea level is rising rapidly
Modern-day sea levels have risen to a new high, due to a combination of melting land ice (such as glaciers and ice sheets), the thermal expansion of water as it warms and changes in land water storage.
In recent years, there have been larger contributions to sea level rise from melting ice sheets and glaciers, as warmer temperatures accelerate ice sheet losses in Greenland and Antarctica.
Since the early 1990s, the increase in global sea level has been estimated using altimeter data from satellites. Earlier global sea levels have been reconstructed from a network of global tide gauge measurements. This allows researchers to estimate how sea level has changed since the late 1800s.
The chart below shows five different modern sea level rise datasets (blue lines), along with satellite altimeter measurements as assessed by AVISO (in black) after 1993. (As sea level rise data has not yet been released for the whole year, the 2025 value is estimated based on data through to November.)

Sea levels have risen by over 0.2 metres (200mm) since 1900. While sea level rise estimates mostly agree in recent decades, larger divergences are evident before 1980. There is also evidence of accelerating sea level rise over the post-1993 period when high-quality satellite altimetry data is available.
(To understand more on how climate change is accelerating sea level rise, read Carbon Brief’s explainer.)
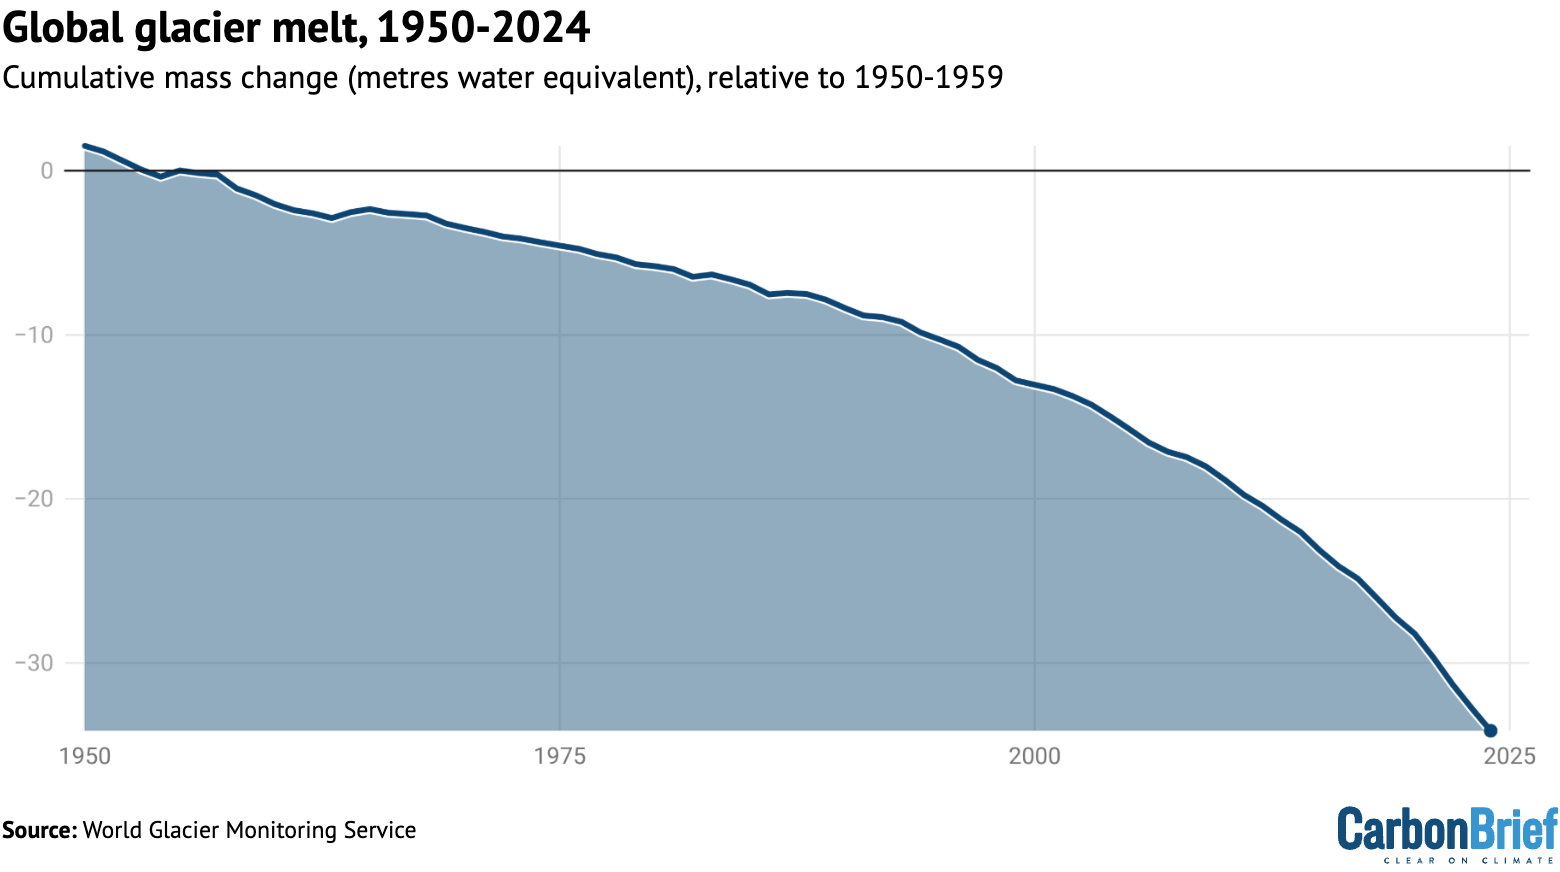
Shrinking glaciers and ice sheets
A significant portion of global sea level rise is being driven by melting glaciers on land.
Scientists measure the mass of glaciers around the world using a variety of remote-sensing techniques, as well as through GRACE measurements of the Earth’s gravitational field. The balance between snow falling on a glacier and ice loss through melting and the breaking off – or “calving” – of icebergs determines if glaciers grow or shrink over time.
The World Glacier Monitoring Service is an international consortium that tracks more than 130 different glaciers in 19 different regions around the world. The figure below shows the change in global average glacier mass from 1950 through to the end of 2024. (2025 values are not yet available.) Note that glacier melt is reported in metres of water equivalent, which is a measure of how much mass has been lost on average.
Greenland ice sheets have become a larger contributor to sea level rise in recent years due to accelerating loss of mass. The year 2025 was the 29th in a row where Greenland lost ice overall, with 105bn tonnes of ice lost over the 12 months from September 2024 to August 2025. Greenland last saw an annual net gain of ice in 1996.
The figure below shows the cumulative mass balance change – that is, the net ice loss – from Greenland between 1970 and 2025. The authors find that Greenland has lost around 6tn tonnes of ice over the past 50 years – more than 700 tonnes lost per person for every person on the planet.

Lowest winter Arctic sea ice extent
Arctic sea ice saw its lowest winter peak on record as well as its 10th-lowest summer minimum extent, while Antarctic sea ice saw its third-lowest minimum extent.
Both the Arctic and Antarctic were at the low end of the historical (1979-2010) range for most of 2025, with new daily lows recorded for Arctic sea ice extent in January, February, March, June and December.
The figure below shows both Arctic (red line) and Antarctic (blue line) sea ice extent for each day of the year, along with how it compares to the historical range (corresponding shading).

Looking ahead to 2026
There is reason for caution when estimating likely temperatures for 2026.
In 2023, temperatures were significantly higher than predictions made at the start of the year, while 2024 temperatures were towards the high end of annual predictions. Temperatures in 2025 were more in-line with predictions, albeit still on the higher side for three out of the four predictions included above.
There are currently weak La Niña conditions currently present in the tropical Pacific, which are expected to extend through February. This would somewhat suppress temperatures in the first half of the year. However, the latest forecasts suggest a growing likelihood of El Niño conditions developing by June, which may lead to warmer temperatures in late 2026 – and potentially much warmer temperatures in 2027.
Carbon Brief predicts that global average surface temperatures in 2026 are likely to be between the second and fourth warmest on record, similar to 2023 and 2025, at around 1.4C above pre-industrial levels.
This is the fourth published temperature prediction for 2026, after those already produced by the Met Office, NASA’s Dr Gavin Shmidt and Berkeley Earth.
The figure below shows the four different 2026 predictions compared to the average of eight different temperature records explored in this article. (These have been “normalised” to show 2026 warming relative to the 2023-25 average to allow a clear comparison, given that each of the predictions was originally presented for a different temperature record.)
Carbon Brief’s prediction of likely 2026 temperatures is based on a statistical model using the average temperature of the past year, the latest monthly temperature and projections of ENSO conditions over the first three months of 2026.

The Met Office, Dr Schmidt, Berkeley Earth and Carbon Brief estimates all have 2026 ending up as somewhere between the second- and fourth-warmest year on record, with the best estimate as being more or less tied with 2023 and 2025.
There is a very small chance that 2026 could end up beating 2024 as the warmest year on record, or end up below 2016 as the fifth or sixth warmest year.
However, with the growing likelihood of El Niño conditions developing in the second half of 2026, it is increasingly likely that 2027 will challenge 2024 for the title of the warmest year on record. The rate of warming has notably accelerated over the past 15 years and the period of exceptionally warm years that started in 2023 shows no signs of abating.


The post State of the climate: 2025 in top-three hottest years on record as ocean heat surges appeared first on Carbon Brief.
State of the climate: 2025 in top-three hottest years on record as ocean heat surges
After a four-year set up period, a fund to help vulnerable countries respond to climate impacts is facing criticism from Nigeria’s environment minister over delays in delivering aid, while its chief executive says the first disbursements will be made by the end of the year.
At an event at London Climate Action Week on Tuesday, Nigerian environment minister Balarabe Abbas Lawal said that whenever he goes to UN climate summits “we talk about loss and damage funds, and all these years nothing has been translated into action”.
He added that the fund currently “looks like a mirage”, and said that “a number of our governments are beginning to believe that COPs are just talk shops”.
The idea of addressing the loss and damage caused by climate change was first discussed at COP13 in 2007. A fund was agreed to at COP27 in 2022 to help vulnerable countries respond to climate emergencies, and it was officially set up the next year. Since then, the fund’s board and management have been working out the details of how it will work.
Ibrahima Cheikh Diong, a banker from Senegal, was appointed CEO in 2024. Referring to Lawal’s frustration, Diong told Climate Home News on Thursday that the fund is “moving according to plan”.
-
EU, UK lead push for electrification as “powerful weapon” against fossil fuels
A group of dozens of countries seeks to build momentum for a COP31 pledge to electrify 35% of global energy use by 2035 as an alternative to fossil fuels -
UN asks AI companies to reveal full environmental impacts
UN chief António Guterres says big AI firms should disclose the emissions, water and energy use of their data centres amid community opposition -
Did Colombia’s energy transition just come to a halt?
With promises to lift a ban on oil and gas exploration and scale back renewables support, Colombia’s new Tiger President could threaten the country’s clean energy shift


A call for funding requests, launched at COP30, closed on June 15. Projects – including those to strengthen responses to floods in Bangladesh and Lagos and improve water infrastructure in Jamaica – bid for a combined $250 million. Diong said that the fund’s board would decide which projects to fund at its next board meeting in the Philippines, starting on July 8.
“We hope that by the end of the year we can begin then to make the decision and see the funds going, so hopefully the frustration for Nigeria will be reduced”, he said, adding that “every time wasted, when it comes to loss and damage, is lives not saved”.
Funding concerns
While climate campaigners have called for tens of billion of dollars of funding a year, wealthy nations have promised the fund $822 million and delivered just $449 million – with countries like Italy, France and Luxembourg failing to pay in full.
A briefing paper prepared by the fund’s secretariat earlier this year warned that, unless fresh contributions are secured, the fund could run out of resources by the end of 2027.

Diong said that the fund intends to hold a replenishment round, where governments promise money, next year. In the meantime, as public finance “is being very difficult to mobilise”, the fund is looking at other sources of funding.
“What exactly that source of funding will be, we have to look at the potential, look at the feasibility and so on”, he said, so the fund can keep up with demand.
In an open letter in April, a group of climate campaigners called for developed countries to increase contributions to the Loss and Damage fund and introduce taxes on fossil fuel companies, financial transactions, luxury air travel and wealth to help finance it.
“Rich countries must be held strictly accountable for the devastation they have caused,” said Climate Action Network International head Tasneem Essop. “Their failure to fulfill their responsibility to the loss and damage fund is not just an oversight; it is a shameful betrayal of humanity.”
The post As Nigeria rails at loss and damage “mirage”, fund boss assures money is coming appeared first on Climate Home News.
As Nigeria rails at loss and damage “mirage”, fund boss assures money is coming
Climate Change
China Briefing 25 June 2026: Five-year plans passed | Critical-mineral tensions | Industrial decarbonisation plan
Welcome to Carbon Brief’s China Briefing.
China Briefing handpicks and explains the most important climate and energy stories from China over the past fortnight. Subscribe for free here.
Key developments
New five-year plans
GENERATION TARGET: China today released its 15th five-year plan for building a “new-type energy system”, according to finance news outlet Cailianshe. It said the plan covered topics including energy sources, power-market reform and China’s role in clean-energy supply chains and climate governance. The plan, published by the National Development and Reform Commission, stated that China will aim for clean energy to constitute 30% of power generation by 2030 – up from approximately 22% today. It also stated that wind and solar will become the “mainstay” of China’s power mix. The government will work to increase clean-energy consumption, such as by upgrading the grid to “accommodate” 900 gigawatts of distributed energy and promoting emerging solutions such as virtual power plants and hydrogen. The plan also urged the “strengthening” of coal’s role as a “bottom-line guarantee”.
IN THE WORKS: At a meeting on 11 June, China’s State Council approved the “15th five-year plan for building a beautiful China”, reported industry news outlet BJX News. The meeting readout noted the importance of “actively address[ing] climate change” and developing “green production and lifestyles”, it added. The next day, the Ministry of Ecology and Environment (MEE) approved a series of environment-related five-year plans, including the “15th five-year plan for a national response to climate change”, said business news outlet 21st Century Business Herald article. The full text of the plans is not yet available.
JOBS AND GOVERNANCE: A separate five-year plan on employment included calls to “unlock employment potential” by developing “new energy system” projects, according to current affairs outlet China News. The government also published a white paper on global governance that said the “general public truly feels that nations are taking action and that unity can overcome any obstacle” to address climate change, reported state news agency Xinhua. It added that the paper called on developed countries to “honor their commitments” on climate finance. Foreign minister Wang Yi said in a press conference that China aims to “innovate governance mechanisms” to address issues such as how countries can “achieve” a global low-carbon transition, Xinhua also reported.
Critical mineral barbs
REDUCE DEPENDENCIES: The Group of Seven (G7) major economies have stated that “no single country should supply more than 60% of their imports of rare earths”, reported Bloomberg, in “an effort to reduce their reliance on China”. The full communique, which does not mention China by name, said that diversifying supply chains was “urgen[t]”, due to “market concentration”, the “growing use of arbitrary trade restrictions” and the need to “reduce vulnerabilities”. In response, China’s foreign ministry urged the G7 to “stop disrupting the international trade order” with “self-made rules”.
EXPORTS BLOCKED: The Indonesian government’s new nickel production quotas and pricing rules could put $50bn of Chinese investment at risk, Chinese diplomats argued in a letter covered by the Financial Times. Lithium miners in Zimbabwe, including Chinese firms, are asking for more time to build local processing facilities ahead of a 2027 lithium concentrate export ban, said Reuters. Meanwhile, China restricted trade with two US rare-earth companies, in response to the US adding companies including CATL and BYD to a “blacklist”, said the Financial Times. China’s exports to Japan of rare earths used to make permanent magnets remain “negligible”, reported Reuters.
DIALOGUE URGED: EU member states have asked the European Commission to develop new trade instruments to deal with the “economic threat” posed by China, reported the Hong Kong-based South China Morning Post. Despite “combative rhetoric” ahead of the summit, the Financial Times reported that the 27 leaders opted for dialogue rather than immediate action to address “global macroeconomic imbalances”. Separately, the European Commission plans to impose tariffs on Chinese plug-in hybrid electric vehicles, reported German business newspaper Handelsblatt.
CLIMATE MINISTERIAL: The EU, China and Canada held a climate ministerial, in which Chinese environment minister Huang Runqiu said countries “must strengthen cooperation rather than retreat from it”, said Euronews. Climate outlet Tanpaifang reported that Huang also said COP31 should address “insufficient emission reduction efforts and financial support from developed countries”. According to a European Commission transcript, EU climate commissioner Wopke Hoekstra said: “We need to act for climate, but also for competitiveness and independence. We cannot afford to depend on third countries.”
Mandatory targets for energy users
NEW TARGETS: From August, the Chinese government will “set binding targets” for companies on how much low-carbon power and non-electric energy they must consume, said Bloomberg. It added that targets will be set for how much low-carbon power provinces must absorb into their grids. Provinces and “key energy-consuming industries” will see their uptake of clean energy monitored on a quarterly basis and be subject to annual assessments by the State Council, said industry news outlet International Energy Net.
END-USER PRESSURE: The announcement marks the first time that China has established targets for non-fossil energy consumption at the “end-user level”, reported economic news outlet Jiemian. It added that the previous system, which only covered power, placed the responsibility for absorbing renewable energy into the grid “primarily” onto local governments and power grid companies.
SUPPORTING THE MARKET: The new measures will “help address grid integration challenges and promote better utilisation of renewable energy”, an official at the National Energy Administration told reporters, according to Xinhua. The official said it would also help boost demand for other low-carbon industries, such as “green hydrogen, ammonia and methanol”. Liu Guobin, vice-president of the China Electric Power Planning and Engineering Institute said in an “explanation” posted on International Energy Net that the measures would also “convey clear…expectations to the market” for the long-term outlook for renewable energy, “guiding the rational allocation of investment”.
More China news
- BECALMED: China’s thermal power generation rose 2.1% year-on-year in May, as “lower wind speeds curbed renewable energy growth”, reported Reuters.
- TRUCK TARGET: The government issued a new plan for developing “new-energy heavy duty trucks (HDTs)” that aims to have sales of electric, hydrogen and other low-carbon HDTs account for 40% of new truck sales by 2030, said Xinhua.
- SUPERMASSIVE SYSTEM: China’s total power capacity reached 4,000 gigawatts in May, reported BJX News, larger than that of the US, EU, India, Russia and Japan combined. Coal’s share of the capacity mix fell to 32%, while the non-fossil share rose to 62%.
- EXPORT DRIVER: China’s exports of electric vehicles (EVs) rose 54% year-on-year in May to $10bn by value and lithium-battery exports “rose 37% to $8bn”, but solar cell exports fell 7% by value to $2bn, said Caixin. The thinktank Ember found that Chinese EV exports to south-east Asia, particularly Thailand and the Philippines, reached an “all-time high” of $1.2bn.
- ONGOING RISK: The heavy rainfall seen throughout June, as well as drought, is likely to continue during China’s flood season, said the Ministry of Emergency Management in comments covered by Jiemian.
- PROJECTION PUSHBACK: The China Energy Research Society’s Wang Weiquan described projections by BloombergNEF of China’s emissions reduction and share of coal in the power mix as “overly optimistic” and “even radical”, according to the state-run newspaper China Daily.
Spotlight
What is in China’s new three-year action plan for industry?
China has issued a new action plan for energy conservation and reducing carbon emissions across nine heavy industries.
In this issue, Carbon Brief examines how the plan will impact China’s industrial development and decarbonisation.
China will conduct an “intensive campaign for energy conservation and carbon reduction upgrades” across heavy industry between 2026 and 2028.
The plan targets nine key industries: steel; electrolytic aluminum; cement; flat glass; oil refining; ethylene; synthetic ammonia; methanol; and coal-fired power.
After 2028, it said that production capacity that does not meet efficiency standards will be phased out and that efforts will be broadened to other industries.
Combined, power and industry make up the vast majority of China’s emissions profile.
Emissions in some of these sectors – notably, steel and cement – have been falling. However, chemical-industry emissions have experienced double-digit growth.
China’s power sector, which generates the majority of its electricity through coal, is responsible for around 40% of the country’s total carbon dioxide (CO2) emissions.
Focused on efficiency
The plan outlined several measures for companies to take to reduce their energy use and emissions profile.
According to a Carbon Brief count, the majority are focused on energy efficiency, such as promoting high-efficiency industrial processes and upgrading energy-consuming equipment.
More than 70% of China’s steel, aluminium, cement and flat glass capacity does not meet energy efficiency benchmarks, said a government official in a Q&A published by the National Development and Reform Commission (NDRC).
Yang Zhou, senior advisor China at Agora Energiewende, told Carbon Brief that the policy will “pick the last lowest hanging fruit” in terms of eliminating low-efficiency capacity. After this, she said, the focus will turn to entering a “deep-water” phase of decarbonising industrial capacity, as well as making it more efficient.
Some of the measures that companies are encouraged to take in the plan do directly link to decarbonisation. These include developing “hydrogen metallurgy” and sourcing low-carbon materials and fuels, as well as increasing electrification and renewable power usage.
The coal-power industry should improve flexibility, decouple combined heat and power operations and integrate biomass and renewable energy into their operations, it said.
Coal plants are expected to reduce coal consumption per kilowatt-hour (kWh) of electricity by “at least five grams of standard coal” and carbon emissions per kWh by 10%-20%, if not more.
The document said that the share of coal-fired power capacity that meets energy efficiency benchmarks should improve by 15 percentage points by 2028. This rises to 20 percentage points for the other eight industries.
By 2028, according to the NDRC, the plan aims to cut energy use by more than 100m tonnes of standard coal per year and reduce CO2 emissions by more than 200m tonnes.
Supporting business
Companies will receive support from the central government, which will subsidise 20% of the total investment that “approved” projects require.
Provinces should “fully leverage” pricing mechanisms to encourage retrofitting, said the policy.
Local policymakers can now add a surcharge of up to 0.1 yuan ($0.15) per kWh to market-traded electricity prices for non-compliant producers – which finance outlet Caixin said was a “central” tool for enforcement.
The South China Morning Post quoted an unnamed analyst, however, saying the policy may not “deliver its intended effects”, as some industries still receive subsidised electricity from local governments.
Companies will also be able to use verified CO2 emission reductions from approved projects to “offset” emissions from “new, renovated or expanded” dual-high projects. For industries covered by China’s carbon market, this may be formalised in their emissions allowances.
The NDRC official said that support should be provided to “ensure they receive reasonable returns on their carbon emission allowances”.
The policy “seeks to strike a balance” between energy security and climate goals, rejecting the “radical thinking of ‘one-size-fits-all shutdowns and phase-outs’”, according to a widely-read commentary by Sprinting Power Worker, a “self-media” WeChat account.
“For industries such as coal power, steel and cement, a gradual capacity reduction is expected due to market forces,” said Yang. She added:
“For growing sectors like chemicals and non-ferrous metals, China’s strategy is to expand capacity, [albeit] increasingly concentrated, scaled-up and efficient. Continued decarbonisation will require large-scale deployment of solutions like electrification, green power-green hydrogen coupling and circular economy.”
Watch, read, listen
SULPHURIC SLOWDOWN: Rhodium Group published an analysis of how China’s efforts to restrict exports of sulphuric acid could impact global electrification efforts.
ARCTIC ACTIVITY: The Circumpolar podcast explored the variety of interests, including energy and the environment, driving China’s actions in the Arctic.
TRANSITION IN NUMBERS: Thinktank Agora Energiewende hosted a webinar on its new report, which outlined key trends in China’s energy transition.
CARBON TAX: The Center for Strategic and International Studies looked into how China is responding to the EU carbon border adjustment mechanism.
4.9%
The amount by which China’s oil consumption is expected to fall in 2026 compared to the year before, according to a report by a thinktank under oil giant PetroChina, covered by Reuters. It said the decline is due to the “pivot to new energy and high oil prices due to the Iran war”, according to the report.
New science
- Economically developed Chinese cities “transferred” 42% of their greenhouse gas emissions related to plug-in electric vehicles to less developed cities in 2020, “substantially increasing” the recipients’ climate mitigation costs | Nature Cities
- Renewable energy development “significantly reduces” urban-rural income inequality in Chinese cities | World Development
- Grain trading between Chinese provinces increased more than fivefold between 1980 and 2020 and production shifted northward, driving a more than 217% increase in “embodied nitrogen losses and greenhouse gas emissions” | Nature Food
Recently published on WeChat
China Briefing is written by Anika Patel, with contributions from Lekai Liu. It is edited by Simon Evans. Please send tips and feedback to china@carbonbrief.org

The post China Briefing 25 June 2026: Five-year plans passed | Critical-mineral tensions | Industrial decarbonisation plan appeared first on Carbon Brief.
Twice as many animals died due to heat stress en route to slaughterhouses during the UK’s record-hot summer in 2025 compared to 2024, according to new Carbon Brief analysis.
Government figures showed that nearly 6,600 animals – mostly chickens – died in transport as a result of the sweltering summer heat in England and Wales from June to August 2025.
This compared to 3,100 in summer 2024 and no official cases in summer 2023.
These figures were still below the more than 18,500 deaths recorded in the summer of 2022 when UK temperatures hit 40C for the first time, as previously reported by Carbon Brief.
The deaths are a “horrifying reminder of what happens when animals are treated as cargo”, said an animal-rights group spokesperson.
Detailed descriptions included in the data on the deaths highlighted thousands of animals dying amid heat stress, high humidity levels and long journeys.
Thousands of animals also died due to cold, wintry conditions, with more than 13,000 deaths recorded between December 2024 and February 2025 – almost double the previous winter.
Heat deaths
Carbon Brief has analysed recent years of “dead on arrival” data focused on livestock that died due to heat or cold stress en route to slaughterhouses.
The data was obtained through the UK Freedom of Information (FOI) Act from the Food Standards Agency (FSA), which is responsible for the compliance of slaughterhouses in England and Wales.
At least 1m chickens die in the UK each year while being transported to slaughterhouses due to suffocation, poor transport procedures and other issues, reported the Bureau of Investigative Journalism in 2018 .
Pigs, cows, sheep and other animals also die in this way in smaller numbers.
The new data showed that 6,595 animals died due to heat stress en route to abattoirs between June and August 2025, which was the warmest summer on record in the UK.
According to the Met Office, human-caused climate change made this summer heat 70 times more likely to occur.

Carbon Brief requested non-publicly accessible details of “dead on arrival cases” that were categorised as “suspected heat/cold stress”.
Each incident contained a detailed description written by a vet with supporting evidence about the condition of the animals, the transport conditions and the suspected cause of death. These are filed to the FSA.
The information showed that certain individual days had particularly high death tolls. Almost 1,000 chickens died in a number of incidents during a heatwave on 11 July 2025. Some chickens showed visible signs of heat stress, such as panting and immobility, the reports said.
On 12 August, amid more high temperatures, 2,154 chickens died in heat-stress incidents.
Body temperatures of some of the chickens that died on this day were as high as 46C.
A chicken will die if its body temperature exceeds 45C and it should ideally stay as close to 41C as possible, according to a 2005 document from the Department for Environment, Food & Rural Affairs (Defra).
The table below shows the total number of heat- and cold-related deaths of livestock in recent years, based on the data obtained through FOI.
The “dead on arrival” information covered every summer and winter since 2023, alongside the summer of 2022.
The figures were likely an underestimate of the total number of livestock deaths due to high or low temperatures, as they only included deaths with “suspected cold/heat stress” as a listed category.
However, the incident descriptions in many other deaths mentioned high and low temperatures as contributing factors, despite the ultimate cause of death not being labelled as such. These were not included in Carbon Brief’s tally.
The figures covered deaths in England and Wales. Scotland and Northern Ireland do not record the cause of deaths en route to slaughterhouses, so it is not possible to single out the cases linked to high or low temperatures.
Preventing deaths
These livestock deaths are a “horrifying reminder of what happens when animals are treated as cargo”, says Alex Harman, campaigns manager at animal rights group Animal Aid. He tells Carbon Brief:
“These 6,600 individuals [in summer 2025] did not just die, they suffered prolonged, agonising heat exhaustion inside metal containers – anyone experiencing the UK’s heatwave this week will be able to empathise.”
Climate change is “simply amplifying the violence already built into animal farming”, he says, adding that the only “compassionate, logical” solution is to “stop viewing animals as products and urgently transition to a plant-based food system”.

Pigs and chickens cannot sweat and face difficulties cooling down on very hot days.
Cramped or long journeys can exacerbate this, combined with high humidity levels, sometimes upwards of 80%, the livestock data showed.
Abigail Penny, the executive director of Animal Equality UK, tells Carbon Brief that “these same scenes of extreme animal suffering play out every summer and, if nothing is done, it’s only going to get worse”.
Workers transporting animals during extreme weather conditions are expected to put in place measures to protect them, according to UK government guidance.
These measures can include ensuring water and ventilation systems function properly on vehicles, avoiding travel during the hottest or coldest parts of the day and recognising signs of heat and cold stress in animals.
The FSA said that the number of “dead on arrival” incidents caused by cold and heat stress increased by more than 50% between April 2024 and March 2025 compared to the same period the year prior.
The FSA and Defra declined Carbon Brief’s request to comment on the new figures.

Cold deaths
Thousands of animals also die due to cold stress while travelling to slaughterhouses each year. Carbon Brief assessed data for these deaths in the winters of 2023-24 and 2024-25.
At least 13,057 livestock animals died due to cold weather conditions between December 2024 and February 2025. This is more than double the number – 6,981 – that died the previous winter.
On 6 February 2025 alone, 4,056 poultry deaths were reported due to cold weather impacts.
Some livestock also died due to cold conditions in the summer months.
For example, 326 animals died amid cold weather in the summer of 2023. No official heat-related deaths were recorded in that period, but a number of incidents referred to hot-weather conditions or heat stress as contributing factors.
Overall, 2023 was a very warm year in the UK, with soaring temperatures in June and September. At least 3,103 animals died from heat stress in September, the figures also showed.
Conditions were cooler and wetter in July and August, which may have contributed to the absence of heat-stress deaths.
Most cold deaths during warmer months occurred in the early hours of the morning or overnight when temperatures dropped, the FOI data shows.
On 28 August 2025, for example, 134 chickens died due to cold stress. The incident description outlined that the animals were “very wet”, dirty and had few feathers, which can reduce a chicken’s ability to hold warmth.
The animals were transported overnight to a slaughterhouse and “suffered distress and pain” because of the weather and other factors, the description noted.


The post Livestock heat deaths in transit doubled in UK record-hot summer of 2025 appeared first on Carbon Brief.
Livestock heat deaths in transit doubled in UK record-hot summer of 2025


-
Greenhouse Gases11 months ago
Guest post: Why China is still building new coal – and when it might stop
-
Climate Change11 months ago
Guest post: Why China is still building new coal – and when it might stop
-

 Greenhouse Gases2 years ago
嘉宾来稿:满足中国增长的用电需求 光伏加储能“比新建煤电更实惠”
-

 Climate Change2 years ago
嘉宾来稿:满足中国增长的用电需求 光伏加储能“比新建煤电更实惠”
-

 Renewable Energy8 months ago
Sending Progressive Philanthropist George Soros to Prison?
-
Climate Change2 years ago
Bill Discounting Climate Change in Florida’s Energy Policy Awaits DeSantis’ Approval
-

 Carbon Footprint2 years ago
US SEC’s Climate Disclosure Rules Spur Renewed Interest in Carbon Credits
-
Greenhouse Gases12 months ago
嘉宾来稿:探究火山喷发如何影响气候预测