

Solar energy is experiencing a remarkable surge in the U.S., driven by significant new installations and strong policy support. This growth is largely due to developers completing projects in the last year and opening new opportunities in 2025. Amid this surge, SolarBank, a leading North American solar company, is pivotal in developing commercial, industrial, and community solar projects in the U.S.
Thus, as the U.S. energy landscape undergoes a major shift, wind and solar are set to lead the charge in powering the nation’s future. With this transformation underway, solar energy will play an even bigger role in the coming years.
Solar Power Fuels America’s Clean Energy Boom
According to recent EIA’s Short-Term Energy Outlook projections, solar power generation is set to experience remarkable expansion, rising 75% from 163 billion kilowatt-hours (kWh) in 2023 to 286 billion kWh by 2025.
Supply chain issues, grid connection delays, and tariff increases on imported modules pose challenges, but federal and state incentives continue to support solar’s momentum. While obstacles remain, reforms and incentives offer hope for accelerated growth in the coming years.
In 2023, renewables—including wind, solar, hydro, biomass, and geothermal—accounted for 22% of the U.S.’s 4,017 billion kWh of electricity generated, amounting to 874 billion kWh.

Moving on, IEA says, the U.S. is set to add significant solar PV capacity, leading the renewable energy surge with nearly 500 GW projected by 2030. Utility-scale solar sees steady growth, driven by the Inflation Reduction Act (IRA) and federal tax credits, even as residential expansion slows due to California’s new net-metering rules and high interest rates.
IEA U.S. Solar Energy 2030 Forecast

Nonetheless, America’s solar sector continues to expand rapidly, with significant growth in both stand-alone utility-scale solar capacity and hybrid solar-plus-storage installations.
Stand-Alone Utility-Scale Solar Capacity
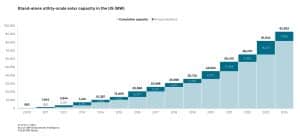
According to S&P Global’s latest solar report, in 2024, annual additions to stand-alone utility-scale solar capacity reached around 11,190 megawatts (MW), bringing the total capacity to an impressive 92,832 MW. This increase underscores the growing role of large-scale solar projects in meeting the nation’s energy needs.
However, utility-scale solar in the U.S. still lags behind wind energy in terms of total operating capacity. The country currently operates about 116 GW of solar capacity. This excludes residential and most behind-the-meter systems. Around 93 GW comes from stand-alone projects without battery storage or other technologies.
Hybrid Solar-Plus-Storage
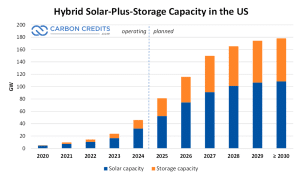
The hybrid solar-plus-storage segment is also experiencing remarkable progress. Data from S&P Global indicates that by October 1, 2024 (YTD), annual additions in this category include 6,257.2 MW of solar capacity and 2,814.8 MW of storage capacity. These additions bring the total operating hybrid solar capacity to 22,826.2 MW and the total storage capacity to 9,925.7 MW.
This growth reflects the increasing integration of energy storage systems with solar installations, which enhances grid reliability and enables efficient energy use.
The expansion of both stand-alone and hybrid solar capacities demonstrates solar’s critical contribution to the U.S. energy transition and its ability to support a cleaner, more sustainable power grid
The Solar Industry Thrives Amid Federal Policy Shifts
A report from PV Magazine sheds light on the current hurdles in the U.S. solar industry as federal policy debates intensify. There are ongoing discussions about scaling back the Inflation Reduction Act (IRA) and cutting support from the Department of Energy’s Loan Programs Office, which has raised concerns within this sector.
New tariffs on Chinese imports could increase the cost of solar projects, potentially slowing installations in the short term. However, the rapid growth of the domestic solar supply chain offers a silver lining. This growth, particularly in Republican-majority states, highlights the bipartisan support for clean energy investments.
Local Momentum and Distributed Solar Opportunities
Moreover, this expansion of local manufacturing could play a key role in reducing the impact of potential policy rollbacks. As a result, the long-term growth prospects of the solar industry remain strong, and it continues to be a vital part of the nation’s renewable energy future.
Notably, renewable energy projects have already brought in $106 billion in investments and created thousands of jobs across U.S. communities. Public demand for affordable, clean energy remains strong, especially in areas benefiting from solar projects. This local momentum will likely keep solar growing, even if federal incentives face cuts.
Furthermore, distributed solar systems offer a major opportunity. These systems deliver power where it’s needed. This reduces costs and boosts energy independence. Federal incentives, like the IRA’s domestic content bonus, have encouraged developers to use local materials, supporting the industry’s growth.
Looking forward, many solar projects will focus on energy communities. This shift signals continued solar expansion and a bright future for the industry in the U.S., with solar playing a key role in sustainable, localized energy solutions. One such company, leading by example is SolarBank.
SolarBank: Powering a Sustainable Future with Innovative Solar Solutions
In the age of solar, SolarBank is delivering clean and renewable energy solutions for the digital age. Listed on NASDAQ as SUUN, the company believes in “harnessing the power of the sun to provide sustainable energy as long as it shines.”
With a market cap of $53.33 million and an enterprise value of $53.60 million, SolarBank focuses on driving sustainable profit growth. Its top solar projects include Ontario’s small FIT solar gardens and New York’s community solar farms, which will expand into large-scale data center projects over 100 MW.
- It projects the North American solar PV market to grow to $120.74 billion by 2027, with a remarkable compound annual growth rate (CAGR) of 21.7% from 2020 to 2027.
This strong growth highlights the increasing demand for solar energy solutions across the region. Furthermore, the company strategically targets carbon-intensive markets with high electricity costs and favorable renewable energy policies.
It is expanding its expertise in rooftop and ground-mount solar. It is also moving into commercial and industrial behind-the-meter projects, battery storage, EV charging stations, and data center power solutions. These efforts meet the rising demand for low-carbon digital infrastructure.
More Than a Decade of Strong Revenue Growth
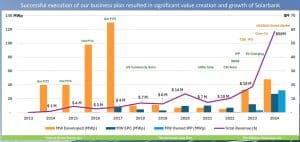
Source: SolarBank
Advancing Community Solar Initiatives
As mentioned earlier, community solar is significantly reshaping the U.S. energy landscape. As of 2023, 23 states and the District of Columbia have implemented policies supporting community solar projects.
These efforts have resulted in over 8 GW of installed capacity, with projections indicating growth to 14 GW by 2028, driven by an annual expansion rate of 1.5 GW. Moreover, the deployment of community solar-plus-storage systems is expected to rise by 219% by 2028.
Notably, SolarBank is also developing community solar projects in New York and Maryland, with over 250 MW currently in progress.
SolarBank’s $49.5M Qcells Deal
The company recently announced a $49.5 million deal with Qcells, a subsidiary of South Korea’s Hanwha Solutions, to sell four solar projects in upstate New York. These ground-mount projects—Gainesville, Hardie, Rice Road, and Hwy 28—have a combined capacity of 25.577 MW and have passed the CESIR process, confirming grid connection feasibility.
Under engineering, procurement, and construction (EPC) agreements, Qcells will develop the sites. SolarBank will manage operations and maintenance post-construction, with the projects serving as community solar systems, providing shared clean energy benefits without the need for home installations.
Supporting Renewable Energy for Data Centers
Electricity use from cloud computing, AI, and cryptocurrency is set to double by 2026, pushing companies to invest heavily in clean energy. And this rising demand is adding about 15 GW of renewable energy capacity each year.
These investments not only meet power needs but also boost brand image, improve resilience, and comply with stricter regulations. SolarBank supports this shift by delivering tailored energy solutions for modern industries.
Expands into BESS with $3M Boost
SolarBank Corporation is advancing its clean energy strategy by entering the battery energy storage market with $3 million in financing from RE Royalties Ltd. The funds will support three 4.99 MW Battery Energy Storage System (BESS) projects in Ontario.
The company got involved in the projects through its $45 million acquisition of Solar Flow-Through Funds Ltd., which was completed in July 2024. It aims to capitalize on the market forecast by Fortune Business Insights that predicts project growth at a 16.3% annual rate and reaching $31.2 billion by 2029. Thus, this acquisition expanded the company’s renewable energy assets and opportunities in energy storage.
SolarBank’s Strong Visibility to Continued Growth
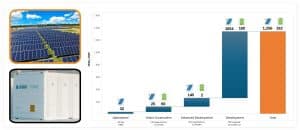
In conclusion, solar energy’s rapid expansion is crucial to the U.S. energy transition, offering a reliable path to decarbonize the power sector. SolarBank, through its focus on commercial, industrial, and community solar projects, is playing a key role in this shift. As technology advances and supportive policies continue, solar’s growing influence will help shape a cleaner and more sustainable energy future
- FURTHER READING: Top Solar Titans and How They Power the Green Energy Transition
Disclosure: Owners, members, directors, and employees of carboncredits.com have/may have stock or option positions in any of the companies mentioned: SUUN.
Carboncredits.com receives compensation for this publication and has a business relationship with any company whose stock(s) is/are mentioned in this article.
Additional disclosure: This communication serves the sole purpose of adding value to the research process and is for information only. Please do your own due diligence. Every investment in securities mentioned in publications of carboncredits.com involves risks that could lead to a total loss of the invested capital.
Please read our Full RISKS and DISCLOSURE here.
The post SolarBank Sparks Solar Surge: A Bright Future for the U.S. Renewable Energy appeared first on Carbon Credits.

EU carbon credit claims changed on 27 September 2026, the day the Directive (EU) 2024/825 began to apply across the European Union. The change is narrow. It changes how a company can talk about the credits it buys. A product can no longer be called neutral on the strength of compensation alone; however, every specific, evidenced statement about what a company measured, reduced, and funded stays fully available.

The post Promoting Improved Cooking Practices in Nigeria appeared first on Terrapass.



-
Climate Change1 year ago
Guest post: Why China is still building new coal – and when it might stop
-

 Greenhouse Gases2 years ago
嘉宾来稿:满足中国增长的用电需求 光伏加储能“比新建煤电更实惠”
-
Greenhouse Gases1 year ago
Guest post: Why China is still building new coal – and when it might stop
-

 Climate Change2 years ago
嘉宾来稿:满足中国增长的用电需求 光伏加储能“比新建煤电更实惠”
-

 Renewable Energy12 months ago
Sending Progressive Philanthropist George Soros to Prison?
-
Climate Change2 years ago
Bill Discounting Climate Change in Florida’s Energy Policy Awaits DeSantis’ Approval
-
Greenhouse Gases1 year ago
嘉宾来稿:探究火山喷发如何影响气候预测
-

 Climate Change2 years ago
Analysis: China’s CO2 falls 1% in Q2 2024 in first quarterly drop since Covid-19