

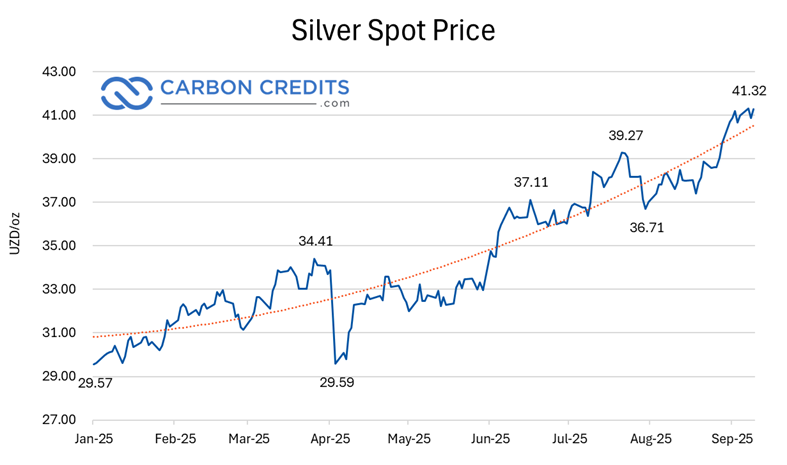
Silver prices are making headlines once again as the metal approaches its highest levels in more than a decade. On September 10, 2025, silver traded in the range of $41 to $42 per ounce in global markets, holding near levels not seen since 2011.
In the United States, the silver spot price stood at $41.2 per troy ounce, with futures trading slightly higher at around $41.50 per ounce. The day’s trading range stretched between $41.44 and $42.12, showing strong investor activity.
In India, one of the largest silver markets, the Multi-Commodity Exchange (MCX) saw silver climb to around ₹125,000 per kilogram. That represents a nearly 45% gain so far in 2025, outpacing the performance of both gold and the country’s stock markets.
This price surge has placed silver at the center of global commodity discussions, drawing comparisons with gold’s record-breaking rally.
What Is Driving Silver Higher?
Several forces are converging to push silver toward decade-high levels.
One of the most important drivers is monetary policy. With the U.S. Federal Reserve expected to cut interest rates later this year, both the U.S. dollar and bond yields have weakened.
For investors, this lowers the opportunity cost of holding precious metals. These metals don’t pay interest or dividends, but they usually retain value during economic uncertainty.
At the same time, silver plays a unique dual role. Like gold, it is a safe-haven asset, often sought out during times of geopolitical tension or financial instability. Yet silver also has extensive industrial uses, making it more sensitive to global economic trends.
The demand from industries such as electronics, semiconductors, and especially renewable energy is particularly important. Silver is a critical material in solar panels, where it is used in photovoltaic cells to conduct electricity.
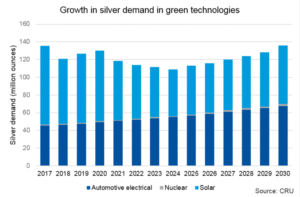
As countries accelerate their shift to cleaner energy, demand for silver in solar technology is growing rapidly. Electric vehicles (EVs) and 5G technology need a lot of silver. This boosts long-term demand even more.
In July 2025, the U.S. Department of the Interior added silver to its draft list of critical minerals, recognizing its strategic importance for clean energy technologies. The designation highlights silver’s essential role in solar panels, electronics, and the broader transition to a low-carbon economy
- SEE MORE: U.S. Releases New Draft Critical Minerals List: Silver and Copper Join the Clean Energy Race
Silver vs. Gold: A Tale of Two Metals
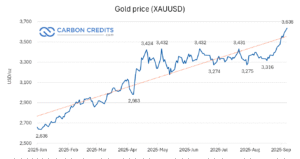
The silver rally is unfolding alongside gold’s historic surge. On the same day, silver touched $41, and gold set a new record at $3,671 per ounce. Both metals are gaining from investors looking for safety in uncertain times. However, their price trends are different.
The gold-to-silver ratio, which measures how many ounces of silver are equal to one ounce of gold, remains at elevated levels historically. A high ratio suggests silver may be undervalued compared to gold, leading some analysts to argue that silver could have more room to rise.
For investors, silver’s lower entry price compared to gold also makes it an attractive option. Retail investors who may find gold too expensive often turn to silver as a more accessible precious metal investment. This affordability factor could bring additional momentum if gold continues to climb to new highs.
Flashback to 2011: Will History Repeat?
To understand today’s silver price rally, it helps to look back at history. The last time silver traded near these levels was in 2011, when it spiked close to $50 per ounce. At that time, global markets were still healing from the 2008 financial crisis. Investors put their money into safe-haven assets.
The rally was quick but brief. Silver prices fell as monetary policy tightened and demand weakened. That history brings up a key question for today’s market:
Will silver keep its momentum, or will it drop again when central banks change their strategies?
Some experts believe this rally could last longer. They point to silver’s rising industrial demand, which is linked to the energy transition. Unlike in 2011, silver today has a stronger fundamental base beyond just investment demand.
India’s Silver Fever: Fueling Global Momentum
India plays an especially important role in silver demand. The country has long been a major consumer of precious metals, and silver is widely used in jewelry, ornaments, and investment products.
In 2025, the MCX reported silver prices hitting a record high of ₹125,000 per kilogram. Some analysts say the rally might reach ₹150,000 if the momentum keeps going.
Silver’s strong returns this year have surpassed equities and gold for Indian investors. This makes silver one of the most appealing assets in the country’s commodity markets.
India’s rising demand affects global prices because it makes up a large part of silver use worldwide.
Green Silver: Mining Meets Clean Energy Goals
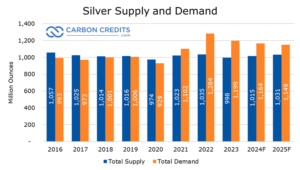
While demand for silver continues to rise, supply growth has been slower. Silver is mined both as a primary product and as a byproduct of other metals such as lead, zinc, and copper. Global mining output has struggled to keep pace with growing demand, tightening the market balance.
Another factor shaping the silver industry is sustainability. Mining companies face growing pressure to cut carbon emissions, use renewable energy, and lessen their environmental impact.
Silver plays a vital role in clean technologies, especially solar energy. Because of this, there’s increasing focus on making sure its production meets global climate goals.
Who’s Leading Silver’s Green Shift?
Major mining companies aim for net-zero by 2050. Some are already using renewable energy in their operations. This adds to silver’s investment story. It’s not just a metal for clean energy; the industry is also moving toward more sustainable practices.
Investors want to be sure that silver production meets environmental, social, and governance (ESG) standards. Several of the world’s largest silver producers have introduced ambitious sustainability goals:
Fresnillo plc (Mexico):
The company is the biggest primary silver producer in the world. The company plans to cut its carbon footprint by switching to renewable energy for its operations. The company aims for a 50% cut in greenhouse gas emissions by 2030. It has started using solar and wind power at its mining sites in Mexico.
Pan American Silver (Canada):
Pan American has pledged to reach net-zero greenhouse gas emissions by 2050. It has invested in water recycling systems. It supports energy efficiency programs. It also protects biodiversity around its mining projects in South America. The company also publishes detailed annual sustainability reports that track emissions, safety, and community engagement.
First Majestic Silver (Canada/Mexico):
First Majestic has focused on reducing its environmental impact by upgrading processing technologies that minimize water and chemical use. The company has also increased the share of hydropower and solar energy in its electricity mix. First Majestic also backs community development in its operating regions. This ties sustainability to social responsibility.
Hecla Mining (U.S.):
As one of the oldest U.S. silver producers, Hecla has modernized its operations to improve safety and reduce emissions. The company has set a net-zero by 2050 goal and is currently working on electrifying parts of its mining fleet. Hecla also highlights worker safety and inclusion programs as part of its ESG priorities.
These efforts highlight an important trend. The silver industry is supplying materials for clean energy tech. At the same time, it is also undergoing its own green transformation. For investors, silver companies with strong ESG strategies might gain from rising demand and good sustainability ratings.
The Road Ahead: Can Silver Hold the Shine?
Looking ahead, the outlook for silver depends on a mix of short-term monetary policy and long-term industrial trends.
In the near term, the Federal Reserve’s decision on interest rates will be critical. A rate cut could weaken the dollar further and support additional gains in both gold and silver. However, if U.S. economic data surprises to the upside, it could dampen expectations and cool off the rally.
Over the longer horizon, silver’s industrial demand appears solid. With global investment in solar energy and EVs accelerating, silver’s role as a “green metal” is likely to remain strong. Supply constraints could amplify this trend, pushing prices higher if production struggles to catch up.
Some analysts think international silver prices might rise above $45 per ounce soon. They also believe Indian prices could reach ₹150,000 per kilogram if both global and local demand keep growing.
For investors, silver offers both a hedge against economic uncertainty and exposure to the growth of renewable energy and electric vehicles. Risks are still present, especially if interest rates change suddenly. However, the fundamentals show that silver’s position in global markets is stronger than ever.
With gold setting new records and silver price climbing toward decade highs, 2025 is shaping up to be a defining year for precious metals.
- READ MORE: Gold Price Today Surges to All-Time High at $3,671 as Miners Push ESG and Carbon Reduction Goals
The post Silver Price Nears Highest Level Since 2011 Amid Precious Metals Rally appeared first on Carbon Credits.

EU carbon credit claims changed on 27 September 2026, the day the Directive (EU) 2024/825 began to apply across the European Union. The change is narrow. It changes how a company can talk about the credits it buys. A product can no longer be called neutral on the strength of compensation alone; however, every specific, evidenced statement about what a company measured, reduced, and funded stays fully available.

The post Promoting Improved Cooking Practices in Nigeria appeared first on Terrapass.



-
Climate Change1 year ago
Guest post: Why China is still building new coal – and when it might stop
-

 Greenhouse Gases2 years ago
嘉宾来稿:满足中国增长的用电需求 光伏加储能“比新建煤电更实惠”
-
Greenhouse Gases1 year ago
Guest post: Why China is still building new coal – and when it might stop
-

 Climate Change2 years ago
嘉宾来稿:满足中国增长的用电需求 光伏加储能“比新建煤电更实惠”
-

 Renewable Energy12 months ago
Sending Progressive Philanthropist George Soros to Prison?
-
Climate Change2 years ago
Bill Discounting Climate Change in Florida’s Energy Policy Awaits DeSantis’ Approval
-
Greenhouse Gases1 year ago
嘉宾来稿:探究火山喷发如何影响气候预测
-

 Climate Change2 years ago
Analysis: China’s CO2 falls 1% in Q2 2024 in first quarterly drop since Covid-19