

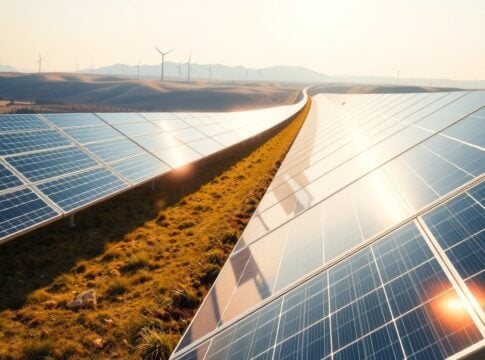
Global renewable energy reached a major turning point in 2025. For the first time in history, it generated more electricity than coal, marking a shift in how the world produces power.
Let’s take a closer look at the details and how this milestone impacts the clean energy transition landscape as well as carbon markets.
Clean Energy Hits Historic Milestone in Global Electricity Mix
According to energy think tank Ember, renewables’ share of global electricity overtook coal’s share in 2025. Renewables now supply more than a third of global power, while coal’s share has fallen below one‑third.
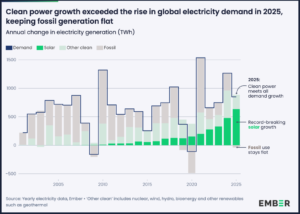
Ember notes that solar and wind together met about 99% of new global electricity demand growth in 2025. This helped push renewables ahead of coal despite rising energy use worldwide.
This milestone reflects years of investment in clean energy and signals a structural change in the global power system. It also shows that renewable technologies are now scaling fast enough to compete with traditional fossil fuels.
Solar Power Drives Record Growth in Clean Electricity
Solar energy led the global expansion in renewables. The Ember report stated,
“Record solar growth meant clean power sources grew fast enough to meet all new electricity demand in 2025, thereby preventing an increase in fossil generation. This was the first year since 2020 without an increase in electricity generation from fossil fuels and only the fifth year without a rise this century.”
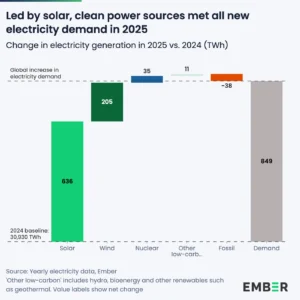
The data shows that solar generation grew by about 636 terawatt‑hours (TWh) in 2025, the largest annual increase of any single electricity source ever. This surge made solar the main driver of new electricity supply.
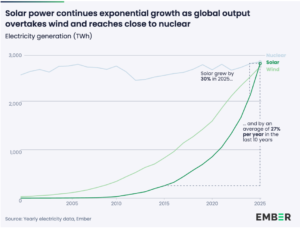
Solar output increased by around 30% in 2025, reflecting rapid deployment and falling costs. It also played a key role in meeting rising demand.
Ember’s analysis indicates that solar alone met about 75% of the net increase in global electricity demand in 2025. Wind energy also contributed strongly, helping renewables meet almost all of the year’s additional demand.
The continued drop in solar costs has supported this growth. Over the past decade, solar module prices have fallen by more than 80%, making it one of the cheapest sources of new electricity in many markets.
Asia Powers the Shift: China and India Drive the Transition
The shift toward renewables has been driven largely by Asia’s biggest economies, per Ember data. China remains the largest contributor to global solar growth. It accounted for about 55% of the increase in solar generation in 2025, reflecting its large-scale investments in clean energy infrastructure.
The United States contributed around 14% of global solar growth, while India also expanded its renewable capacity significantly.
A key development in 2025 was the decline in fossil fuel generation in both China and India at the same time. This has not happened in many years.
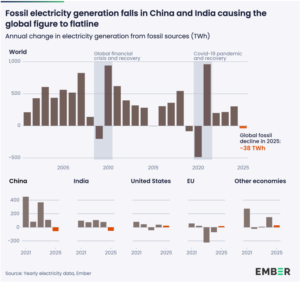
Globally, coal generation dropped by 63 TWh in 2025, driven by reduced output in these major economies. This decline played a critical role in allowing renewables to overtake coal.
The transition in these countries has a global impact. Together, China and India account for a large share of global electricity demand and emissions.
In 2025, the two countries together represented roughly one‑fifth of global electricity demand and more than one‑fifth of global power‑sector CO₂ emissions, according to Ember’s annual electricity review and supporting analyses.
Emissions Peak? Clean Power Starts to Bend the Curve
Despite rising electricity demand, emissions from the power sector are beginning to stabilize. Global electricity demand increased by about 2.8% in 2025. However, power-sector emissions fell slightly, even with the higher demand.
According to Ember’s 2025 annual electricity review, power‑sector emissions fell slightly in 2025 despite a rise in global electricity demand. The analysis indicates that, without the growth of solar and wind, emissions from the power sector would have been about 236 MtCO₂ higher than they actually were.
This shows how renewable energy is helping offset emissions from growing energy use. The data further shows that the average kilowatt-hour of electricity produced globally resulted in 458 gCO₂e in 2025, about 2.7% less than 471 gCO₂e in 2024.
The International Energy Agency also projects a steady decline in carbon intensity. Global electricity emissions intensity is expected to fall from 445 grams of CO₂ per kilowatt-hour (gCO₂/kWh) in 2024 to about 400 gCO₂/kWh by 2027.
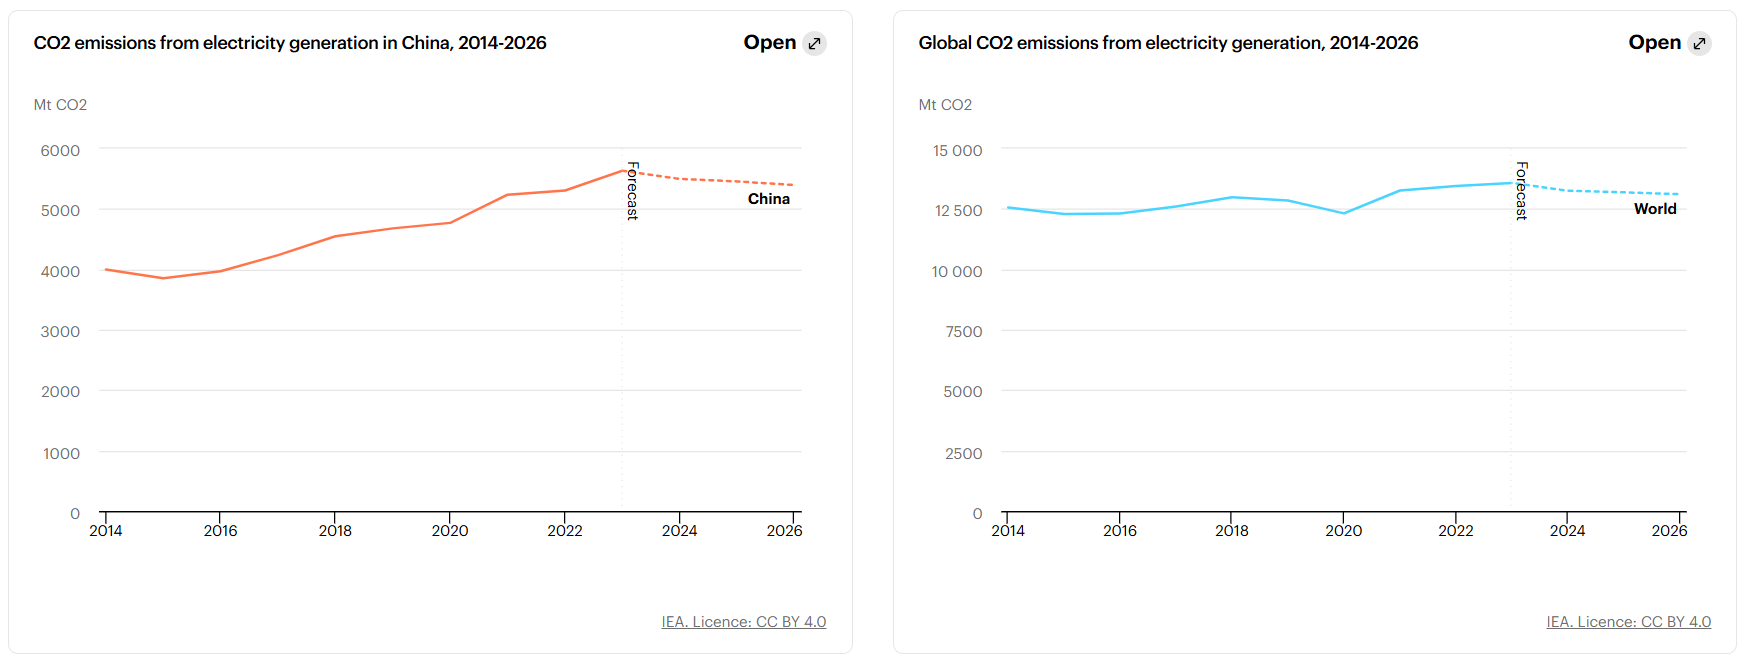
This represents an average annual reduction of 3.6%, highlighting gradual progress toward cleaner electricity systems.
The Grid Test: Can Power Systems Keep Up With Renewables?
The rapid growth of renewables brings new challenges for power systems. Solar and wind are variable sources, meaning their output depends on weather conditions.
By 2030, variable renewables are expected to supply nearly 30% of global electricity, roughly double current levels. This will require more flexible and resilient power grids.
Key solutions include:
- Expanding grid infrastructure,
- Increasing energy storage capacity, and
- Improving demand-side management.
Battery storage is playing a central role in this transition. Global battery deployment is growing quickly as costs fall.
Battery costs dropped by about 45% in 2025, to a record low of about $70 per kilowatt-hour. Meanwhile, installed storage capacity additions increased by 46% during the same period, reaching about 247 gigawatt-hours in 2025. These systems help store excess solar energy during the day and release it when demand rises.
Current battery capacity can already shift about 14% of solar generation from midday to other times of the day. This improves grid stability and reduces reliance on fossil fuel backup.
Corporate Action Supports Clean Energy Growth
Large companies are also helping drive renewable energy adoption. Microsoft has committed to using 100% renewable electricity for its operations and aims to become carbon negative by 2030. Google is investing heavily in solar and wind projects worldwide, including partnerships in Asia to support clean energy supply for data centers.
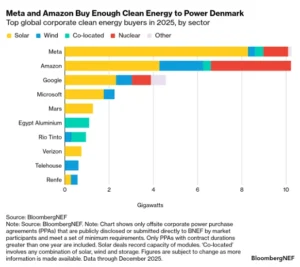
Corporate demand for renewable energy is growing as companies set net-zero targets and seek to reduce their carbon footprints. This trend supports further investment in renewable capacity and helps scale clean technologies.
Market Implications for Carbon Credits and Investment
The rise of renewables has important implications for carbon markets and clean energy investment. As renewable generation increases, the need for fossil fuel-based power declines. This can reduce emissions and affect demand for certain types of carbon credits.
At the same time, the transition creates new opportunities. Projects that support grid stability, energy storage, and renewable integration may generate additional carbon credits.
Investors are also shifting focus toward clean energy infrastructure. Renewable energy projects are becoming more competitive as costs fall and policy support strengthens.
The milestone of renewables overtaking coal provides strong evidence that the energy transition is accelerating.
A Turning Point for Global Energy
The fact that renewables have surpassed coal in global electricity generation marks a major turning point. It shows that clean energy is no longer a niche solution. Instead, it is becoming the foundation of the global power system.
Solar and wind are now growing fast enough to meet rising demand while reducing dependence on fossil fuels. Challenges remain, especially in grid integration and storage. However, continued investment and innovation are helping address these issues.
For policymakers, investors, and businesses, the message is clear: The global energy transition is moving from ambition to reality.
As renewable energy continues to expand, it will play a central role in reducing emissions, supporting economic growth, and building a more sustainable energy system.
The post Renewables Overtake Coal for the First Time as World’s Largest Electricity Source in 2025 appeared first on Carbon Credits.

The post Promoting Improved Cooking Practices in Nigeria appeared first on Terrapass.
For most companies, the largest figure in the carbon inventory is not the office, the vehicle fleet, or the electricity bill. It sits upstream, in the goods and materials a business buys to make and sell its products. These purchased inputs form the bulk of a company’s Scope 3 emissions, which routinely exceeds everything the business controls directly, and can add up to 90% of their global footprint.




-
Climate Change1 year ago
Guest post: Why China is still building new coal – and when it might stop
-

 Greenhouse Gases2 years ago
嘉宾来稿:满足中国增长的用电需求 光伏加储能“比新建煤电更实惠”
-
Greenhouse Gases1 year ago
Guest post: Why China is still building new coal – and when it might stop
-

 Climate Change2 years ago
嘉宾来稿:满足中国增长的用电需求 光伏加储能“比新建煤电更实惠”
-

 Renewable Energy12 months ago
Sending Progressive Philanthropist George Soros to Prison?
-
Climate Change2 years ago
Bill Discounting Climate Change in Florida’s Energy Policy Awaits DeSantis’ Approval
-
Greenhouse Gases1 year ago
嘉宾来稿:探究火山喷发如何影响气候预测
-

 Climate Change2 years ago
Analysis: China’s CO2 falls 1% in Q2 2024 in first quarterly drop since Covid-19