

As global temperatures rise, extreme weather events are becoming more intense and more frequent all around the world.
Over the past two decades, the cutting-edge field of extreme weather attribution has sought to establish the role that human-caused warming has played in these events.
There are now hundreds of attribution studies, assessing extremes ranging from heatwaves in China and droughts in Madagascar through to wildfires in Brazil and extreme rainfall in South Africa.
Carbon Brief has mapped every attribution study published to date, revealing that three-quarters of the extremes analysed were made more intense or likely due to climate change.
Along with this explosion of new studies, the different types of attribution studies have evolved and expanded over the past two decades.
For example, the World Weather Attribution service was established in 2015 to provide rapid-response studies, streamlining the process of estimating the human contribution to extreme events in a matter of days.
Meanwhile, a growing community of researchers are developing the “storyline approach” to attribution that focuses more on the dynamics of the specific events being studied.
Other researchers are using weather forecasts to attribute events that have not even happened yet. And many studies are now combining these methods to get the best of all worlds in their findings.
In this detailed Q&A, Carbon Brief explores how the field of attribution science has evolved over time and explains the key methods used today.
- What are the origins of ‘extreme weather attribution’?
- What is ‘probabilistic’ attribution?
- Which weather extremes can scientists link to climate change?
- Why do scientists perform ‘rapid’ attribution studies?
- Can the impacts of extreme weather be linked to climate change?
- How do scientists attribute ‘unprecedented’ events?
- How can weather forecasts be used in attribution studies?
- What are the applications of attribution science?
- What are the next steps for attribution research?
What are the origins of ‘extreme weather attribution’?
The Intergovernmental Panel on Climate Change (IPCC) made its first mention of attribution in its first assessment report (pdf), published in 1990. In a section called “Attribution and the fingerprint method”, the report refers to attribution as “linking cause and effect”.

In these early days of attribution science, experts used statistical methods to search for the “fingerprint” of human-caused climate change in global temperature records.
However, the 1990 report says that “it is not possible at this time to attribute all or even a large part of the observed global mean warming to the enhanced greenhouse effect on the basis of the observational data currently available”.
As the observational record lengthened and scientists refined their methods, experts became more confident about attributing global temperature rise to human-caused climate change. By the time its third assessment report was published in 2001, the IPCC could state that “detection and attribution studies consistently find evidence for an anthropogenic signal in the climate record of the last 35 to 50 years”.
Just two years later, Prof Myles Allen – professor of geosystem science at the University of Oxford – wrote a Nature commentary from his home in Oxford that would open the door for attributing extreme weather events to climate change. The article begins:
“As I write this article in January 2003, the floodwaters of the River Thames are about 30 centimetres from my kitchen door and slowly rising. On the radio, a representative of the UK Met Office has just explained that although this is the kind of phenomenon that global warming might make more frequent, it is impossible to attribute this particular event (floods in southern England) to past emissions of greenhouse gases. What is less clear is whether the attribution of specific weather events to external drivers of climate change will always be impossible in principle, or whether it is simply impossible at present, given our current state of understanding of the climate system.”
Just months after Oxford’s floodwaters began to recede, a now-infamous heatwave swept across Europe. The summer of 2003 was the hottest ever recorded for central and western Europe, with average temperatures in many countries reaching 5C higher than usual.
The unexpected heat resulted in an estimated 20,000 “excess” deaths, making the heatwave one of Europe’s deadliest on record.
In 2004, Allen and two other UK-based climate scientists produced the first formal attribution study, published in Nature, which estimated the impact of human-caused climate change on the heatwave.
To conduct the study, the authors first chose the temperature “threshold” to define their heatwave. They decided on 1.6C above the 1961-90 average, because the European summer of 2003 was the first on record to exceed this average temperature.
They then used a global climate model to simulate two worlds – one mirroring the world as it was in 2003 and the other a fictional world in which the industrial revolution never happened. In the second case, the climate is influenced solely by natural changes, such as solar energy and volcanic activity, and there is no human-caused warming.
The authors ran their models thousands of times in each scenario from 1989 to 2003. As the climate is inherently chaotic, each model “run” – individual simulations of how the climate progresses over many years – produces a slightly different progression of temperatures. This means that some runs simulated a heatwave in the summer of 2003, while others did not.
The authors counted how many times the 1.6C threshold temperature was crossed in the summer of 2003 in each model run. They then compared the likelihood of crossing the threshold temperature in the world with – and a world without – climate change.
They concluded that “it is very likely that human influence has at least doubled the risk of a heatwave exceeding this threshold magnitude”.
A Nature commentary linked to the study called the paper a “breakthrough”, stating that it was the “first successful attempt to detect man-made influence on a specific extreme climatic event”.
In the decade following the heatwave study, more teams from around the world began to use the same methods – known as “probabilistic”, “risk-based” or “unconditional” attribution.
Prof Peter Stott is a science fellow in climate attribution at the UK Met Office and an author on the study. Stott tells Carbon Brief that the basic methods used in this first attribution study are “still used to this day”, but that scientists now use more “up-to-date” climate models than the one used in his seminal study.
What is ‘probabilistic’ attribution?
As the 2004 Nature study demonstrated, probabilistic attribution involves scientists running climate models thousands of times in scenarios with and without human-caused climate change, then comparing the two.
This allows them to say how much more likely, intense or long-lasting an event was due to climate change.
Many studies since have added a third scenario, in which the planet is warmer than present-day temperatures, to assess how climate change may impact extreme weather events in the future.
The figure below shows three distributions of multiple different simulated extreme events. The x-axis (horizontal) represents the intensity of the climate variable – in this instance temperature – with lower temperatures on the left and higher temperatures on the right. The y-axis (vertical) shows the likelihood of this variable hitting certain values.
Each curve shows how the climate variable behaves in a different scenario, or “world”. The red-shaded curve shows a pre-industrial world that was not warmed by human influence, the yellow-shaded curve indicates today’s climate, while the dashed line shows a future, warmer world. The curves shift from left to right as the climate warms.
The peak of each curve shows the most likely temperatures, while likelihood is lowest at the far left and far right of each curve, where temperatures are most extreme. The hatched areas show the temperatures that cross a predefined “threshold” temperature. (In the attribution study on the 2003 European heatwave, this threshold was defined as 1.6C above the 1961-90 average.)
The three curves show how the threshold is more likely to be crossed as the world warms.

Which weather extremes can scientists link to climate change?
In 2011, the American Meteorological Society decided to include a “special supplement” about attribution research in its annual report.
The supplement presented six different attribution studies. It generated significant media interest and the “Explaining Extreme Events” report has been published by Bulletin of the American Meteorological Society almost every year since.
As the research field has grown, so too has the range of different extremes that have been studied.
Heatwaves are generally considered the simplest extreme events to attribute, because they are mainly driven by thermodynamic influences. In contrast, storms and droughts are more strongly affected by complex atmospheric dynamics, so can be trickier to simulate in a model.
The graphic below shows the relative confidence of attributing different types of extreme events.

Attribution studies on extreme heat often assess how much hotter, long-lasting or likely an event was due to climate change. For example, one study finds that the summer heatwave that hit France in 2019 was made 1.5-3C hotter due to climate change and about 100 times more likely.
Heatwaves are the most-studied extreme event in attribution literature, but are becoming “less and less interesting for researchers”, according to a Bloomberg article from 2020.
Assessing extreme rainfall is more complicated – in part because the Earth’s chaotic weather system means that the size and path of a storm or heavy rainfall event has a large element of chance, which can make it challenging to identify where climate change fits in.
Nevertheless, many teams have published studies attributing extreme rainfall events and storms. For example, one study (pdf) found that climate change doubled the likelihood of the intense rainfall that fell in northern China in September 2021.
Scientists also study more complex events, such as drought, wildfires and floods, which are impacted by factors including land use and disaster preparedness.
For example, there are many different ways to define a drought. Some are linked just to rainfall, while others consider factors including soil moisture, groundwater and river flow. Some attribution studies investigating the impact of climate change on drought focus only on rainfall deficit, while others (pdf) study temperature or vapour pressure deficit – the difference between the amount of moisture in the air and how much moisture the air can hold when it is saturated.
A scientist’s decision about which type of drought to study sometimes depends on the available data and the type of impacts caused by the drought. In other cases, the choice may come down to what caused the biggest impact on people.
For example, in late 2022, South America was plagued by a severe drought that caused widespread crop failure. An attribution study on the event, therefore, focused on “agricultural” drought, which captures the response of rainfall on soil moisture conditions and is the most relevant for crop health.

Meanwhile, a study on drought in Madagascar over 2019-21 chose to focus on rainfall deficit. The study says “this was because recent research found rainfall deficits were the primary driver of drought in regions of East Africa with very similar climatic properties to south-west Madagascar”.
Wildfires are affected by conditions including temperature, rainfall, wind speed and land use. While some wildfire attribution studies focus on vapour pressure deficit, others quantify the fire weather index, which looks at the effects of fuel moisture and wind on fire behaviour and spread”.
Tropical cyclones are also complex. There is evidence that climate change can increase the peak “rain rates” and wind speeds of tropical cyclones, and that storm tracks are shifting poleward. There are many aspects of a cyclone that can be analysed, such as rainfall intensity, storm surge height and storm size.
Why do scientists perform ‘rapid’ attribution studies?
As extreme weather attribution became more mainstream, researchers began to produce studies more quickly. However, challenges in communicating the findings of attribution studies in a timely way soon became evident.
After conducting a study, writing it up and submitting it to a journal, it can still take months or years for research to be published. This means that, by the time an attribution study is published, the extreme event has likely long passed.
The World Weather Attribution (WWA) initiative was founded in 2015 to tackle this issue. The team uses a standard, peer-reviewed methodology for their studies, but does not publish the results in formal journals – instead publishing them directly on their website.
(After publishing these “rapid attribution” studies on their website, the team often write full papers for publication in formal journals, which are then peer reviewed.)
This means that rather than taking months or years to publish their research, the team can make their findings public just days or weeks after an extreme weather event occurs.
In 2021, the founders of the initiative – including Carbon Brief contributing editor Dr Friederike Otto, who is a senior lecturer in climate science at Imperial College London’s Grantham Institute – wrote a Carbon Brief guest post explaining why they founded WWA:
“By reacting in a matter of days or weeks, we have been able to inform key audiences with a solid scientific result swiftly after an extreme event has occurred – when the interest is highest and results most relevant.”
The guest post explains that to conduct an attribution study, the WWA team first uses observed data to assess how rare the event is in the current climate – and how much this has changed over the observed record. This is communicated using a “return period” – the expected frequency an event of this magnitude could be expected under a given climate.
For example, the WWA analysed the UK’s record-shattering heatwave of 2022, when the country recorded temperatures above 40C for the first time. They found that the maximum temperature seen in the UK on 19 July 2022 has a 1,000-year return period in today’s climate – meaning that even in today’s climate, 40C heat would only be expected, on average, once in a millennium.
The authors then use climate models to carry out the “probabilistic” attribution study, to determine how much more intense, likely or long-lasting the event was as a result of climate change. They conclude by conducting “vulnerability and exposure” analysis, which often highlights other socioeconomic problems.
Sometimes, the authors conclude that climate change did not influence the event. For example, a 2021 rapid attribution study by WWA found that poverty, poor infrastructure and dependence on rain-fed agriculture were the main drivers of the ongoing food crisis in Madagascar, while climate change played “no more than a small part”.
Other groups are also conducting rapid attribution studies. For example, a group of scientists – including some WWA collaborators – recently launched a “rapid experimental framework” research project called ClimaMeter. The tool provides initial attribution results just hours after an extreme weather event takes place.
ClimaMeter focuses on the atmospheric circulation patterns that cause an extreme event – for example, a low-pressure system in a particular region. Once an event is defined, the scientists search the historical record to find events with similar circulation patterns to calculate how the intensity of the events has changed over time.
Can the impacts of extreme weather be linked to climate change?
A branch of attribution science called “impact attribution” – which aims to quantify the social, economic and/or ecological impacts of climate change on extreme weather events – is also gaining popularity. There are four main types of impact attribution, as shown in the graphic below.

1) Trend-to-trend impact attribution
The first method, called “trend-to-trend” impact attribution, assesses long-term trends in both the climate system and in “health outcomes”. This approach was used in a 2021 study on heat-related mortality around the world, which received extensive media attention.
The authors used data from 732 locations in 43 countries to identify relationships between temperature and mortality in different locations, known as “exposure-response functions”. This allowed them to estimate how many people would die in a given location, if temperatures reach a certain level.
The authors used these relationships to calculate heat-related mortality over 1991-2018 for each location under two scenarios – one with and one without human-caused climate change. The study concluded that 37% of “warm-season heat-related deaths” can be attributed to human-caused climate change.
2) Event-to-event attribution
The second type of study is known as “event-to-event” attribution. In one study using this method, the authors used data on observed mortality rates to determine how many people died in Switzerland during the unusually warm summer of 2022.
They calculated how much climate change contributed to warming during that summer. They then then ran a model to calculate the “hypothetical heat-related burden” that would have been seen during the summer without the warming influence of climate change.
Using this method, they estimate that 60% of the 623 heat-related deaths “could have been avoided in absence of human-induced climate change”.
3) Risk-based event attribution
“Risk-based” event impact attribution – which is demonstrated in a more recent study on the 2003 European heatwave – is the third type of impact attribution. This method combines probabilistic event attribution with resulting health outcomes.
When the paper was published, its lead author, Prof Dann Mitchell – a professor of climate science at the University of Bristol – explained the method to Carbon Brief:
“We have a statistical relationship between the number of additional deaths per degree of warming. This is specific to a certain city and changes a lot between cities. We use climate simulations to calculate the heat in 2003, and in 2003 without human influences. Then we compare the simulations, along with the observations.”
They find, for example, that in the summer of 2003, anthropogenic climate change increased the risk of heat-related mortality in London by around 20%. This means that out of the estimated 315 deaths in London during the heatwave, 64 were due to climate change.
4) Fractional attribution
In the final method, known as “fractional” attribution, the authors combine the results of two independent numbers – an estimation of the total damages caused by an extreme weather event, and a calculation of the proportion of the risk from an extreme weather event for which anthropogenic climate change is responsible, known as the “fraction of attributable risk” (FAR).
The authors of one study used this method to estimate the economic damages linked to Hurricane Harvey.

The authors calculate that “fraction of attributable risk” for the rainfall from Harvey was around three-quarters – meaning that climate change was responsible for three-quarters of the intense rainfall.
Separately, the authors find that according to best estimates, the hurricane caused damages of around US$90bn. From this, the authors conclude that US$67bn of the damages caused by the Hurricane’s intense rainfall can be attributed to climate change.
A study on the 2010 Russian heatwave also used this method. The authors found that the heatwave was responsible for more than 55,000 deaths (pdf), and found an 80% chance that the extreme heat would not have occurred without climate warming. The study concludes that almost 45,000 of the deaths were attributable to human-caused climate change.
However, the fractional attribution method has received criticism. One paper argues that the method “inflates the impacts associated with anthropogenic climate change”, because it “incorrectly assumes” that the event has no impact unless it exceeds the threshold defined by the researchers.
Some of the authors of the Hurricane Harvey paper later wrote a paper advising caution in interpreting the results of FAR studies. They say:
“The fraction of attributable risk (FAR) method, useful in extreme weather attribution research, has a very specific interpretation concerning a class of events, and there is potential to misinterpret results from weather event analyses as being applicable to specific events and their impact outcomes…FAR is not generally appropriate when estimating the magnitude of the anthropogenic signal behind a specific impact.”
Expanding scope
Impact attribution is continuing to expand in scope. For example, studies are now being conducted to assess the impact of climate change on disease transmission.
In 2020, scientists quantified the influence of climate change on specific episodes of extreme ice loss from glaciers for the first time. They found that human-caused climate change made the extreme “mass loss” seen in glaciers in the Southern Alps, New Zealand, in 2018 at least 10 times more likely.
Scientists have also linked climate change to ecosystem shifts. One study focusing on temperature finds that the “extremely early cherry tree flowering” seen in Kyoto in 2021 was made 15 times more likely due to climate change.

Others go even further, linking weather extremes to societal impacts. For example, a 2021 study published in Scientific Reports says:
“By combining an extreme event attribution analysis with a probabilistic model of food production and prices, we find that climate change increased the likelihood of the 2007 co-occurring drought in South Africa and Lesotho, aggravating the food crisis in Lesotho.”
Meanwhile, Imperial College London’s Grantham Institute is working on an initiative to publish rapid impact attribution studies about extreme weather events around the world. Similar to WWA studies, these rapid studies will not be peer reviewed individually, but will be based on a peer-reviewed methodology.
Dr Emily Theokritoff – a research associate at Grantham, who is working on the initiative, tells Carbon Brief that it will be launched “in the near future”. She adds:
“The aim is to recharge the field, start a conversation about climate losses and damages, and help people understand how climate change is making life more dangerous and more expensive.”
How do scientists attribute ‘unprecedented’ events?
An attribution method known as the “storyline approach” or “conditional attribution” has become increasingly popular over the past decade – despite initially causing controversy in the attribution community.
In this approach, researchers first select an extreme weather event, such as a specific heatwave, storm or drought. They then identify the physical components, such as sea surface temperature, soil moisture and atmospheric dynamics, that led to the event unfolding in the way it did. This series of events is called a “storyline”.
The authors then use models to simulate this “storyline” in two different worlds – one in the world as we know it and one in a counterfactual world – for example, with a different sea surface temperature or CO2 level. By comparing the model runs, the researchers can draw conclusions about how much climate change influenced that event.
The storyline approach is useful for explaining the influence of climate change on the physical processes that contributed to the event. It can also be used to explore in detail how this event would have played out in a warmer (future) or cooler (pre-industrial) climate.
One study describes the storyline approach as an “autopsy”, explaining that it “gives an account of the causes of the extreme event”.
Prof Ted Shepherd, a researcher at the University of Reading, was one of the earliest advocates of the storyline attribution approach. At the EGU general assembly in Vienna in April 2024, Shepherd provided the opening talk in a session on storyline attribution.
He told the packed conference room that the storyline approach was born out of the need for a “forensic” approach to attribution, rather than a “yes/no” approach. He emphasised that extreme weather events have “multiple causes” and that the storyline approach allows researchers to dissect each of these components.
Dr Linda van Garderen is a postdoctoral researcher at Utrecht University and has carried out multiple studies using the storyline method. She tells Carbon Brief that, while traditional attribution typically investigates probability, the storyline approach analyses intensity.
For example, she led an attribution study using the storyline method which concluded that the 2003 European and 2010 Russian heatwaves would have been 2.5-4C cooler in a world without climate change.
She adds that it can make communication easier, telling Carbon Brief that “probabilities can be challenging to interpret in practical daily life, whereas the intensity framing of storyline studies is more intuitive and can make attribution studies easier to understand”.
Dr Nicholas Leach is a researcher at the University of Oxford who has conducted multiple studies using the storyline approach. He tells Carbon Brief that probabilistic attribution often produces “false negatives”, wrongly concluding that climate change did not influence an event.
This is because climate models have “biases and uncertainties” which can lead to “noise” – particularly when it comes to dynamical features such as atmospheric circulation patterns. Probabilistic attribution methods often end up losing the signal of climate change in this noise, he explains.
The storyline approach is able to avoid these issues more easily, he says. He explains that by focusing on the dynamics of one specific event, rather than a “broad class of events”, storyline studies can eliminate some of this noise, making it more straightforward to identify a signal, he says.
Conversely, others have critiqued the storyline method for producing false positives, which wrongly claim that climate change influenced an extreme weather event.
The storyline approach has also been praised for its ability to attribute “unprecedented” events. In the EGU session on the storyline method, many presentations explored how the storyline method could be used to attribute “statistically impossible” extremes.
Leach explains that when a completely unprecedented extreme event occurs, statistical models often indicate that the event “shouldn’t have happened”. When running a probabilistic analysis using these models, Leach explains: “You end up with the present probability being zero and past probability being zero, so you can’t say a lot.”
He points to the Pacific north-west heatwave of 2021 as an example of this. This event was one of the most extreme regional heat events ever recorded globally, breaking some local high temperature records by more than 6C.

WWA conducted a rapid attribution study on the heatwave, using its probabilistic attribution method. The heatwave was “so extreme” that the observed temperatures “lie far outside the range” of historical observations, the researchers said.
Their assessment suggests that the heatwave was around a one-in-1,000-year event in today’s climate and was made at least 150-times more likely because of climate change.
Leach and his colleagues used the storyline method to attribute the same heatwave. The methods of this study will be discussed more in the following section.
Leach explains that using the storyline approach, he was able to consider the physics of the event, including an atmospheric river that coincided with the “heat dome” that was a key feature of the event. This helped him to represent the event well in his models. The study concluded that the heatwave was 1.3C hotter and eight times more likely as a result of climate change.
Many experts tell Carbon Brief there was initially tension in the attribution community between probabilistic and storyline advocates when the latter was first introduced. However, as the storyline method has become more mainstream, criticism has abated and many scientists are now publishing research using both techniques.
Van Garderen tells Carbon Brief that storyline attribution is “adding to the attribution toolbox”, rather than attempting to replace existing methods. She emphasises that probability-based and storyline attribution answer different questions, and that both are important.
How can weather forecasts be used in attribution studies?
Forecast attribution is the most recent major addition to the attribution toolbox. This method uses weather forecasts instead of climate models to carry out attribution studies. Many experts describe this method as sitting part-way between probabilistic and storyline attribution.
One benefit of using forecasts, rather than climate models, is that their higher resolution allows them to simulate extreme weather events in more detail. By using forecasts, scientists can also attribute events that have not yet happened.
The first use of “advance forecasted” attribution analysis (pdf) quantified the impact of climate change on the size, rainfall and intensity of Hurricane Florence before it made landfall in North Carolina in September 2018.
The authors, in essence, carried out the probabilistic attribution method, using two sets of short-term forecasts for the hurricane rather than large-scale climate models. The analysis received a mixed reaction. Stott told Carbon Brief at the time that it was “quite a cool idea”, but was highly dependent on being able to forecast such events reliably.
Dr Kevin Trenberth, distinguished senior scientist at the National Center for Atmospheric Research, told Carbon Brief in 2019 that the study was “a bit of a disaster”, explaining that the quality of the forecast was questionable for the assessment.
The authors subsequently published a paper in Science Advances reviewing their study “with the benefit of hindsight”. The authors acknowledged that the results are quite a way off what they forecasted. However, they also claimed to have identified what went wrong with their forecasted analysis.
Problems with the “without climate change” model runs created a larger contrast against their real-world simulations, meaning the analysis overestimated the impact of climate change on the event, they said.
Nonetheless, the study did identify a quantifiable impact of climate change on Hurricane Florence, adding to the evidence from studies by other author groups.
This research team has since published more forecast-based attribution studies on hurricanes. One study used hindcasts – forecasts that start from the past and then run forward into the present – to analyse the 2020 hurricane season. The team then ran a series of “counterfactual” hindcasts over the same period, without the influence of human warming from sea surface temperatures.
They found that warmer waters increased three-hour rainfall rates and three-day accumulated rainfall for tropical storms by 10% and 5%, respectively, over the 2020 season.

Meanwhile, a 2021 study by a different team showed how it was possible to use traditional weather forecasts for attribution. The researchers, who penned a Carbon Brief guest post about their work, found that the European heatwave of February 2019 was 42% more likely for the British Isles and at least 100% more likely for France.
To conduct their study, the authors used a weather forecast model – also known as a “numerical weather prediction” model (NWP).
They explain that a NWP typically runs at a higher resolution than a climate model, meaning that it has more, smaller grid cells. This allows it to simulate processes that a climate model cannot and makes them “more suitable for studying the most extreme events than conventional climate models,” the authors argue.
More recently, Leach and his team carried out a forecast attribution study on the record-breaking Pacific north-west heatwave of 2021, years after the event took place.
The authors defined 29 June 2021 as the start of the event, as this is when the maximum temperature of the heatwave was recorded. They then ran their forecasts using a range of “lead times” – the number of days before the event starts that the model simulation is initialised.
The shortest lead time in this study was three days, meaning the scientists began running the model using the weather conditions recorded on 26 June 2021. The short lead time meant that they could tailor the model very closely to the weather conditions at this time and simulated the event itself very accurately.
By comparison, the longest lead times used in this study were 2-4 months. This means that the models were initialised in spring and, by the time they simulated the June heatwave, their simulation did not closely resemble the events that actually unfolded.
Leach tells Carbon Brief that by lengthening the lead time of the weather forecast, they can effectively “shift the dial” from storyline to probabilistic attribution. He explains:
“If you’re using a forecast that’s initialised really near to your event, then you’re kind of going down that storyline approach, by saying, ‘I want what my model is stimulating to look really similar to the event I’m interested in’…
“The further back [in time] you go, the closer you get to the more probabilistic style of statements that are more unconditioned.”
This combination of storyline and probabilistic attribution allows the authors to draw conclusions both about how climate change affected the intensity and the likelihood of the heatwave. The authors estimate that the heatwave was 1.3C more intense and eight times more likely as a result of climate change.
More recently, Climate Central has produced a tool that uses temperature forecasts over the US over the coming days to calculate a “climate shift index”. This index gives the ratio of how common the forecasted temperature is in today’s climate, compared to how likely it would be in a world without climate change.
The index runs from five to minus five. A result of zero indicates that climate change has no detectable influence, an index of five means that climate change made the temperature at least five times more likely and an index of minus five means that climate change made the temperature at least five times less likely.
The tool can be used for attribution. For example, recent analysis by the group used the index to quantify how climate change has influenced the number of uncomfortably hot nights. It concluded:
“Due to human-caused climate change, 2.4 billion people experienced an average of at least two additional weeks per year where nighttime temperatures exceeded 25C. Over one billion people experienced an average of at least two additional weeks per year of nights above 20C and 18C.”
What are the applications of attribution science?
One often-touted application of attribution studies is to raise awareness about the role of climate change in extreme weather events. However, there are limited studies about how effective this is.
One study presents the results of focus group interviews with UK scientists, who were not working on climate change, in which participants were given attribution statements. The study concludes:
“Extreme event attribution shows significant promise for climate change communication because of its ability to connect novel, attention-grabbing and event-specific scientific information to personal experiences and observations of extreme events.”
However, the study identified a range of challenges, including “adequately capturing nuances”, “expressing scientific uncertainty without undermining accessibility of key findings” and difficulties interpreting mathematical aspects of the results.
In another experiment, researchers informed nearly 4,000 adults in the US that climate change had made the July 2023 heatwave in the US at least five times more likely. The team also shared information from Climate Central’s climate shift index. According to the study, both approaches “increased the belief that climate change made the July 2023 heatwave more likely and is making heatwaves in general more likely as well”.
Meanwhile, as the science of extreme weather attribution becomes more established, lawyers, governments and civil society are finding more uses for this evolving field.
For example, attribution is starting to play an important role in courts. In 2017, two lawyers wrote a Carbon Brief guest post stating “we expect that attribution science will provide crucial evidence that will help courts determine liability for climate change related harm”.
Four years later, the authors of a study on “climate litigation” wrote a Carbon Brief guest post explaining how attribution science can be “translated into legal causality”. They wrote:
“Attribution can bridge the gap identified by judges between a general understanding that human-induced climate change has many negative impacts and providing concrete evidence of the role of climate change at a specific location for a specific extreme event that already has led or will lead to damages.”
In 2024, around 2,000 Swiss women used an attribution study, alongside other evidence, to win a landmark case in the European Court of Human Rights. The women, mostly in their 70s, said that their age and gender made them particularly vulnerable to heatwaves linked to climate change. The court ruled that Switzerland’s efforts to meet its emissions targets had been “woefully inadequate”.

The 2024 European Geosciences Union conference in Vienna dedicated an entire session to climate change and litigation. Prof Wim Thiery – a scientist who was involved in many conference sessions on climate change and litigation – tells Carbon Brief that attribution science is particularly important for supporting “reparation cases”, in which vulnerable countries or communities seek compensation for the damages caused by climate change.
He adds Carbon Brief that seeing the “direct and tangible impact” of an attribution study in a court case “motivates climate scientists in engaging in this community”.
(Other types of science are also important in court cases related to climate change, he added. For example, “source attribution” identifies the relative contribution of different sectors and entities – such as companies or governments – to climate change.)
Dr Rupert Stuart-Smith, a research associate in climate science and the law at the University of Oxford’s Sustainable Law Programme, adds:
“We’re seeing a new evolution whereby communities are increasingly looking at impact-relevant variables. Think about inundated areas, lake levels, heatwave mortalities. These are the new target variables of attribution science. This is a new frontier and we are seeing that those studies are directly usable in court cases.”
He tells Carbon Brief that some cases “have sought to hold high-emitting corporations – such as fossil fuel or agricultural companies – liable for the costs of climate change impacts”. He continues:
“In cases like these, claimants typically need to show that climate change is causing specific harms affecting them and courts may leverage attribution or climate projections to adjudicate these claims. Impact attribution is particularly relevant in this context.”
Dr Delta Merner is a lead scientist at the science hub for climate litigation. She tells Carbon Brief that “enhanced source attribution for companies and countries” will be “critical” for holding major emitters accountable. She adds:
“This is an urgent time for the field of attribution science, which is uniquely capable of providing robust, actionable evidence to inform decision-making and drive accountability.”
Meanwhile, many countries’s national weather services are working on “operational attribution” – the regular production of rapid attribution assessments.
Stott tells Carbon Brief that the UK Met Office is operationalising attribution studies. For example, on 2 January 2024, it announced that 2023 was the second-warmest year on record for the UK, with an average temperature of 9.97C.
New methods are also being developed. For example, groups, such as the “eXtreme events: Artificial Intelligence for Detection and Attribution” (XAIDA) team, are researching the use of machine learning and artificial intelligence for attribution studies.
One recent attribution study uses a machine-learning approach to create “dynamically consistent counterfactual versions of historical extreme events under different levels of global mean temperature”. The authors estimate that the south-central North American heatwave of 2023 was 1.18-1.42C warmer because of global warming.
The authors conclude:
“Our results broadly agree with other attribution techniques, suggesting that machine learning can be used to perform rapid, low-cost attribution of extreme events.”
Other scientists are using a method called UNSEEN, which involves running models thousands of times to increase the size of the datasets used to make it easier to derive accurate probabilities from highly variable extremes.
What are the next steps for attribution research?
The experts that Carbon Brief spoke to for this article have high hopes for the future of attribution science. For example, Stott says:
“Attribution science has great potential to improve the resilience of societies to future climate change, can help monitor progress towards the Paris goals of keeping global warming to well below 2C and can motivate progress in driving down emissions towards net-zero by the middle of this century.”
However, despite the progress made over the past two decades, there are still challenges to overcome. One of the key barriers in attribution science is a lack of high-quality observational data in low-income countries.
To carry out an attribution study, researchers need a Iong, high-quality dataset of observations from the area being studied. However, inadequate funding or political instability means that many developing countries do not have sufficient weather station data.

In a 2016 interview with Carbon Brief, Allen said that “right now there is obviously a bias towards our own backyards – north-west Europe, Australia and New Zealand.”
Many WWA studies in global-south countries mention the challenge of finding adequate data and sometimes this affects the results. A WWA study of the 2022 drought in west Africa’s Sahel region was unable to find the signal of climate change in the region’s rainfall pattern – in part, due to widespread uncertainties in the observational data.
Otto, who was an author on the study, explained at the time:
“It could either be because the data is quite poor or because we have found the wrong indices. Or it could be because there really is no climate change signal…We have no way of identifying which of these three options it is.”
Developing better observational datasets is an ongoing challenge. It is highlighted in much of the literature on attribution as an important next step for attribution science – and for climate science more widely. Merner tells Carbon Brief that scientists also need to work on developing “novel approaches for regions without baseline data”.

Meanwhile, many scientists expect the methods used in attribution science to continue evolving. The Detection and Attribution Model Intercomparison Project is currently collecting simulations, which will support improved attribution of climate change in the next set of assessment reports from the Intergovernmental Panel on Climate Change.
Mitchell says that, over the next decade, he thinks that “we will move away from the more generic attribution methods that have served us well to this point, and start developing and applying more targeted – and even more defensible – methods”.
In particular, he highlights the need for more specific methods for impact attribution – for example, studying the impacts of weather events on health outcomes, biodiversity changes or financial losses.
He continues:
“The interplay of different socioeconomic states and interventions with that of climate change can make these particularly difficult to study – but we are getting there with our more advanced, albeit computationally expensive methods, such as using weather forecast models as the foundation of our attribution statements.”
Stott tells Carbon Brief that incorporating impacts into attribution assessments is a “crucial area for development” in attribution science. He explains that impact attribution is “very relevant to the loss-and-damage agenda and further developments in attribution science are likely to include the ability to attribute the financial costs of storms”.
Stuart-Smith tells Carbon Brief that, “in the coming years, growing numbers of studies will quantify the economic burden of climate change and its effects on a broader range of health impacts, including from vector and water-borne diseases”.
Leach also tells Carbon Brief that it is “important for attribution to move their focus beyond physical studies and into quantitative impact studies to increase their relevance and utility in policy and the media”.
He adds:
“Utilising weather forecasts for attribution would fit neatly with this aim as those same models are already widely used by emergency managers and built into impact modelling frameworks.”
Similarly, Stott tells Carbon Brief that “forecast attribution shows great potential”. He explains that by “progressing that science” will allow this method to be used to attribute more types of extreme weather with greater confidence.
Leach advocates for greater use of weather forecast models for all types of attribution. He says:
“Weather forecast models have demonstrated repeatedly over the past few years that they are capable of accurately representing even unprecedented weather extremes. Using these validated state-of-the-art models for attribution could bring an increase in confidence in the results.”
Many scientists also tell Carbon Brief about the importance of operationalising attribution. The weather services in many countries already have this in place. Stott tells Carbon Brief that groups in Japan, South Korea, Australia and the US are also “at various stages of developing operational attribution services”.
Meanwhile, Otto tells Carbon Brief that “the most important next step for attribution in my view is to really integrate the assessment of vulnerability and exposure into the attribution studies”. She adds:
“In order for attribution to truly inform adaptation it is essential though to go from attributing hazards, as we do now mainly, to disentangling drivers of disasters.”
Mitchell adds that he thinks attribution statements “are absolutely essential for [countries to make] national adaptation plans”.
Meanwhile, another study suggests that extreme event attribution studies could be used by engineers, along with climate projections, to assist climate adaptation for civil infrastructure.
Leach tells Carbon Brief that attribution could be useful in the insurance sector for similar reasons. He adds that many insurance sectors use the same forecasts in their catastrophe models that climate scientists use for forecast attribution, meaning that it should be straightforward to add attribution studies into their pipelines.



The post Q&A: The evolving science of ‘extreme weather attribution’ appeared first on Carbon Brief.

A fifth of the world’s greenhouse gas emissions are linked to international trade in goods and services, a new tracker shows, spotlighting a little-studied issue that researchers say should be tackled by the UN climate process.
Currently, as part of the Paris Agreement, every country is responsible for counting and reducing the planet-heating emissions that are produced within its territory. Manufacturing countries, for example, may have high emissions even if what they make is exported for consumption elsewhere.
But new analysis from the European Climate Foundation (ECF) and climate consultancy Matière, based on the tracker’s data, shows that some countries have a high footprint of “imported emissions” from goods and services they ship in. These emissions are often ignored in the places where the products are consumed because they are not formally counted under greenhouse gas inventories.
In the European Union, for example, while domestic emissions have declined since 2015, imported emissions have remained unchanged, the analysis shows. In some countries, like Austria or Sweden, they are as high as the country’s entire annual carbon footprint.
-
Türkiye says it has “final decision” at COP31 despite Australia running negotiations
COP31 President-Designate Murat Kurum told journalists that, while the two countries have been working well together, Türkiye has the final say over the Antalya summit -
As science comes under attack at UN talks, climate movement splits over how to respond
A rift over how IPCC messages are produced and turned into policy is creating tensions in the world’s most influential coalition of climate NGOs

Former EU lead climate negotiator Jacob Werksman said that under the Paris Agreement, these traded emissions are accounted for in the countries where they are originally produced, but importing countries can also take responsibility for their consumption.
“It starts with a wide recognition by many jurisdictions around the world that we need to know the carbon content of these products, and we then need to agree what is a fair, effective, transparent and relatively easy-to-implement way of measuring that carbon in traded products,” he told a launch event for the trade emissions tracker, which contains data for different countries, sectors and gases.
Trade and its role in addressing climate change has become a higher priority at UN climate talks after a push led by emerging economies including China, India and South Africa led to the first trade and climate change dialogue held this year at the mid-year session in Bonn.
At the upcoming COP31 UN summit in Antalya, some voluntary initiatives like the Brazil-led Integrated Forum on Climate Change and Trade are expected to continue, but the issue does not feature in Türkiye’s Action Agenda of climate initiatives and formal negotiations are not scheduled on the topic.
China: the world’s top emissions exporter
As a manufacturing powerhouse, China ranks first in the new tracker as the world’s top-emitting country, but the data shows that a large chunk of the country’s carbon emissions – an amount larger than Brazil’s entire annual carbon footprint – are linked to products that are exported and consumed abroad.
Russia, Brazil, the US and the EU rank as the top destinations for Chinese trade-related emissions, which are mostly linked to components for power generation, basic metals like copper and lead, and non-metallic minerals like graphite and phosphorus.
Yet China is also the world’s top emissions importer, related mostly to agricultural products, fossil fuels and minerals brought from the US, the EU, Japan and India, among others. The US ranks second by a close margin, with both countries importing about 1.6 billion tonnes of CO2 equivalent.
China’s industrial engine starts to break its fossil fuel habit
Richard Baron, ECF’s industrial policy and trade director, said Chinese clean energy products are key for reducing emissions around the world, adding that Europe is “not able to do without those technologies” for its energy transition.
“China has an emissions trading system that counts CO2 differently there. But if China and the EU were to agree on some kind of translation mechanism to say ‘this is how we measure it’, and companies can understand the protocol to navigate both markets, that would set the tone for a lot of other conversations,” he said at the platform’s launch event last week.
The analysis suggests that if the EU and China aligned their climate requirements for products, the resulting standards could influence trade flows representing about 7% of global emissions.
Baron said there’s “a plethora” of multilateral spaces to hold these discussions, including the climate and trade dialogue at the UN climate talks or the Climate Club at the Organisation for Economic Co-operation and Development (OECD), which seeks to cut industrial emissions.
Trade breaks into agenda of UN climate talks – but will it have teeth?
Controversial trade measures
Instruments like the Europe’s Carbon Border Adjustment Mechanism (CBAM) – a recent piece of legislation that penalises emissions-heavy imported products – are one tool that could be used to address trade-related emissions, said Antoine Oger, executive director at the Institute for European Environmental Policy.
He said a significant portion of imported emissions in Europe are already covered by CBAM, as it includes sectors like cement, iron and steel, fertilisers and aluminium. This then allows the EU “to engage in constructive dialogue with our trade partners”, he added.

But across diplomatic summits, including at UN climate talks, emerging economies have pushed back heavily against the CBAM and other trade measures. The most recent BRICS declaration adopted on Saturday by 11 such countries – including China, India and Russia – condemns “protectionism under the guise of environmental objectives”.
The declaration calls for the “elimination of such unlawful measures”, which they argue have “far-reaching negative implications for the human rights, including the rights to development, health and food security” of vulnerable communities.
“The question of responsibility is a political question,” Oger said. “These emissions exist – they are emitted somewhere to make a product that will be consumed elsewhere. So you can debate responsibility but the idea is for the two parts to recognise there’s a problem.”
The aim, he added “is not to point fingers, but to accept this is a reality of our emissions profiles and ask what we can do about it”.
The post International trade linked to 20% of global emissions – but imports ignored appeared first on Climate Home News.
International trade linked to 20% of global emissions – but imports ignored
All the ambulance services in England experienced some of their busiest-ever days during this summer’s record-breaking June heatwave, according to data obtained by Carbon Brief.
In June, temperatures climbed past 37C in parts of the country as authorities declared only the second ever “red” extreme heat warning.
Four out of 10 NHS ambulance services, including London’s, responded to unprecedented numbers of life-threatening emergencies on at least one day from 23-27 June.
Another two services – in the south-west and east of the country – received their highest volume of 999 calls on record.
Ambulance services provided data on their busiest days since records began, in response to freedom-of-information (FOI) requests from Carbon Brief.
The results show how demand during the June heatwave exceeded levels seen during the traditionally busy winter season in other years – and even the height of the Covid-19 pandemic – for many services.
Heat demand
Extreme heat ramps up the risk of numerous life-threatening conditions, including heart disease and respiratory problems.
England experienced record-breaking temperatures at the end of June, with the whole country covered by amber or red “heat health alerts” from the government.
A red alert, which was issued for the entire Midlands and south of England, indicates “significant risk to life for even the healthy population”. This was only the second time such an alert has been triggered.
Researchers calculated that there were nearly 3,000 heat-related deaths in the UK this summer. There has also been unprecedented demand for A&E departments and some ambulance services.
To investigate the strain facing ambulances, Carbon Brief sent FOI requests to the 10 NHS ambulance trusts in England, asking for lists of their busiest days.
This covered both the total volume of 999 calls and “category 1” responses – referring to incidents involving “life-threatening injuries and illnesses”, such as heart attacks.
The chart below shows the busiest days on record for England’s ambulances, including both total calls and category 1 responses. Most services were able to provide records back to the 2010s. (See: Methodology.)
The five-day period from 23-27 June is overrepresented in these results, with at least two heatwave days ranking in the top 20 for every service in the country.
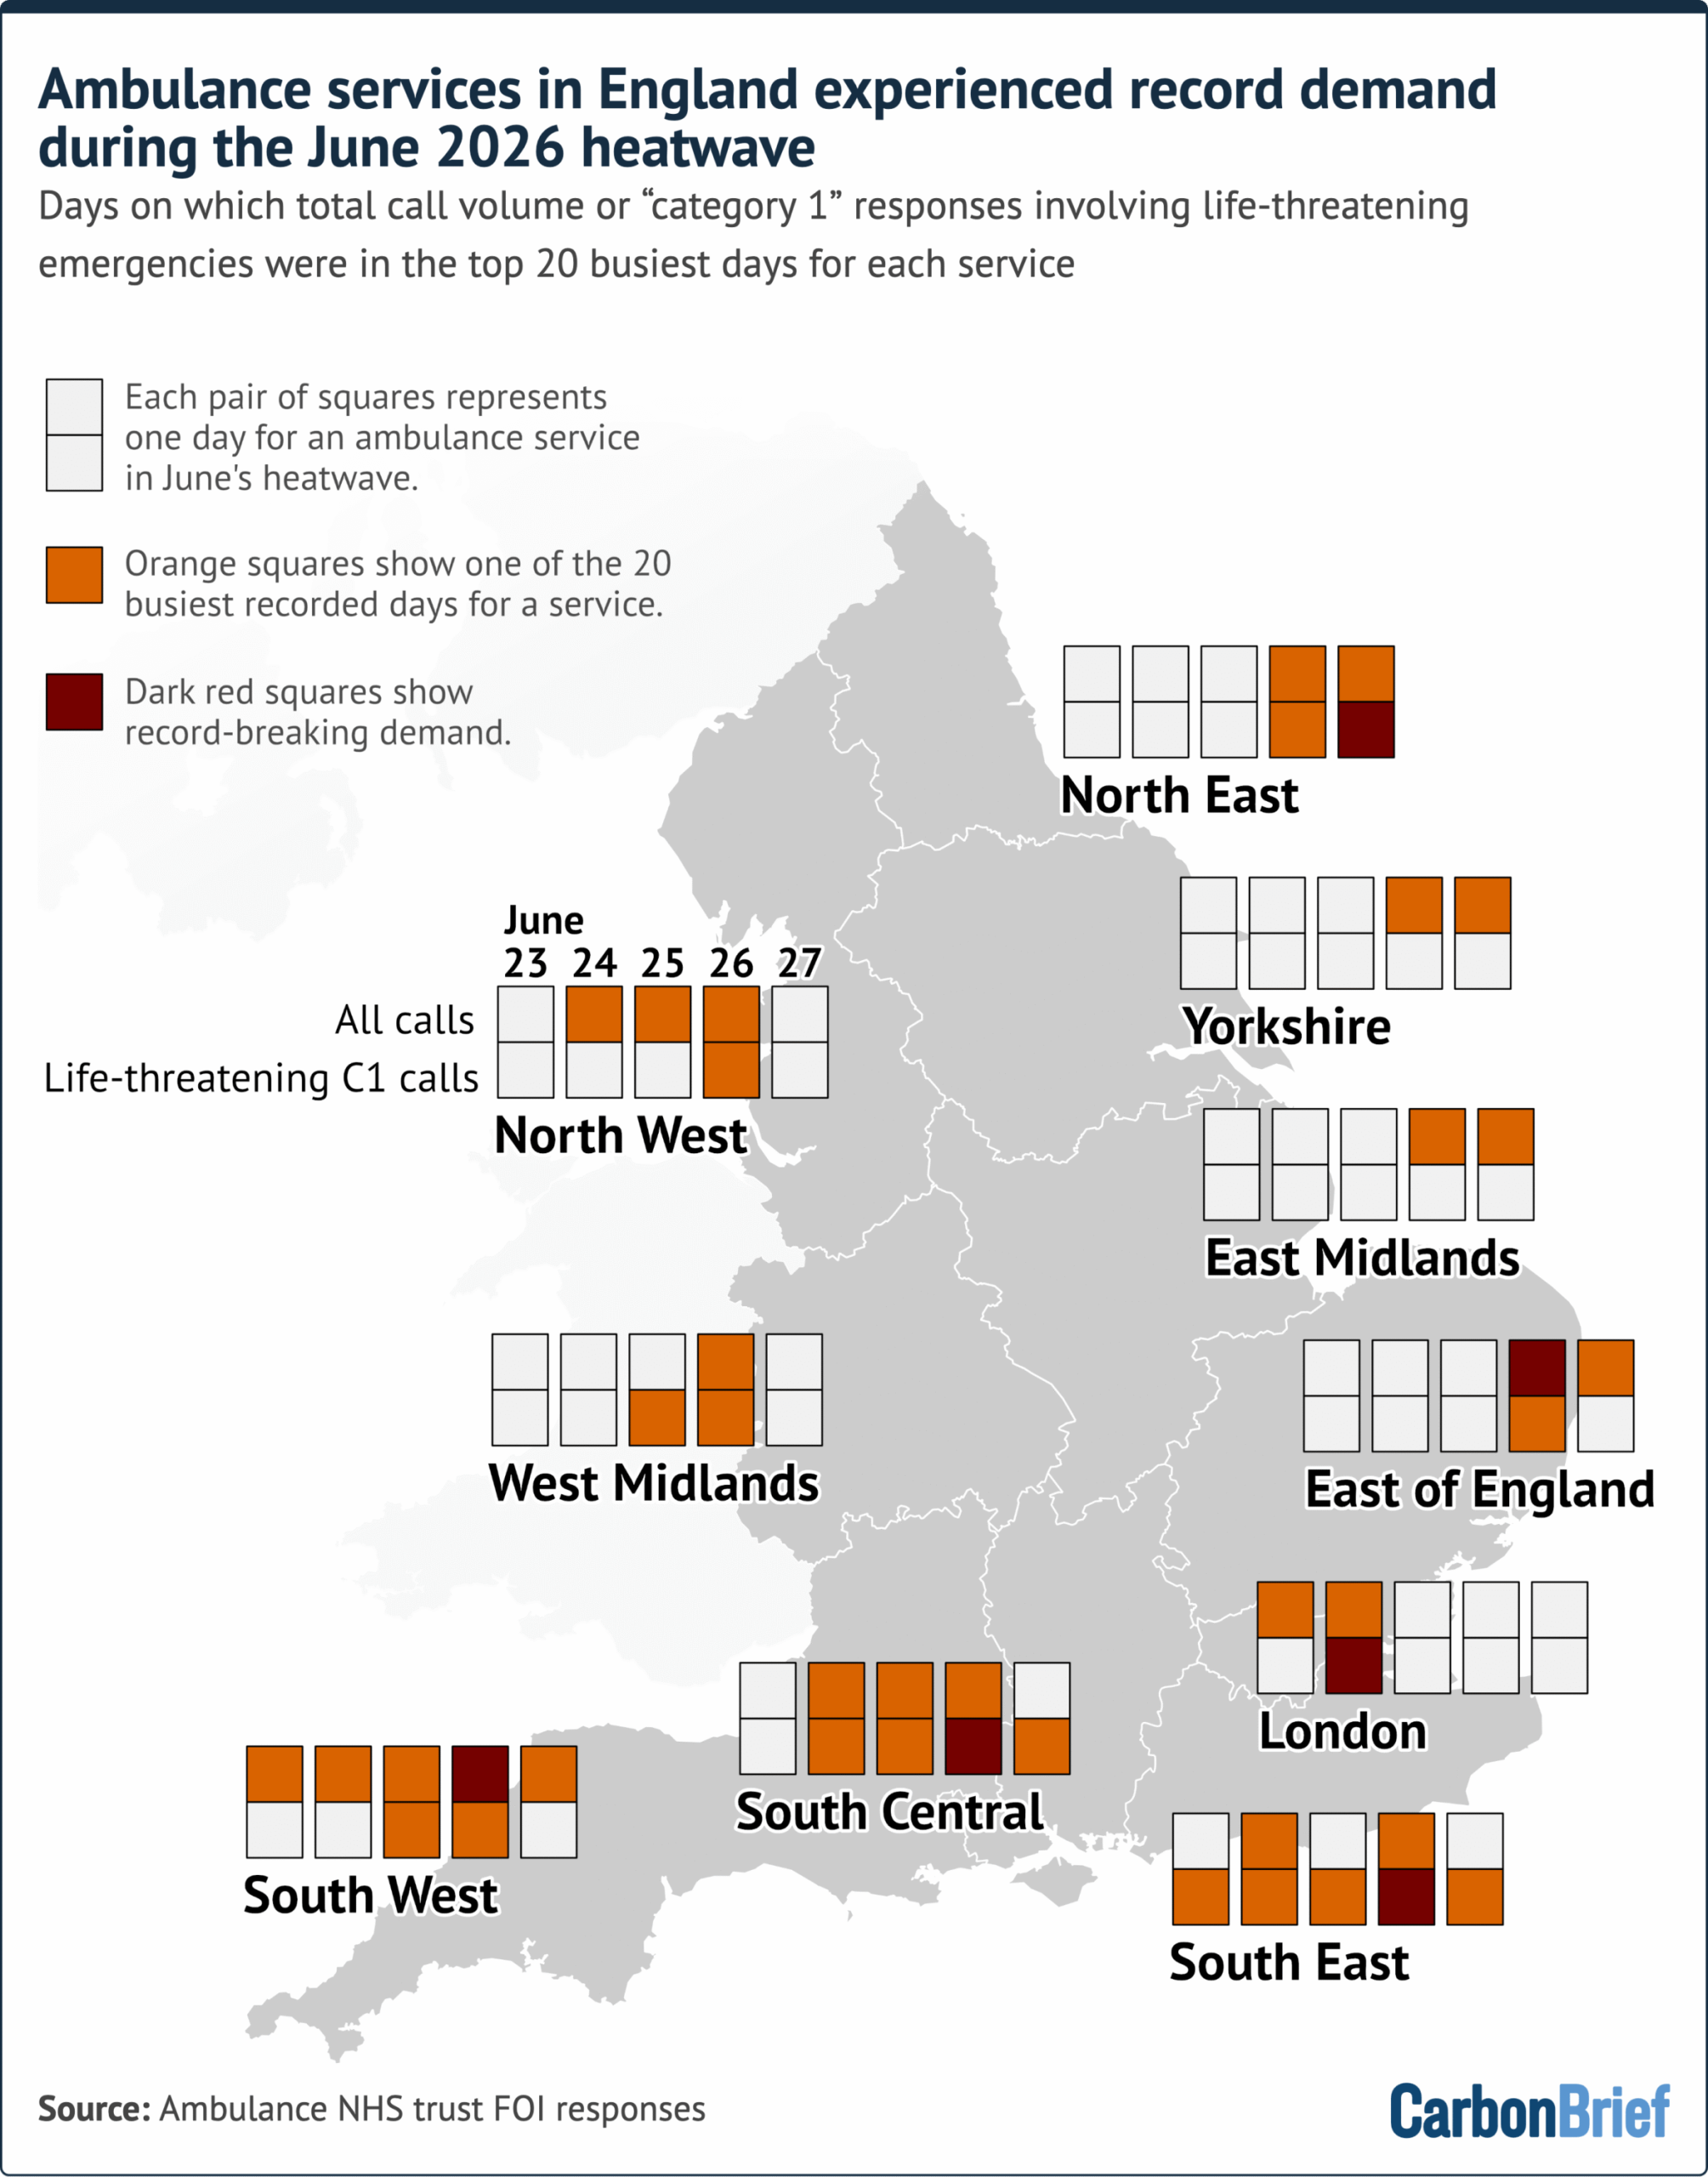
This trend is especially pronounced in the south and east of England, where June temperatures exceeded 36C and even approached 38C in some regions.
London, South East Coast, South Central and North East ambulance services all reported daily records for responding to life-threatening emergencies during the heatwave.
For the South East Coast and South Central services – which cover a region stretching from Oxfordshire to Kent – 25, 26 and 27 June all saw unprecedented numbers of category 1 callouts.
South Western and East of England services both saw record numbers of 999 calls on 26 June, the same day the highest-ever June UK temperature was reported in Norfolk.
It is worth noting that demand for ambulance services – including category 1 calls – has been growing for many years, driven by factors such as an ageing population, more complex health conditions and growing mental-health pressures.
This helps to explain why dates from before the 2020s are rare in the top rankings provided to Carbon Brief.
Beyond the heatwave, 2026 as a whole is on track to be a record year for ambulance demand.
‘Stifling heat’
On 26 June, the busiest day of the heatwave, ambulances across England responded to 4,084 life-threatening emergencies.
The average daily volume of such incidents is normally around 2,500 during the summer months.
Stu Holliday, head of emergency preparedness, resilience and response at North East Ambulance Service, tells Carbon Brief:
“During periods of hot weather, we typically see an increase in calls from people affected by dehydration, heat exhaustion and heatstroke, as well as those whose existing health conditions, particularly heart and respiratory illnesses, can be made worse by prolonged high temperatures.
“Older people, young children and pregnant people can be especially vulnerable.”
Ambulance teams are generally busier in the winter because cold weather and seasonal illnesses drive up the number of severe medical emergencies.
However, the data from June shows that extremely hot days are starting to match or even edge out cold ones as the busiest days. This is a trend seen across the healthcare system.
While not every service provided records back to 2019, the data broadly shows that ambulances were busier during the heatwave than at the height of the Covid-19 pandemic.
As well as patients, heatwaves put pressure on ambulance workers. The UNISON union has warned of crews facing “stifling heat with faulty or no air conditioning” and “back-to-back callouts” due to increased demand.
Methodology
Carbon Brief requested data on the top 50 busiest days for England’s 10 main ambulance services.
These are: London; South East Coast; South Central; South Western; West Midlands; East Midlands; East of England; North East; Yorkshire; and North West.
Data was requested for as far back as service records go. Most were able to provide records going back to some point in the 2010s, with the exception of North East and South Central, which only had records from 2021 and 2022 onwards, respectively.
Rising annual demand for ambulance services means that most of the busiest days for ambulances have been in the 2020s. For example, all but four of the busiest days for category 1 emergencies reported to Carbon Brief were in the 2020s.
Carbon Brief requested data on ambulance demand for all the UK nations. In Scotland and Northern Ireland – where temperatures are cooler – services did not see call volumes reach the top 50 rankings during the June heatwave. The Welsh Ambulance Service did not respond to Carbon Brief’s request.
related

Revealed: More than 1,000 NHS operations cancelled due to record UK heatwaves

Climate change is driving a ‘shift’ in childhood malaria risk across Africa

Q&A: How heat-related deaths are counted by scientists and public health authorities

Guest post: France’s June heatwave caused more than 2,700 heat-related deaths
The post Revealed: England’s June 2026 heatwave sparked record demand for ambulances appeared first on Carbon Brief.
Revealed: England’s June 2026 heatwave sparked record demand for ambulances
Reform UK, led by Nigel Farage, has emerged as a major force in UK politics in recent years – pushing anti-net-zero policies, alongside vehement opposition to immigration.
The hard-right populist party is currently mired in a funding controversy and only has a handful of MPs, yet, until recently, it had been leading in national polls for more than a year.
As seen with many similar parties across Europe and beyond, a rejection of climate science is central to Reform’s ideological outlook.
Richard Tice, the party’s deputy leader, is a vocal critic of what he calls “net stupid zero” and has incorrectly blamed “the sun or volcanoes” for human-caused global warming.
As Reform’s energy spokesperson, Tice has also been clear that, if the party were ever to form a national government, it would scrap the UK’s net-zero target, support fossil-fuel expansion and tear up existing contracts for renewable energy.
While less vocal on the subject, Farage has, nevertheless, expressed climate-sceptic views and falsely blamed net-zero policies for the “deindustrialisation of Britain”.
These views draw on long-standing, inaccurate climate-sceptic narratives and are reflected in Reform’s election manifestos, its actions in local government and the opinions of many of its supporters.
Here, Carbon Brief gathers together by topic and factchecks 45 false or misleading claims made by the party’s leadership relating to climate change, renewables and net-zero.
Climate science
FALSE
Tice: “There’s no evidence that man-made CO2 is going to change climate change…The Norwegian government’s own equivalent of our ONS [Office of National Statistics] has recently produced a report along the lines of what I’m saying.”
Sky News, February 2025
The world’s authority on climate science, the Intergovernmental Panel on Climate Change (IPCC), says it is “unequivocal” that humans have warmed the planet, primarily through releasing greenhouse gases.
The IPCC says that, due to human activities, concentrations of carbon dioxide (CO2) “have increased at rates that have no precedent on centennial timescales in at least the past 800,000 years”.
It adds that concentrations of CO2 in the atmosphere are now higher than they have been for at least the past two million years.
The report that Tice is referring to is by two independent authors, with Statistics Norway clarifying in 2024 that their views are “not the official stance” of the statistics bureau. (It has also not been formally peer reviewed.)
A factcheck of the Norwegian report by a climate scientist for RealClimate describes it as “misguided” and a “distraction due to errors”.
Another factcheck published by the Norwegian University of Science and Technology found it “contains standard talking-points of climate denial”.
MISLEADING
Tice: “Look, the climate’s always changed for millions of years. And it goes through cycles, long, medium and short.”
Bloomberg, May 2026
Global temperatures are currently around 1.4C hotter than when the industrial era first began in 1850-1900, as shown in the figure below.
The IPCC says that this amount of warming is likely to have made Earth hotter than at any time in about 125,000 years.

Scientists overwhelmingly agree that approximately 100% of this warming has been caused by humans.
There are also natural influences that can affect Earth’s climate on shorter timescales, such as El Niño events, volcanic eruptions and small variations in the output of the sun. However, scientists have found that these have only a limited effect on the underlying trend of long-term global warming.
When looking at longer timescales of millions of years or more, Earth has experienced multiple ice ages interspersed with warmer periods.
These changes in climate were triggered by variations in Earth’s orbit around the sun, in combination with subtle fluctuations in the tilt and rotation of the planet, over tens of thousands of years. However, the resulting changes to CO2 levels in the atmosphere also played a role.
This should serve as a “cautionary example”, according to Dr Zeke Hausfather, a climate scientist and Carbon Brief contributor, “because human emissions of CO2 and other greenhouse gases push the Earth further out of the range of climate conditions that have characterised the past few million years”.
FALSE
Tice: “The idea that you can stop the power of the sun or volcanoes is simply ludicrous.”
BBC Breakfast, June 2024
Scientists overwhelmingly agree that humans have caused 100% of recent climate change.
Tice’s suggestion that the sun or volcanic eruptions are behind current warming is false.
As the video below explains, the sun and volcanic eruptions have little bearing on the long-term trend of global temperature rise since the Industrial Revolution.
MISLEADING
Farage: “All I do know is that man produces about 3% of the CO2 produced in the world every year and that it is nuts to call CO2 a poison.”
BBC Radio 5 Live, June 2024
The amount of CO2 in the atmosphere is now higher than it has been for at least two million years, having spiked dramatically since the Industrial Revolution.
This surge in CO2 levels is entirely due to human activity, particularly the burning of fossil fuels. While Farage is correct that, on an annual basis, humans only account for a few percent of all the CO2 that is released into the atmosphere, this is irrelevant.
The world’s land and ocean naturally release hundreds of billions of tonnes of CO2 each year. However, the land and ocean also absorb hundreds of billions of tonnes of CO2 each year, meaning that – before the start of the fossil-fuel era – these flows were broadly in balance.
The recycling of CO2 through Earth’s natural systems is known as the “global carbon cycle”.
Since the start of the Industrial Revolution, humans have disrupted Earth’s natural balance by releasing vast amounts of CO2 into the atmosphere.
The IPCC says that, because of humans, concentrations of CO2 “have increased at rates that have no precedent…in at least the past 800,000 years”.
It adds that concentrations of CO2 in the atmosphere are now higher than they have been for at least the past two million years.
FALSE
Tice: “Many thousands of scientists fundamentally disagree about the need to [reach net-zero], or the pace to [achieve net-zero]…But they have been smeared and labelled. They can’t get any research grant funding.”
Bloomberg, May 2026
Contrary to Tice’s claim, there are not “thousands” of scientists that disagree on the need for net-zero.
Tice is likely referring to a “world climate declaration” that was circulated on social media by climate sceptics in 2022, supposedly signed by “1,200 climate experts”. A closer look at the list of signatories revealed that less than 1% described themselves as climate scientists – and six of the people on the list were dead.
Reaching net-zero emissions globally is the “only way” to stop climate change, according to the IPCC. The IPCC’s most recent set of reports involved 721 scientists in 90 countries.
All modelled pathways for limiting global warming to 1.5C by 2100, the ambition of the Paris Agreement, involve reaching net-zero emissions around the middle of the century.
This is reflected in the text of the Paris Agreement, which aims to “achieve a balance between anthropogenic emissions by sources and removals by sinks of greenhouse gases in the second half of this century”.
FALSE
Tice: “The proof of my argument is one of the IPCC reports a few years ago that said even if you get to net-zero effectively tomorrow, it’ll make no difference to one of the key things people are most worried about, which is sea level rise, for somewhere between 200 years on the one hand and 1,000 years on the other hand.”
Bloomberg, May 2026
Although it is true that sea level rise is set to worsen, even if countries reach net-zero, it is certainly not the case that making efforts to cut emissions will make “no difference”.
Tice is likely referring to the IPCC’s special report on 1.5C released in 2018.
It said with “high confidence” that human-caused global warming to date will “persist for centuries to millennia and will continue to cause further long-term changes in the climate system, such as sea level rise”.
A more recent study, published in Nature Climate Change in 2025, found that following current climate policies would cause an extra 79cm of sea level rise by the year 2300.
However, reducing emissions in line with 1.5C would cut this additional sea level rise to 15cm.
Moreover, the best-available evidence shows that warming will more or less stop when the world reaches net-zero emissions. Even if some sea level rise continues, net-zero would still prevent a long list of other increasingly severe climate impacts from taking place.
FALSE
Tice: “The IPCC has just resiled from one of its core assumptions, which was the [RCP]8.5 scenario…One of the foundations of the IPCC’s very ethos in the last 20-30 years, they’ve just abandoned.”
Bloomberg, May 2026
The “foundations” of the evidence on climate change, as well as the risk of “catastrophic” warming without stronger action, are unchanged by the recent shift on “RCP8.5”.
“RCP8.5” is one of a range of emissions scenarios that climate scientists have used when making projections about future climate change. It is a scenario of very high global emissions, imagining a future with large increases in coal use and no climate policies.
In May 2026, a new set of emissions scenarios were published, no longer including a scenario with emissions as high as those in RCP8.5 (or its successor, SSP5-8.5).
This moment was seized upon by a range of climate-sceptic and rightwing figures – including US president Donald Trump – who falsely claimed it as evidence that the IPCC had to “admit” that it was “wrong” about future climate change.
This is incorrect because it both misrepresents the meaning of the shift on RCP8.5 and because the set of emissions scenarios in question were not developed by the IPCC in the first place. Instead, they were put together by a group of climate modelling experts. (See Carbon Brief’s factcheck for more information.)
While the new scenarios no longer include such high emissions as in RCP8.5 – partly as a result of limited climate policy success – they also show it is now “not possible” to limit global warming to 1.5C above pre-industrial levels without significant “overshoot”.
Moreover, projections suggest that the world is still on course for between 2.5C and 3C of warming. This level of warming was previously described as “catastrophic” by the UN.
MISLEADING
Tice: “Cleaner air equals higher temperatures, not CO2.”
According to the IPCC, 100% of warming since the Industrial Revolution is due to human-caused greenhouse gas emissions, particularly CO2.
Tice cites a Daily Telegraph article with the incorrect headline: “Heatwaves caused by fall in pollution.” He erroneously claims this as evidence that “we have been gaslit and lied to” about the causes of climate change.
In fact, as a Carbon Brief factcheck of that article notes, scientists say that the framing of heatwaves being “caused” by declining air pollution is simply “wrong”.
The claim is based on a paper in Geophysical Research Letters, which looks at how air pollution affects circulation patterns in the atmosphere and influences summer temperatures in Europe.
Scientists have long known that human-caused emissions of aerosols “mask” global warming, partly because they reflect or absorb sunlight. Curbing air pollution, therefore, removes some of this cooling effect.
Nevertheless, the lead author of the study in question is clear that greenhouse gas emissions remain the “most important factor” driving Europe’s extreme heat events, due to their role in global warming.
A recent attribution study by the World Weather Attribution service concluded that the June heatwave in Europe would have been “virtually impossible” without climate change.
Net-zero target
FALSE
Tice: “Net-zero will make zero difference to climate change.”
BBC Breakfast, June 2024
In fact, reaching net-zero emissions globally is the “only way” to stop climate change, according to the Intergovernmental Panel on Climate Change (IPCC).
At that point, when carbon dioxide (CO2) emissions have been cut substantially and any remaining emissions are balanced out by CO2-removal technology or tree-planting, then warming is expected to essentially stop.
FALSE
Tice: “It’s incredibly stupid for the UK to almost unilaterally say, we’re going to lead the way in the world.”
Bloomberg, May 2026
It is completely false to argue that the UK is acting “unilaterally” to tackle climate change.
The UK has indeed been a leader in climate legislation. When the then-Conservative government set the UK a legally binding “net-zero by 2050” target in 2019, it was the first major economy to do so.
However, 140 of the world’s 198 countries now have net-zero targets, covering 74% of the world’s emissions. Some have set more ambitious goals, such as Germany’s target of reaching net-zero by 2045, while others are even aiming for “net-negative” emissions.
The UK is, therefore, not pursuing net-zero “unilaterally”. Indeed, if the UK abandoned its net-zero target, it would join the US and Iran as the only major emitters without one.

MISLEADING
Tice: “We’re responsible for 0.7, 0.8% of CO2 emissions.”
Bloomberg, May 2026
The UK’s annual emissions, including emissions from fossil fuels and land-use changes, were roughly 0.7% of the global total in 2024, the most recent year for which data is available. When only considering fossil-fuel combustion, the figure is 0.8%.
Yet, while the numbers Tice quotes are accurate, it is misleading to use them as a justification for abandoning climate policies.
Only six nations each produce more than 2% of the world’s annual emissions. In 1990, the UK was one of those rare countries, but it has roughly halved its share since then, largely due to renewable-energy expansion. Even today, it remains the world’s 22nd largest emitter.
As the chart below shows, more than a third of all greenhouse gases come from the roughly 180 nations that produce 1% or less of the world’s emissions. If none of them acted, the world would never stop climate change.

Finally, some analysts point out the UK’s “moral responsibility” to act on climate change, given its large historical contribution to current levels of global warming.
The UK, through its historical CO2 emissions, is responsible for around 3% of current warming. When emissions in other countries under the UK’s colonial rule are counted as well, its share grows to more than 5% of the global total.
FALSE
Tice: “[Net-zero is] killing our economy.”
Bloomberg, May 2026
Efforts to cut the UK’s emissions are not “killing the economy”. In fact, there is plenty of evidence that they are boosting the economy.

UK emissions in 2025 were 54% below 1990 levels, the baseline year for the nation’s climate goals. The UK economy has nearly doubled in size over the same period, as the chart below shows.
GDP has also continued to grow since the net-zero target was introduced in 2019.
A 2026 report from the CBI Economics – the consultancy arm of the Confederation for British Industry (CBI) – concluded:
“Net-zero is already one of the UK’s most productive and geographically distributed industrial sectors, generating high-value employment, driving supply chain activity, and anchoring the UK within one of the defining economic transformations of our era.”
The report concludes that the net-zero economy generated around £105bn in gross value added in 2025. It also supported 1.1m jobs across the country, with considerably higher wages than the UK average.
FALSE
Tice: “The cost of net-zero, which the Climate Change Committee admits is in the trillions of pounds, we don’t know how many trillions, who’s paying that? The British people.”
Bloomberg, May 2026
The Climate Change Committee (CCC) estimates that it would cost the UK a total of £108bn to reach net-zero by 2050, equivalent to 0.2% of GDP, while the Office for Budget Responsibility (OBR) says this would be far cheaper than failing to act.
The idea that net-zero will cost the UK trillions of pounds is false. Such claims invariably rely on analysis that exaggerates the capital cost of net-zero, while excluding both the benefits of cutting emissions and the costs of a system without net-zero policies.
One prominent recent example, promoted by Reform UK, relied on the assumption that gas boilers and petrol cars, for example, would cost nothing to buy and would have free fuel.
The idea that the CCC has “admitted” that net-zero will cost “trillions” may stem from a misinterpretation of CCC analysis from 2019, which estimated a net cost of £321bn.
Alternatively, Tice may be conflating this with another misinterpretation in the 2024 Reform UK manifesto, which falsely claimed that the cost of net-zero would be “£2tn or more”, according to the National Energy System Operator (Neso).
In fact, Neso had estimated that the cost of a net-zero energy system would be “broadly the same” as a high-carbon alternative.
Since then, the CCC has calculated that the net cost of investments needed to reach economy-wide net-zero will be around £108bn out to 2050, or less than 0.2% of GDP. Not only are the up-front investment costs lower than originally thought, but, by the 2040s, there will likely be large operational savings, due to clean technologies being cheaper to run.
There are also benefits from reaching net-zero, such as avoiding climate damages from cutting emissions and shielding the UK from fossil fuel-driven energy price spikes.
The government, therefore, expects net-zero to deliver substantial economic value to the UK, when weighing both the costs and benefits of meeting the target. The government says meeting its climate target for 2040 would yield net benefits worth £865bn.
Similarly, other bodies, such as Neso and the OBR, find that net-zero is the “cheapest” option for the UK, when compared with failing to cut emissions.
Finally, contrary to Tice’s comments, the vast majority of the capital costs of reaching net-zero will not be borne by public funding from the “British people”. The CCC estimates that 65-90% of the capital required will come from the private sector.
FALSE
Tice: “Labour’s reckless net-zero fantasies are destroying hundreds of thousands of industrial jobs.”
Press Association, July 2025
The transition to a net-zero economy is expected to boost the UK economy and create hundreds of thousands of new jobs.
In a “landmark moment”, as of 2024, there were more people employed in the UK clean-energy sector than the oil and gas industry for the first time, according to the Renewable Energy Association.
While jobs in some sectors are expected to decline in the coming years, there is currently no evidence that “hundreds of thousands” of jobs have been “destroyed” by the net-zero target.
The CCC says that there is a lack of “robust data” on whether UK climate policies have already driven job losses, but notes that “this is unlikely to be the case, as most decarbonisation has occurred in sectors where employment declined for other reasons”.
This can be seen in the employment figures for coal mining, steelmaking and oil and gas production, three industries that were mainstays of the UK economy.
As the chart below shows, all of these sectors employ fewer people today than they did in the past. But their major declines happened long before the net-zero target was set, resulting from a wide range of factors including coal being replaced by cheaper fuels, cyclical downturns in oil prices and competition with steel production overseas.

(The chart above only includes jobs in oil and gas extraction, but figures for UK fossil-fuel jobs vary considerably between sources, depending on the sectors classed as relevant. Industry body Offshore Energies UK cites a much broader figure of 180,000 jobs in 2024, which includes “supply chains and regional economies”.)
This does not mean that there will be no impact on the UK workforce in the future.
A literature review by the CCC concluded that the “phase-down of high-emitting sectors and redirection of sectors” could threaten 8,000-75,000 jobs. This could include roughly 15,000 oil-and-gas workers and around 1,000 people working in coal mines.
One of the sectors that could see big changes is livestock farming, as UK diets shift away from emissions-intensive animal products. Notably, this shift is already taking place without any intervention from the government, let alone net-zero policies.
The CCC also expects there to be “extensive job creation” as the country transitions to a net-zero economy. Job gains in low-carbon sectors, such as renewable energy and clean heating, are set to far surpass losses in other sectors, as the chart below shows.
Overall, the committee says 135,000 to 725,000 “net” new jobs are set to be “created by net-zero”.

Rather than opposing net-zero targets, some trade unions have stressed the need to support a “just transition” for workers in fossil fuel-intensive sectors.
Industry groups have also pointed to the significant employment opportunities that a “net-zero economy” will bring.
FALSE
Farage: “We view the net-zero targets as being the prime reason for the deindustrialisation of Britain.”
Reform UK press conference, February 2025
Net-zero is at the heart of the UK’s industrial strategy and it has frequently been described as the “economic opportunity of the century”.
CBI chief economist Louise Hellem has described the net-zero economy as “a major part of the national industrial base”, while the Aldersgate Group says net-zero has the potential to be “the UK’s growth engine”.
Moreover, net-zero targets – set in 2019 – are clearly not the “prime reason” for the UK’s “deindustrialisation”, which has been underway for decades.
Since around the 1960s, major industries such as steel and mining have declined in the UK. There are various reasons for this, including globalisation, but the timeline does not match up with the creation of climate legislation.
Around 30% of the nation’s workers were employed in manufacturing after the second world war. By 2000-2016, the period in which the UK introduced its first major climate policies, this had already dropped to 10%, according to the ONS.
In recent years, businesses have warned that the UK’s relatively high industrial electricity prices are driving further “deindustrialisation”. This has been a talking point for those seeking to blame the nation’s net-zero strategy for driving high prices.
However, these arguments tend to omit the UK’s high exposure to expensive gas, which sets the nation’s wholesale electricity prices most of the time.
The UK steel industry itself says that this exposure to gas is the key reason why it faces much higher electricity prices than counterparts in countries such as France and Germany.
Energy costs
FALSE
Farage: “If we had carbon-free electricity it would cost over a trillion – and maybe nearer two – to upgrade the entirety of our grid.”
Press conference, August 2025
Cutting the UK’s emissions by using clean power to run an electrified economy is expected to significantly reduce consumer bills.
This is because electrified technologies, such as EVs and heat pumps, are significantly more efficient than fossil-fuel alternatives.
Moreover, the UK would be consolidating three separate energy systems – electricity, gas and transport fuel – into a unified, more efficient and electrified whole.
It would cost £108bn to reach the UK’s net-zero target – including a “carbon-free” electricity grid – according to the Climate Change Committee (CCC).
This includes the investment needed to build a low-carbon energy system, instead of maintaining one built on fossil fuels.
Crucially, it also takes into account the running costs of the two systems, such as the much higher cost of fuel needed for petrol cars, as shown below.

Investing in a net-zero economy would bring benefits worth around £865bn, according to the government. Unlike the CCC figures, this includes avoided climate damages.
It is not clear where Farage’s false claim comes from.
The 2024 Reform UK manifesto included a similar false claim that the “cost of net-zero has been estimated by the National Grid and others at some £2tn or more”.
In reality, the then-National Grid Electricity System Operator – now Neso – had said in 2020 that the cost of building and operating the UK energy system would be “broadly the same”, with or without net-zero.
It is true that the UK will need to invest heavily in upgrading its electricity grid. This will cost some £64bn out to 2030 and another £89bn in the following decade, according to Neso.
This is around 10 times lower than Farage’s claim. But, crucially, it does not include the savings this investment will unlock, such as cheaper travel with electric vehicles.
FALSE
Tice: “There was a direct link between the growth in renewable generating capacity and the growth in electricity prices in the UK.”
Bloomberg interview, May 2026
It is expensive gas that has largely driven up electricity prices in the UK.
High gas prices caused two-thirds of the rise in electricity bills over recent years, according to the UK Energy Research Centre – and this was before the Iran crisis.
The UK has high electricity prices principally because its electricity system remains heavily reliant on gas-fired power plants. This means gas usually sets the price of UK power.
Moreover, the growth in renewable capacity has helped to protect UK billpayers during the latest fossil-fuel price shock, after the US and Israel attacked Iran.
This is an “early sign” that the government’s clean-power plan “may be working”, according to thinktank NESTA. It says “electricity [prices are] beginning to decouple from gas“.

Electricity systems that have high shares of renewable energy tend to have lower wholesale power prices, according to evidence from US states and from European countries.
As the University of Oxford’s Prof Jan Rosenow explains in a recent post on his Bright Spots substack, the “‘renewables make electricity expensive’ claim doesn’t survive contact with the wholesale data”. He adds:
“The countries with the most expensive wholesale electricity are the ones still dependent on gas to set their prices.”
Rosenow notes that the relationship between renewables and consumer bills is less clear, because these also include network charges, policy costs and taxes. He argues for reforms to ensure that “lower wholesale prices [from clean power] feed through into lower bills”.
The CCC also argues for reforms to make electricity cheaper. Still, it concludes that clean power coupled to faster electrification is the clearest route to lower energy bills for the UK.
FALSE
Farage: “Perhaps the real unfairness of net-zero policies…has been the impact on domestic bills, something about which there has been an absolute wall of silence.”
Press conference, February 2025
By far the biggest driver of increases in domestic energy bills in recent years has been the rising cost of gas, not “net-zero policies”.
Gas prices have been trending upwards since the mid-2000s, long before the UK even had a net-zero target. Initially, this was due to dwindling supplies in Europe – including the North Sea – as well as more global competition for gas.
Gas prices then surged in 2022 when Russia invaded Ukraine and cut off supplies to Europe. This year, war in the Middle East has once again sent gas prices soaring.
Most of the energy bill increases in recent years have been the result of wholesale gas costs rising due to these successive global crises.
There are some parts of domestic energy bills that could be described as “net-zero policies” – notably, the subsidies or “green levies” to support both old and new renewable energy.
However, these are not the drivers of recent price rises and are a much smaller component of a domestic energy bill than wholesale gas costs. (In addition, a chunk of policy costs have recently been moved off bills into general taxation.)
Moreover, the renewables they support have helped to curb the UK’s reliance on imported gas, saving the nation money.
Finally, the idea that this issue has faced a “wall of silence” is simply not true.
Energy bills and net-zero have been endlessly debated by politicians, commentators and the media. A pledge to cut energy bills was one of the central pillars of the Labour government’s election manifesto in 2024.
FALSE
Tice: “The cost of renewables plus backup, literally by definition, must cost more than backup because there is a cost of capital and a cost of retention of all of the backup…Don’t build it in the first place. We don’t need batteries.”
Bloomberg interview, May 2026
The UK is building a clean-energy system that will cost more to build – and much less to operate – than the current fossil-fuel economy.
Tice is ignoring half of this equation and – by definition – this means he is not giving a full picture.
For example, wind and solar do not need fuel to operate, whereas “backup” plants cannot generate power without gas or fuel oil.
It is highly misleading to look only at the capital investments needed to build wind, solar or gas plants, while ignoring the cost of operating them.
Electricity generation from wind and solar helped the UK avoid gas imports worth £1.7bn in the first two months of the Hormuz crisis alone, according to Carbon Brief analysis.
The CCC says that households could cut their bills by an average of £1,200 per year – even after higher upfront costs – by adopting solar, heat pumps and electric vehicles, as shown below.

Ultimately, an electrified economy built on renewables and other sources of clean power will reduce energy waste and cut bills, according to the CCC and others.
FALSE
Tice: “It is as cost-effective or indeed cheaper to put the cables underground.”
Press conference, February 2025
Contrary to repeated claims by Tice, there is clear evidence that it is significantly cheaper to build overhead electricity pylons than it is to “put cables underground”.
It is 3.5-5 times more expensive to bury cables than to run overhead wires, according to research published in May 2026 and shown in the figure below, with other similar studies.

The latest study, by consultancy Ramboll, shows that underground cables remain far more expensive, even where techniques such as “cable ploughing” are used to bury them.
The findings are in line with previous research published by the Institution of Engineering and Technology (IET) in April 2025.
This found that “underground cables are, on average, 4.5 times more expensive than overhead lines”. It said that undersea cables “can be up to 11 times more costly”.
Another consultancy, DNV, reached very similar conclusions in 2024. The IET said the same back in 2012, when it estimated underground cables to be five times more costly.
All of these reports directly contradict claims made by Tice in a 2025 press conference:
“We are serving notice on National Grid…put the cables underground…It is as cost-effective, or indeed cheaper, to put the cables underground.”
Tice’s claim is based on a highly misleading interpretation of the East Anglia network study, published by Neso in 2024.
This study put a price on various options to reinforce the electricity network in the east of England, including a planned overhead route from Norwich to Tilbury.
Contrary to Tice’s claims, figures from project developer National Grid suggest that using underground cables for this route would be 6.5 times more expensive than overhead wires.
If all of the country’s planned new electricity cables were put underground, it could cost up to an extra £22bn, according to Sam Dumitriu, head of policy at thinktank Britain Remade.
FALSE
Tice: “[A ‘windfall tax’ on renewables] is the best way that we can help get the bills down and lower the cost of living.”
Press conference, February 2025
Expensive gas has been the main driver of UK energy bill increases in recent years, particularly as successive global crises have sent global gas prices spiralling.
As such, reducing the UK’s exposure to international gas prices – as well as cutting its reliance on imported fuels for cars and boilers – is key to reducing bills.
Yet, Tice has claimed that the “best way” to cut bills would be through a so-called “windfall tax” on wind and solar power generators.
It is unclear how it would be possible to cut bills – by even a small amount – through an additional tax on renewables, which generate around half of the nation’s electricity.
With “windfall”, Tice borrowed a term that is often used for new taxes on the fossil-fuel companies making billions in additional profits due to war in Ukraine and the Middle East.
Renewables have helped to shield the UK from the impact of these conflicts, by curbing its reliance on gas and saving billions that would otherwise have been spent on costly imports.
Tice suggested that a new tax on renewable energy firms could help “recover” the money previously paid to them in subsidies. However, he has not offered any detail on how the proposed tax would work, how much money it would raise or what impact it might have.
A retrospective change to the tax treatment of existing energy infrastructure would hamper future investment in the system, whether that is for clean power or Tice’s own preferred energy sources.
Blocking renewables through a windfall tax and other changes could stop investments worth tens of billions of pounds, according to the New Economics Foundation thinktank.
MISLEADING
Farage: “Our electricity prices for industry are between five and six times higher than those in America.”
Press conference, February 2025
The UK primarily has high industrial electricity prices due to its exposure to high gas prices.
In turn, the UK and other European countries face much higher gas prices than the US.
This is particularly true since Russia cut off pipeline gas supplies to the continent amid its invasion of Ukraine in 2022 – a shift that has been reinforced by EU sanctions.
This means Europe is reliant on internationally traded liquified natural gas (LNG), for which it competes with Japan and other countries.
In contrast, gas prices are low in the US because supplies are often a by-product of more valuable oil extraction, which comes out of the ground with “associated” gas. The demand for US gas is also limited by the amount that can be exported overseas as LNG.
As such, while it is true that UK industrial electricity prices are high compared to other countries, the reasons are different to what Farage implies.
In addition, his claim that costs are “five to six times higher” than the US is overstated.
The most widely cited figures, based on International Energy Agency (IEA) data, suggest industrial prices are four times higher in the UK than those in the US.
Despite claims made by right-leaning commentators, it would not be possible for the UK to recreate the US gas market dynamics by fracking for shale gas, or by ramping up North Sea gas extraction.
Oil and gas
MISLEADING
Tice: “Let me remind you, in the 80s and 90s…we were growing at between 2.5% and 4% a year. We had deep, plentiful energy driven by oil and gas from the North Sea, right? No one was worried about the price of electricity. No one was worried about the quantity of supply. No one was worried about the reliability of supply.”
Bloomberg, May 2026
The UK extracted a significant proportion of its oil and gas resources from the 1980s onwards, after privatising the industry and using the revenue to cut income taxes.
Now, as anticipated at the time, there is very little fuel left to drill.
The UK went through a “dash for gas” in the 1990s, with North Sea gas production levels steadily increasing from the 1980s until the 2000s.

However, gas production in the North Sea fell by 74% between 2000 and 2025, while oil output fell by 75%.
This is not because policies favouring new oil and gas production ended, but rather because of competition from cheaper sources of the fuels and because the amount of fossil fuels left in the North Sea basin started to run out.
According to the Energy and Climate Intelligence Unit (ECIU) thinktank, around 90% of the oil and gas that is likely to be produced from the North Sea has already been burned.
It is also true that electricity prices were much lower in the 1990s than they are today. This is largely explained by rising gas prices – and increasing exposure to imports.
The UK dash for gas power was driven by cheap gas prices, which favoured a shift away from coal and nuclear. This included cancelling a planned fleet of new nuclear reactors.
When gas subsequently became expensive, electricity prices went up, because the UK was heavily exposed to the fuel. This dynamic continues today, although the rise of renewables is starting to break the link between gas and power prices..
FALSE
Tice: “We [would] allow licences to drill…If you increase the supply of anything, it’s basic economics, the price of that good will come down, as it does in America, where their gas price, their wholesale gas price, is give or take 30% of ours.”
Bloomberg, May 2026
Gas is cheap in the US because it is widely extracted as a byproduct of more valuable oil and because demand is limited by export capacity.
These dynamics – and the abundant, easily accessible shale resources in the US – are a function of geography and cannot be replicated in the UK.
North Sea production is in long-term decline and this cannot be reversed by new licenses, because most of the oil and gas that was under the ground has already been burned.
In addition, the production of oil and gas in the North Sea has very limited effects on global energy prices, which determine the cost of UK energy bills.
This is because the country is a relatively small producer, accounting for around 1% of global output. By contrast, the US is the world’s largest oil-and-gas producer.
FALSE
Tice: “If we’d had this common sense not to abandon our North Sea, we wouldn’t have been in that pickle [referring to importing LNG from the US].”
Bloomberg, May 2026
The UK is increasingly reliant on imported fossil fuels, because it has already used up most of the oil and gas that was once under the North Sea.
The country was a net energy exporter in 2000, but, by 2010, was dependent on imports for 30% of its energy supplies. On the same metric, the UK’s net import dependency reached 44% in 2024.
This is not because policies favouring new oil and gas production ended, but rather because the amount of fossil fuels left in the North Sea basin started to run out.
Gas production in the North Sea fell by 74% between 2000 and 2025, while oil output fell by 75%.
This decline has occurred despite the previous Conservative government, which was in power from 2010-24, holding six new licensing rounds and issuing hundreds of new oil and gas licences.
FALSE
Tice: “Why are the Norwegians drilling 49 new wells last year? Because they think there’s plenty more to go that’s worth going for. So, why are we so stupid that, on our side of the line, we think it’s a good idea to drill zero new wells?”
Bloomberg, May 2026
The UK has already used up most of the oil and gas that was under its part of the North Sea, whereas the state-run Norwegian system has taken a different approach.
Nevertheless, even the most optimistic of Norway’s official forecasts sees a steady decline in production over the coming decades, as their oil and gas also starts to run out.
UK fossil-fuel production is lower than Norway’s because of geology and the decisions that were taken in the past, neither of which can be changed by the current or any future UK government.
Specifically, the UK has already used up the large majority of its North Sea resources, having extracted around 90% of the oil and gas that is available.
In contrast, Norway has only used up 57% of the “expected recoverable resource” from its part of the North Sea, according to official estimates published by Norwegian Petroleum.
FALSE
Tice: “We’ve got lots of [oil and gas] reserves, but if you just say it’s not viable because you make the regulations and everything too expensive, then don’t be surprised if people say, well, there’s not much to go for.”
Bloomberg, May 2026
Projections of the amount of oil and gas that will be recovered from the North Sea have barely changed since the Labour government took office in 2024.
Tice’s suggestion that official estimates of North Sea reserves have been revised down as a result of the Labour government’s policies is, therefore, provably untrue.
For gas, there is little difference between official projections published before and after the government’s 2024 election win and its decision to ban new licensing, as shown below.

While the NSTA projections for oil have shifted more noticeably between 2023 and 2026, this largely relates to output from existing fields, rather than the potential from new drilling.
FALSE
Tice: “I go to Aberdeen and they’re literally losing a thousand jobs a month in and around Aberdeen and the oil and gas industry because of this mad policy.”
Bloomberg, May 2026
Jobs in North Sea oil and gas have been declining rapidly for decades, having fallen by a third between 2014 and 2023 – well before the current government took office.
However, the major driver of job losses has been the irreversible decline of the North Sea basin. Gas production in the North Sea fell by 74% between 2000 and 2025, while oil output fell by 75%.
This decline has occurred despite the previous Conservative government, which was in power from 2010-24, holding six new licensing rounds and issuing hundreds of new licences.
MISLEADING
Tice: “All of the nations who’ve got energy treasure, who are extracting it, they are growing, whether it’s America, whether it’s the Middle East, whether it’s in Asia.”
Bloomberg, May 2026
Fossil-fuel producers have received windfall profits as a result of price spikes in the wake of Russia’s invasion of Ukraine and the effective closure of the strait of Hormuz.
On the flip side of this, countries that rely on fossil-fuel imports – particularly in Europe and China – have been hit with an extra $330bn in costs since the Iran crisis began.
For the UK, the most effective way to cut the need for costly fossil-fuel imports is to continue expanding clean-energy supplies and the electrified technologies that use them.
It is true that the US economy is growing at a faster rate than Europe’s. This is down to a range of reasons, experts say, including the nation’s rapid uptake of AI.
Another factor is that import dependency has left the UK and others particularly exposed to the economic impacts of the recent fossil-fuel price spikes.
Meanwhile, there is also plenty of evidence to show that investing in clean energy is driving economic growth in countries around the world.
The International Energy Agency (IEA), the world’s energy watchdog, estimated that clean energy accounted for 10% of global GDP growth in 2023. The figure was 30% for the EU, according to the IEA.
Analysis published by Carbon Brief shows that clean energy drove more than a third of China’s GDP growth in 2025. And the International Monetary Fund (IMF) says that climate action will provide a long-term boost to China’s economy and energy security.
In the UK, emissions have “decoupled” from economic growth, according to Carbon Brief analysis.
The analysis found that UK emissions fell to 54% below 1990 levels in 2024, while GDP was up 84%.
FALSE
Farage: “Countries that frack get rich. Countries that don’t frack get poor.”
Edinburgh press conference, August 2025
The availability and accessibility of shale resources – and, therefore, the potential economic return from extracting oil and gas via fracking – is a function of geography and geology.
The UK’s shale gas resources are hard to extract and roughly 10-times smaller than initially thought. As a result, their potential to boost the UK economy is extremely limited.
While fracking has boosted economic growth in the US, there is little evidence to suggest this could be replicated by countries in Europe.
Only four countries frack for oil and gas at a large-scale commercial level: the US, Canada, China and Argentina.
Across much of Europe, fracking faces legal bans over concerns that the practice can contaminate water supplies and impact public health.
There are also practical and economic hurdles to fracking in Europe.
US oil majors abandoned efforts to establish a shale gas industry in Poland more than a decade ago. As the Economist noted in 2014: “There is no getting around geology.”
In the UK, fracking is unpopular with the public, with just 17% of people supporting it and 45% opposing it.
Any attempt to produce oil and gas via fracking would likely face protests and lengthy legal battles. Even if projects were able to go ahead, it would likely take years to produce a meaningful amount of gas .(See Carbon Brief’s fracking factcheck.)
Impacts and adaptation
MISLEADING
Tice: “Actually, what we need to do with climate change…we need to adapt to it.”
BBC Breakfast, June 2024
Climate change will keep getting worse until the world cuts emissions to net-zero.
Moreover, there are hard limits to adaptation, which can be overwhelmed by higher warming.
The longer emissions continue, the higher global temperatures will rise and the more nations such as the UK will have to adapt. It is, therefore, misleading to present adaptation as an alternative to cutting emissions.
The IPCC says that risks “will become increasingly complex and more difficult to manage” as climate change worsens. It also stresses that there are limits to adaptation, some of which have already been reached.
In response to the latest IPCC assessment report, Dr Aditi Mukherji told Carbon Brief:
“Effectiveness of most adaptation responses decreases drastically at global warming levels of 1.5C to 2C, showing that mitigation and adaptation efforts have to go hand in hand.”
In its latest advice to the UK government, the CCC set out the need to prepare for extreme heat, drought and flooding and states: “Without global emissions reductions, these risks may go past the point where the UK can protect itself with adaptation measures.”
FALSE
Tice: “It’s much cheaper to adapt to climate change than to think you can stop it.”
Bloomberg, May 2026
Cutting emissions to net-zero will be much cheaper for the UK than dealing with the economic damages of unmitigated climate change, according to the OBR.
In addition, adapting to unavoidable warming will be far cheaper than “facing the damages”, according to the CCC.
While Tice frequently presents a false dichotomy between cutting emissions and adapting to climate impacts, they are not either/or alternatives. In fact, both are required to reduce the dangers of climate change – and both will require substantial investment.
Climate-related damages are already costing the UK, with one recent estimate concluding that the June 2026 heatwave alone led to a £1.15bn hit to the economy.
These costs will spiral if global emissions are not reduced. It is well established that the cost of inaction on climate change is considerably higher than the cost of cutting emissions.
The CCC estimates that climate change is already costing the UK economy £60bn a year in damages and this could rise to around £260bn by 2050, under around 2C of global warming.
The committee says a comprehensive climate-adaptation programme in the coming decades will reduce these costs.
As the chart below shows, CCC analysis has concluded that an adaptation package covering heat and health, urban heat and water scarcity could avoid up to £12bn a year in climate-damage costs across the UK by the 2050s.

In total, climate-adaptation actions are expected to cost at least £11bn per year out to the 2050s – a considerable sum, but one that the CCC says is “manageable” and will largely come from private-sector investment.
At the same time, the CCC says there is a risk of “catastrophic damages”, especially if warming continues to rise above 2C. Given this, it stresses that “reductions in global greenhouse gas emissions remain essential” to minimise such risks.
FALSE
Tice: “The issue [with drought] is not the quantity of water in the UK. The issue is how the water companies do or don’t capture it.”
Bloomberg, May 2026
Climate change is making drought more frequent and severe in the UK, even as it makes winters wetter than they were in the past.
This is increasing the need for new reservoirs and other measures to manage the quantity of water available in the UK throughout the year.
The summer of 2026 saw record-low levels of rainfall across much of the south of England and Wales, as shown in the map below.

July 2026 was the driest month on record in England and Wales, according to the Met Office. This coincided with the two nations recording their sunniest July on record as well.
These “remarkable conditions” in 2026 come as part of a summer “marked by multiple heat records, which have contributed to drought conditions”, the Met Office notes.
The Environment Agency says that, due to climate change, “we are experiencing longer, hotter summers…leading to an increased likelihood of drought”.
FALSE
Tice: “I’m old enough to remember 1976. This feels a bit the same. That was 50 years ago.”
Press conference, August 2026
Since 1976, global warming has made heatwaves “more frequent, long-lasting and intense”.
As a result, summer 2026 was the UK’s hottest on record, with the Met Office finding that this was made around 130-times more likely by human-induced climate change.
Moreover, this year’s record means that summer 1976 is now only the seventh-warmest for the UK, with the top five all having occurred since 2003.
In the summer of 1976, there were 15 consecutive days when somewhere in the UK was above 32C. This led to water shortages and frequent wildfires, followed by flash floods.
There has been a lot of comparison to this “historic event” amid the record-breaking temperatures seen in 2026.
However, climate change means that a 1976-style weather pattern would be 3-4C hotter today than it was at the time.
There were just three days in which UK temperatures breached 36C in the entire 20th century, including 1976. Yet there were three days above 36C in 2026 alone.
Summer 2026 also saw 10 separate days with temperatures above 35C, breaking the previous record of five days, which had been set in 1976.
Additionally, the humidity was much higher in 2026 than in 1976. According to the Met Office, this meant that “even where peak air temperatures were comparable, the perceived heat and associated health risks were often greater in 2026”.
Clean energy
MISLEADING
Tice: “80% of the offshore renewables is overseas owned. So the British consumer is being shafted to help overseas investors.”
Bloomberg, May 2026
Around the world, more than 90% of new renewable power projects are cheaper than new fossil-fueled generation.
An energy system built around renewable power and electrified technologies such as EVs is also the lowest-cost option in the UK.
While it is true that more than 80% of UK offshore windfarms are owned by foreign companies, this is just a feature of the country’s privatised energy sector.
For example, 40% of North Sea oil and gas licences are also owned by foreign investors.
Additionally, regardless of the windfarms’ owners, their presence on the electricity grid is helping to protect consumers from high fossil-fuel prices.
In 2025, windfarms cut wholesale power prices by a third, according to the Energy and Climate Intelligence Unit thinktank.
MISLEADING
Tice: “Why are we so stupid that we spent £700m on Hinkley Point C, £700m of taxpayers’ cash, to protect a bunch of salmon? About 70 salmon, for God’s sake.”
Bloomberg, May 2026
Hinkley Point C nuclear power plant will include a system designed to protect millions of fish.
However, the cost of this system amounts to just 1.5% of the overall £46bn cost of building the new reactors in Somerset.
The £700m system is expected to stop more than 2.6m fish a year from being sucked into the cooling pipes at the site on the Severn estuary.
Additionally, the use of the system is replacing plans to flood 900 acres (364 hectares) of farmland in neighbouring Gloucestershire, originally proposed by the site’s main developer, EDF.
The construction of Hinkley Point C is being financed by EDF and the China General Nuclear Power Group, not the taxpayer. When it begins generation, it will benefit from a “contracts for difference”, which is funded via electricity bills.
MISLEADING
Tice: “A hell of a lot more people have died building wind turbines than have died in the nuclear power industry. Little stated fact by the renewable industry.”
Bloomberg, May 2026
Both wind and nuclear power are considered to be among the safest forms of energy generation in the world.
There are occasional fatalities among workers at windfarm construction sites, but these are very rare, particularly when compared with accidents in the fossil-fuel industry.
This is before taking into account that fossil-fuel pollution is responsible for one in five deaths globally, according to research by University College London.

Analysis from 2020 suggests that solar power was the safest source of energy, followed by nuclear and then wind. All three clean-energy sources are orders of magnitude safer than fossil fuels, as shown in the figure below.
For example, each unit of electricity generation from coal is associated with more than 600 times as many deaths as the same amount of power from wind.
Our World in Data, a non-profit collaboration between the University of Oxford and the Global Change Data Lab, which did the analysis, explains:
“People often focus on the marginal differences at the bottom of the chart – between nuclear, solar and wind. This comparison is misguided: the uncertainties around these values mean they are likely to overlap.
“The key insight is that they are all much, much safer than fossil fuels.”
MISLEADING
Tice: “[Solar is a] good use of rooftops, there’s no subsidy on those.”
Bloomberg, May 2026
Solar power is the cheapest electricity in history and keeps getting cheaper.
It is expected to play a key role in the energy transition, including in the UK.
While the government’s subsidy scheme for domestic solar – the “feed-in tariff” (FiT) – closed to new applicants in 2019, several other incentives have subsequently been introduced.
It was directly replaced by the “smart export guarantee”, wherein utilities pay households for any excess power they generate from their solar installations. This – together with the savings from using self-generated power – helps to offset the cost of the installation of solar panels.
Additionally, the government’s warm homes plan offers grants and loans designed to triple the number of homes with rooftop solar by 2030.
Ultimately, Tice’s focus on rooftop solar (which his firm uses) positions it in opposition to ground-mounted solar farms – creating a false dichotomy between a “good use” and a “bad use”.
Ground-mount solar is set to play a significant role in decarbonising the UK. It is much cheaper than rooftop solar and is not limited by the availability of rooftops.
FALSE
Tice: “All the renewables, all the wind turbines and the solar farms, they want a fat subsidy for very long-term contracts.”
Bloomberg, May 2026
Renewables are the cheapest source of new electricity in the UK, where recent surges in energy bills have been predominantly due to the role of gas in setting electricity prices.
The first subsidy-free solar farm in the UK was opened in 2017 near Flitwick in Bedfordshire.
Across the UK, there are now a number of subsidy-free solar and windfarms, which either rely on selling power into the market or private power purchase agreements.
The majority of solar and windfarms hold government contracts, but these are fixed-price deals rather than subsidies.
The new wind and solar projects secured at the latest government auction of “contracts for difference” will be significantly cheaper than new gas, according to the government.
No new gas plants have been built in the UK without long-term subsidy contracts through the government’s capacity market. In addition, the price of fuel for gas-fired generation continues to spike in response to the latest global energy crisis in the Middle East.
The most recent large new gas plant was Keadby 2, which opened in 2023 and would now cost 3.5-times as much to build, according to its owner.
FALSE
Tice: “There is nothing environmentally friendly about covering 100 square miles of Lincolnshire, agricultural, productive farmland, with solar panels, surrounding whole villages, decimating property prices in those villages or making them unsaleable, and thinking that’s going to end well.”
Bloomberg, May 2026
Even if solar farms expand in line with net-zero targets, they would cover just 0.7% of land in the UK – less than golf courses do currently.
Solar farms are very rarely built on productive agricultural land in the UK – with the majority built on low-grade land – and pose “no threat to national food security”, according to the National Farmers Union.
There is limited evidence that property prices are impacted by solar farms, with some studies suggesting that well-screened solar farms have no impact.
A London School of Economics study from 2021 did “not find any statistically significant effects [of solar on house prices], even at relatively small distances of 1km”.
Other studies have found very small negative impacts – on the order of 1-3% – while one study of 70 solar farms in the US identified a small boost to house prices.
As such, there is nothing to suggest that solar farms either “decimate” property prices or make homes “unsaleable”.
FALSE
Tice: “I drive a Tesla. Do I think it’s going to change the climate? No.”
Bloomberg, May 2026
As an electric vehicle (EV), driving a Tesla is far better for the environment than a petrol or diesel car, as it produces fewer greenhouse gases, air pollutants and noise.
Typically, an EV driven in Europe emits around two-thirds fewer greenhouse gas emissions than an equivalent petrol car, even accounting for battery production and disposal.
Carbon Brief analysis found that a Tesla Model Y, for example, will emit about 68% less CO2 over its lifetime than the average petrol car.
In addition to cutting costs for drivers, EVs are a key part of decarbonising road transport.
In the UK, transitioning away from petrol and diesel vehicles to EVs is expected to account for 23% of the total reduction in emissions being targeted by 2050. Net-zero is the “only way” to halt global warming.
MISLEADING
Tice: “The government says that the cost of renewable subsidies in the last 15 years is £100bn.”
Press conference, February 2025
Upfront renewable subsidies – in the UK and elsewhere – have helped deliver dramatic reductions in the cost of wind and solar power.
Since 2010, the cost of solar power has fallen by 89%, onshore wind by 71% and offshore wind by 63% – and these declines are set to continue.
As a result, 90% of new wind and solar installed in 2025 was cheaper than new fossil-fuel power, according to the International Renewable Energy Association (IRENA).
In the UK, wind power saved consumers more than £100bn between 2010-2023, after accounting for renewable subsidies, according to researchers at University College London.
In contrast, high fossil-fuel prices since the global energy crisis in 2022 had already cost the UK more than £180bn by the end of 2025, according to ECIU, with the first six months of the Iran crisis adding another £10bn in extra costs.
FALSE
Tice: “Those farmers who want to sell out to the renewable industry for solar farms – you can’t have it both ways, folks. Either you’re part of food production, part of food security for our nation, or you’re part of the renewables industry.”
Press conference, February 2025
Contrary to Tice’s claims, farmers can – and indeed often already do – “have it both ways”. Government statistics for 2023/24 suggest that 32% of farm businesses make use of renewable energy, mostly solar power.
Furthermore, some 37% of farmers, landowners and tenant farmers say the revenue from solar power helps secure their farms for future generations, according to interviews carried out by trade association Solar Energy UK.
Finally, solar can also be combined directly with food production through the use of “agrivoltaic” systems. This concept combines farming – including livestock grazing and shade-tolerant crops – with solar panels and has been gaining momentum as a solution to land-use conflicts.
FALSE
Tice: “The British people are not being told that these battery energy systems are dangerous – and until they can be proven to be absolutely safe, they should be banned.”
Press conference, February 2025
Battery energy storage systems are safe and getting safer all the time.
In the UK, there are over 1,659 large-scale battery storage projects and there have been only two reported fires in the past five years – neither of which had any injuries or fatalities.
Home battery storage systems are also safe. A recent study that looked at installations in Germany found the probability of a fire is 0.005% – this is around the same level as a tumble-dryer fire, 50 times lower than a general house fire and 18 times lower than a petrol or diesel engine fire.
(In contrast, there has been a spate of fires at UK waste facilities caused by the inappropriate disposal of lithium batteries in consumer devices, usually vapes.)
FALSE
Farage: “The argument that wind power makes us less reliant on other sources of energy from around the world just is not true. The national grid is not fit to deal with intermittent renewable energy.”
Press conference, August 2025
Wind power is already making the UK less reliant on imported fuels.
Moreover, expanding clean-energy supplies will be a much more effective route to reducing the UK’s reliance on energy imports than efforts to increase North Sea drilling.
ECIU found that the growth of offshore wind had reduced the nation’s spending on imported fuels by at least £30bn by the end of 2025.
Separately, Carbon Brief analysis found that wind and solar saved the UK from gas imports worth £1.7bn in March and April 2026 alone, amid the pressures of the Iran war.
The UK’s electricity grid does require upgrades as part of the transition to an energy system dominated by renewables, EVs and heat pumps. This transition will enable the UK to cut its imports of not only gas for heat and power, but also oil for transport.
Regardless of net-zero targets, higher spending on the electricity network is partly making up for decades of “under-investment”.The grid needs upgrades to connect new nuclear plants and data centres, as well as to meet growing electricity demand from homes and businesses.
Despite the need for investment, there is nothing to suggest that the grid is “not fit to deal” with renewables.
Power cuts for the average UK household are now happening 43% less often than they did in 2011. During that time, renewables have grown from 9.5% to 47% of electricity supplies.


The post Factcheck: Reform UK’s 45 false or misleading claims about climate and energy appeared first on Carbon Brief.
Factcheck: Reform UK’s 45 false or misleading claims about climate and energy



-
Climate Change1 year ago
Guest post: Why China is still building new coal – and when it might stop
-

 Greenhouse Gases2 years ago
嘉宾来稿:满足中国增长的用电需求 光伏加储能“比新建煤电更实惠”
-
Greenhouse Gases1 year ago
Guest post: Why China is still building new coal – and when it might stop
-

 Climate Change2 years ago
嘉宾来稿:满足中国增长的用电需求 光伏加储能“比新建煤电更实惠”
-

 Renewable Energy11 months ago
Sending Progressive Philanthropist George Soros to Prison?
-
Climate Change2 years ago
Bill Discounting Climate Change in Florida’s Energy Policy Awaits DeSantis’ Approval
-
Greenhouse Gases1 year ago
嘉宾来稿:探究火山喷发如何影响气候预测
-

 Carbon Footprint2 years ago
US SEC’s Climate Disclosure Rules Spur Renewed Interest in Carbon Credits