

暴雨、洪水和热浪等极端天气事件被称为中国的“新常态”。
今年四月的暴雨和洪水导致中国损失近120亿元人民币(16.5亿美元),灾害损失“为近10年同期最重”。六月,中国约有33条河流“超过警戒水位”,数十人丧生。广西桂林遭遇自1998年以来最大洪水。
不到一年前,北京气象部门在2023年7月的短短五天内记录了745毫米的降雨量,几乎是该市往年整月的降雨量。
北京周边的河北省在同一时间也出现了强降雨。2023年7月,临城县的降雨量超过1米,是其年平均降雨量的两倍。
2021年7月,河北的邻省河南出现了“千年一遇”的暴雨。
虽然中国已经出台了更多政策来改善其应急系统和基础设施,但日益增多的极端天气事件仍继续带来挑战。
在本篇Q&A中,Carbon Brief将探讨中国近期洪灾的原因、中国如何适应洪灾,以及是否需要未雨绸缪、重新审视其防洪系统。
近期洪灾背后的原因是什么?
近年来频繁发生的暴雨和洪水背后有各种因素。

英国布里斯托尔大学地理科学学院名誉研究员奥利弗·温(Oliver Wing)博士告诉Carbon Brief:“总体而言,由于克劳修斯-克拉佩龙方程,我们预计气候变暖的世界将更加湿润。”
根据该方程,气温每升高1°C,空气中的湿度通常会增加约7%,这意味着气候变暖时降雨量可能会更大。
奥利弗·温指出,“对于日以下降雨量,我们看到的比例关系比该方程所显示的还要大。这使得地表水(更有可能)由于短时和高强度的局部降雨增加而在城市形成洪水”。
此外,他表示,“气候变暖正导致大多数地方的海平面上升,这意味着风暴潮造成破坏的基线更高”。
据《中国日报》引述中国气象局国家气候中心首席预报员郑志海称,自四月份以来,中国广东和广西等南部沿海省份频繁出现强降雨,其原因是“高于正常水平的温度”。
郑志海补充说,厄尔尼诺/南方涛动(在2023年中期进入厄尔尼诺升温阶段的自然气候周期)是部分原因,因为其提高了海面温度,并将大量水蒸气从南中国海和孟加拉湾引向中国南部。
宁波诺丁汉大学地理科学系系主任陈加信博士告诉Carbon Brief,今年4月广东的降雨模式与2023年9月6日至8日台风“海葵”过后的强降雨十分相似。
具体而言,强降雨是由来自东南亚和南亚季风模态中的低压湿气流,与来自菲律宾和西太平洋的另一个低压雨带碰撞产生的。
台风“海葵”给香港带来了140年来最严重的暴风雨,并在广东和福建两省造成了最严重的降雨。
陈加信表示,虽然在气象学意义上这些强烈暴风雨并不罕见,但由于全球变暖,其发生的频率越来越高。
四月是季风季的开始。大范围的暴风雨通常在四月平均发生三次。但是,今年中国仅在该月就遭受了至少八次区域性极端降雨事件侵袭,而且都是接连发生的。
在重庆和湖南等受影响地区,河流洪水的现象十分普遍。对于一般的河流洪水来说,确定原因可能更为复杂。
“有很多调节因素。在气候变暖的情况下,较干燥的土壤可能会使土地吸收更多降雨,从而减轻洪水带来的危害。许多洪水不是由强降雨造成,而是由融雪或落在饱和土壤上的低强度、长时间降雨造成的。 因此,单凭气候变暖导致降雨量增加不能合理推断出河流洪水也会增加。”奥利弗·温说。
陈加信表示,自然原因“当然”增加了湿度,“但人类引起的气候变化导致温室效应,造成海水温度上升,从而引起更多的风暴和低压雨带。这是事实。”
奥利弗·温同意,人类导致的气候变化的“热力学影响”增加了与风暴相关的降雨量。
但他补充道:“我们不甚了解的是,人为气候变化如何改变了气候系统的动态,以及这种变化在哪里和如何加剧或抑制了热力学响应。”
人类导致的气候变化起了什么作用?
许多研究发现,海面温度升高正在加剧高强度的连续极端降雨。
联合国政府间气候变化专门委员会(IPCC)的第六次评估报告(AR6)也指出,温室气体排放造成的人为气候变化导致海洋变暖,这也“很可能是已观测到的全球陆地强降水加剧的主要驱动因素”。
根据第六次评估报告,在全球相比工业化前升温1.5°C的情况下,东亚和中亚极端年最大日降雨量(Rx1)和五日累积降雨量(Rx5)预计将比1971年至2000年分别增加28%和15%。
该报告还指出,与之类似的是,在中国的城市群中,“全球从升温1.5°C增加到2°C可能会使非常潮湿日子的总降水强度增加1.8倍,最大五日降水量增加一倍”。
中国气象局中国气象科学研究院的陈阳教授告诉Carbon Brief,中国人为造成的强降雨的强度甚至超过预期。
“由于气候变暖导致大气湿度增加,潜热释放与潮湿风暴中的上升运动之间的反馈作用更强,因此人为造成的中国季风区强降水的加剧程度明显大于预期。”他解释说。
他补充说,与纬度相似的其他地区相比,这种反馈在中国东部尤为明显。
最近发表在《自然》上的一项研究还预计,由于气候变暖,中国的风暴活动将变得更加频繁和剧烈。研究显示,到21世纪末,中国东部沿海热带气旋的年平均发生频率预计将比现在增加16%。

除了人类活动引发的气候变化之外,城市设计和建造不当,以及地下水开采、城市发展导致的建筑物重量、城市交通系统和采矿活动造成的沉降,也会加剧洪灾。
美国路易斯安那州立大学社会学系助理教授凯文·斯迈利(Kevin Smiley)博士告诉Carbon Brief:“气候变化正在加剧极端天气的严重程度和频率。由气候变化引起的额外降雨可能会导致原本只是建筑物的停车场在下雨天出现水坑,而现在洪水会漫过建筑物大门,造成数千美元的损失。”
“重要的是要记住:气候变化是人为的,所以这种风险的增加也有人为的根源。”
中国如何适应日益频繁的洪水?
中国修建了许多大型水利工程来防止洪涝灾害,例如2002年启动的从长江取水的南水北调工程。
在中国国务院最新公布的《国家水网建设规划纲要》中,在2035年前建成“国家水网”是未来防洪的“骨干”措施之一。
文件中的“骨干”工程还包括主要河流上的大型硬工程结构,如堤防、防洪闸和河道泄洪网络,以减轻洪水风险。
与此同时,发表在《海洋与海岸管理》(Ocean & Coastal Management)杂志上的一项研究发现,“基于自然的解决方案”在中国也变得流行起来。
沿海岸线和河口恢复和保护淡水沼泽、红树林和湿地,正在被用来为潮汐和风暴潮提供缓冲。它们包括上海的崇明岛湿地(长江三角洲)和深圳湾的福田和米埔湿地(珠江三角洲)。
规划文件中提出的另一个概念是“加快智慧发展”,利用互联网、数据和技术来监测和预防洪水。
首都北京已整合高清摄像机、望远镜、雷达图和卫星云图的数据,以提供实时灾害更新,从而改善应急响应时间。
中国东部港口城市宁波与电信公司合作,分析大数据并发布信息。
应急管理部表示,这些措施使2018年至2022年因自然灾害造成的死亡和失踪人数与2013年至2017年相比减少了54%。2023年,死亡人数继续下降,但与2018年至2022年水平相比,被毁建筑物数量和直接经济损失分别上升了97%和13%。
2015年,海绵城市的概念被写入住房和城乡建设部的政策文件。该计划在全国推广,武汉(1100万人口)、郑州(1000万人口)等30个主要城市被选为试点城市。

这些海绵城市旨在通过城市地区的“绿蓝设施”,如绿色屋顶、透水路面和雨水公园,收集、净化和再利用至少70%的洪水。整个系统旨在一次性解决城市供暖、淡水匮乏和洪水泛滥等问题。
中国也改进了其恢复过程。例如,在2021年台风“烟花”期间,宁波的洪灾受害者通过改进的在线文件系统,在一小时内就能获得经济补偿。
这些措施效果如何?
陈加信告诉 Carbon Brief,中国“在洪水和干旱灾害的准备、应对和恢复方面做得非常好”,这是两种最具破坏性的自然灾害。
“作为一个全球南方国家,”他将中国称为发展中国家,“中国用海绵城市和增强生态的解决方案应对气候变化,做得相当不错”。
然而,温认为,基于自然的解决方案,如海绵城市,可能会“很快饱和”,因此“它们的作用可能会被夸大”。他继续说:
“这些类型的干预措施对于相对频繁的低强度降雨最有效。在非常强烈、罕见的降雨(其概率在全球变暖的情况下迅速变化)期间,它们将很快不堪重负,造成最大的破坏和痛苦。”
2021 年,一场“历史罕见”的暴雨和洪水影响了海绵城市郑州 1400 多万人,造成 398 人死亡,凸显了海绵城市在气候变化面前的局限性。
《自然》杂志的研究称,海绵城市的设计只能承受 30 年一遇的降雨事件。陈加信说,除此之外,它还会造成一种虚假的安全感。它鼓励更多人迁往高风险地区,导致这些地区的人口和资产增加,而这些聚集地的保护需求也应声而涨,形成一种被称为“堤坝效应”的循环。
堤坝效应是一种悖论:修建防洪堤坝会导致人们对洪水风险的认知降低,业主更有可能投资于自己的房产,从而增加堤坝决口时的潜在损失。
根据《自然》杂志的论文,洪水的影响是人口稠密的黄河三角洲和珠江流域面临的一个关键挑战,这两个地区都面临着很高的洪水风险。
斯迈利说:“当社会的脆弱性与灾害交织在一起时,风险就会显现出来。脆弱性是社会性的,社会脆弱性越大,洪水的影响就越大……社会的脆弱性还是不公平的。一个有一定财富和良好保险的家庭,比一个靠薪水度日的家庭能更快、更成功地从洪水中恢复过来。”
中国政府通过特别政府债券拨款超过一万亿元人民币(1380 亿美元),用于支持弱势公民和今年 3 月遭受自然灾害的地区重建。据官方媒体《环球时报》报道,超过一半的资金将用于“防洪等水利工程建设”。
但过去,财政支持的提供一直受到质疑。全球再保险公司慕尼黑再保险(Munich Re)称,2023 年台风杜苏芮袭击中国时,在总计约 250 亿美元的损失中,只有 20 亿美元得到了承保。
此外,2015 年至 2018 年间,这些海绵城市的建设已经花费了中国 15-18 亿元人民币(2.1-2.5 亿美元)。维护费用将使这笔费用更高。
《自然》杂志的作者建议政府应致力于将分散的“灰色基础设施”(排水沟、管道和泵站等建筑结构)整合到现有的绿色蓝色设施中,但不应仅仅依赖工程基础设施。
中国科学院西北生态环境资源研究所研究员舒乐乐博士告诉《知识分子》杂志:“仅靠传统的工程方法无法减轻目前强降雨的影响”。
“每次下大雨,它造成的损失都会成为头条新闻,主要是因为城市里住着太多人,”舒补充道。
洪水易发地区的政府部门合作不当也导致灾害管理缺乏统一调配。
《自然》杂志的研究补充说,就长江和珠江三角洲而言,其缺乏一个覆盖全区的、且可以“把地划分土和投资融合起来的水文系统”。
中国社会科学院生态文明研究所研究员郑艳博士在 2023 年北京洪水过后指出,政府机构往往只顾自己的管辖范围,只想着转移问题,迅速疏导洪水,这给下游地区的城市带来了压力。
斯迈利说:“洪水不会在意人为划定的市、区或省的边界。一个地方有效的城市设计可能会减轻那里的洪水风险,但会间接增加其他地方的风险。以正义为中心、集体思考(统一筹划)可以提供一个本地化的解决方案来帮助所有人有效恢复,而不是加剧不平等。”
中国可以从其他城市学到什么?
洪水是世界各地城市都面临的挑战,中国因此可以借鉴大量的想法和技术。
《自然》杂志的论文建议,长江三角洲和珠江三角洲可以向恒河-布拉马普特拉河-梅格纳河三角洲和湄公河三角洲学习,“通过利用和调整因气候变化和人类活动而迅速变化的三角洲潜在动态,改善其对沉降和侵蚀等区域挑战的应对”。
该论文还提倡建设一个“积极主动、具有前瞻性、具有足够能力限制洪水破坏性影响并及时恢复灾前状态”的弹性社会。
鹿特丹是一座四面环水、人口 60 万的荷兰三角洲城市。鹿特丹建造了蓄水设施,例如具有蓄水功能、面积相当于四个奥林匹克游泳池的地下停车场, 且安装了绿色屋顶和外墙来吸收雨水。
日本在东京郊区埼玉县在地下建造了一个复杂的混凝土隧道和拱顶网络。这个网络位于大约地下 14 层,可容纳的雨水可以装满 1,000 多个奥运会标准泳池。
这两个城市的地下洪水转移设施经常被用作气候变化前沿城市可行的防洪系统的典范。
香港在跑马地马场的下方也有一个类似的地下雨水储存系统,旨在抵御 50 年一遇的洪水事件。
然而,陈加信表示,防洪措施的有效性难以横向比较,因为每个城市的地理、人口、密度和地形都非常不同。
他告诉 Carbon Brief:“在我看来,中国的特大城市应该考虑利用地下空间来储存超强暴雨突然排放的极端雨水……东京和鹿特丹利用地下空间的做法就相当明智。”


The post Q&A:中国如何适应日益频繁的洪灾 appeared first on Carbon Brief.
https://www.carbonbrief.org/qa%ef%bc%9a%e4%b8%ad%e5%9b%bd%e5%a6%82%e4%bd%95%e9%80%82%e5%ba%94%e6%97%a5%e7%9b%8a%e9%a2%91%e7%b9%81%e7%9a%84%e6%b4%aa%e7%81%be/

Scientists have vowed to keep working on the next flagship set of reports for the Intergovernmental Panel on Climate Change (IPCC), after a political row over the timeline for their release saw its latest session suspended on Friday evening without agreement.
During the weekend, government officials and scientists alike expressed disappointment over the inability to reach a compromise before some delegates from developing countries and small island states had to leave the week-long meeting in Ethiopia to catch flights home.
The disagreement – which has persisted since early 2024 – turns on whether the three key parts of the AR7 assessment should all be published before the conclusion of the UN’s next Global Stocktake of global climate action, which is due to be completed in late 2028.
The IPCC issued a statement after the close of the session, saying that “key agenda items” – the timelines for the three AR7 reports, as well as the IPCC budget – remain open and under discussion. It said the IPCC’s plenary session and its deliberations on the pending agenda “will resume at the earliest opportunity”, giving no further details of when.
IPCC Chair Jim Skea told delegates in closing remarks that recent months had been some of the most turbulent for the climate science panel and that, if there were stronger words than “profound disappointment” he would use them, according to a summary published by the Earth Negotiators Bulletin (ENB). IPCC discussions happen behind closed doors.
IPCC scientists remained committed
In an open letter, issued on Monday, a group of nearly 120 scientists – from a total of 664 AR7 authors – said they “stand committed to continue working to deliver the AR7 reports in a manner that is rigorous, timely and inclusive, in line with our mandate to be policy-relevant”.
“An assessment that arrives after the decisions it is meant to inform cannot serve its purpose,” they emphasised. “The second Global Stocktake in 2028 is such a decision point, and the world should not have to face it without the IPCCʼs latest assessment.”
Europe, small islands and the least developed countries, plus many Latin American and developed nations, want the IPCC to meet this deadline, arguing that the findings from the UN climate science body are irreplaceable in the UN climate policy-making process.
However, around a dozen developing countries plus Russia have argued that the reports should come later in order to allow for greater research input from the Global South – something that, in their view, would make the findings fairer. They also claim that a shorter timeline would put excessive pressure on experts.
-
Who shapes climate science? The equity question facing the IPCC
Early completion of the next global climate science assessment reports risks excluding research from the Global South, which is key to ensuring the findings are fair -
Governments that support climate science must stand firm against naysayers
The IPCC is meeting to decide the timing of its next major report, as some countries try to delay it and weaken the case for faster emissions cuts


The most vocal of this group at last week’s meeting were India and Saudi Arabia, according to the ENB summary and a developed country diplomat. Critics see this push for a longer timeline as an excuse to deprive government decision-makers of the latest science and ease pressure on emerging economies to raise their ambition, particularly on cutting emissions.
Commenting on last week’s meeting, France’s ambassador for climate negotiations Benoît Faraco said a broad coalition of developed and developing countries from all five continents, “united in their support for science and the timeline proposed by scientists”, had withstood pressure “from a few countries” seeking to slow down the process of adopting the IPCC reports.
He added that France would not back down and would “continue to fight tirelessly for science, protect the integrity of information, and convince our partners that without the best available scientific data, we will be less effective in tackling climate change and protecting our populations”.
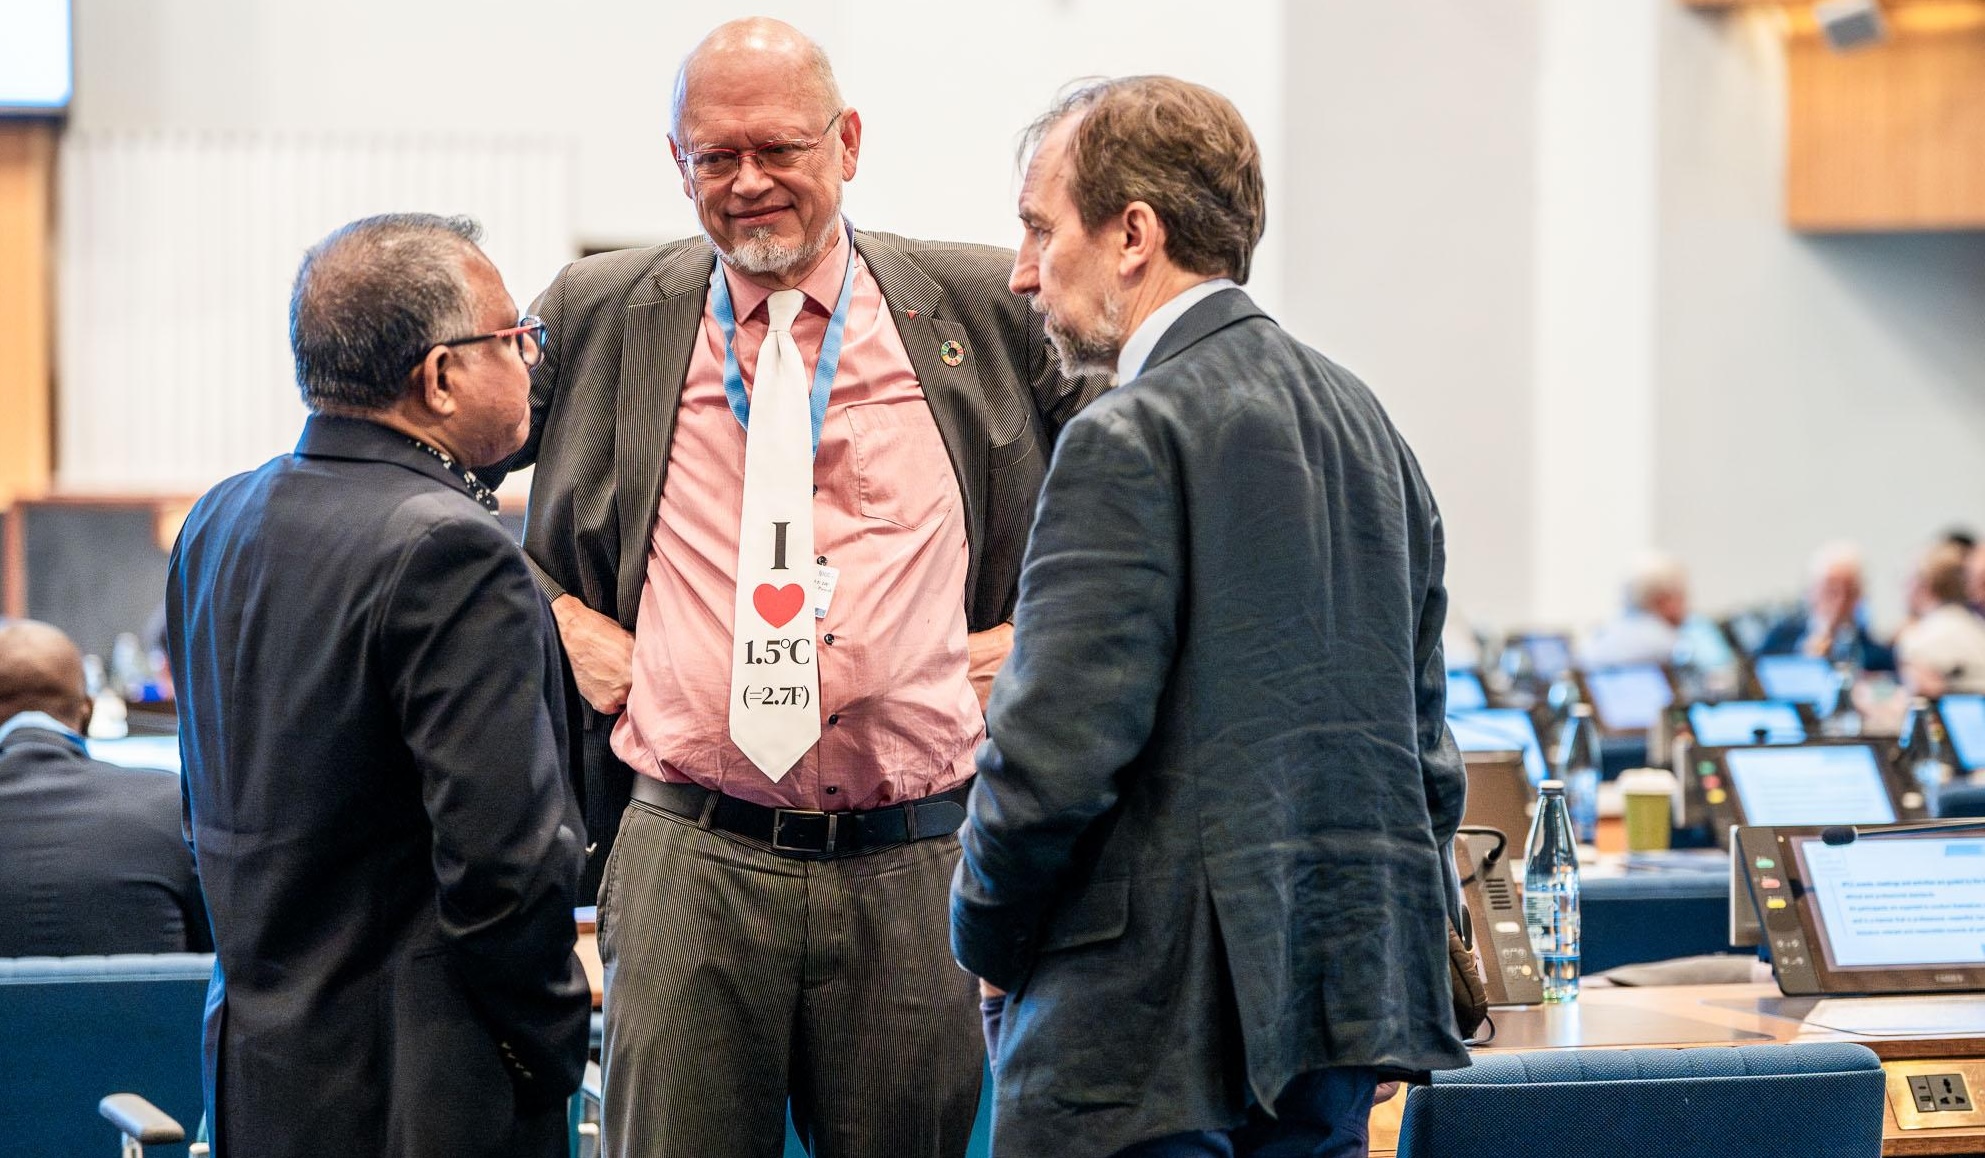
Inclusivity proposal stalled
In a bid to unlock a solution for the AR7 timeline, countries discussed ways to improve the inclusivity of the IPCC’s work. One option put on the table was for the IPCC to expand its funding for delegates from developing countries to attend some or all of its sessions from one to two participants, according to the ENB summary and a delegate speaking to Climate Home News.
That would increase the costs for the IPCC to complete AR7 by up to a quarter, according to an assessment shared by the secretariat. The panel’s budget is under severe strain and its officials have warned that, without additional voluntary contributions, it risks running out of money before it can deliver on this assessment cycle.
Climate Home News understands that some of the IPCC’s traditional donors – which mainly include European countries, Japan and Australia – indicated a willingness to support funding for an additional developing country participant. But without an agreement over the budget or the timeline for the reports, that option was ultimately not adopted.
‘Disappointed and worried’
The three reports are managed by working groups that collate and draw overall findings from the latest scientific studies and data on the physical effects of global warming around the world, how to adapt to it, and pathways for cutting planet-heating emissions in order to meet the temperature goals of the Paris Agreement.
Winston Chow, an urban climate professor at Singapore Management University who co-chairs Working Group II on adaptation, wrote in a LinkedIn post that he was “disappointed and worried” for the IPCC authors who have worked “extraordinarily hard” to assess the relevant climate science over the past two years.
He said he shared their concern that “the rigour, time and goodwill they’ve invested are now being put at risk by the Panel’s stalemate”.
As science comes under attack at UN talks, climate movement splits over how to respond
For Working Group II, a meeting for 250 experts writing that report is scheduled for January 2027, followed by the approval of a special report on cities and climate change in Singapore next March.
But because the IPCC’s budget has not been confirmed due to uncertainty about the AR7 schedule, travel support for those researchers is at risk, wrote Chow. “If they cannot participate, our assessments will lose vital expertise, perspectives and scientific breadth, and the collective effort of our authors will be undermined,” he warned.
Scientific work continues
Despite the political holdups, he – together with French climate scientist Robert Vautard, co-chair of Working Group 1 – agreed with IPCC head Skea who told the IPCC’s closing session on Friday: “The engine room of the IPCC is working, and it’s healthy.”
Vautard commented in a separate post on LinkedIn after it ended: “The boat is at full steam.” Working groups I and II are due to start revising the first drafts of their reports, while Working Group III on reducing emissions is finalising its first draft which will be out soon, he wrote.
“The most exciting two years of the cycle are ahead, for the authors. The momentum in the engine room is here and now. Trust the engine room!” he added.
The IPCC and some scientists report that progress has been made towards achieving an equitable balance of authors from the Global North and the Global South.
The group of researchers who signed the open letter on Monday noted that “inclusivity is at the heart of how we work”, with author teams bringing together experts from developed and developing countries with diverse backgrounds and at different stages of their careers.
Plea to overcome political differences
The signatories include several scientists from some of the countries opposed to the alignment of all IPCC reports with the Global Stocktake.
“We are committed to an assessment in which the knowledge, experience and priorities of every region are fully reflected, a commitment we share with the leadership of the IPCC.
Equity is built into how our assessment is being drafted,” they added.
They appealed to governments that make up the IPCC “to overcome their political differences and work together as we do as a global scientific community, so that we can deliver the IPCC reports the world needs to hear”.
In a statement published on Monday, IPCC chair Skea said reaching consensus on the schedule for the reports is “vital”. He added that the assessments provide au